
Markets Plunge: All Indexes Drop Sharply Amid Tariff Concerns
The Canadian Vanguard Stock Market Report – Tuesday January 20, 2026 Edition.
.
The Toronto Market
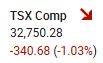
The S&P/TSX Composite Index declined 340.68 points, or 1.03%, closing at 32,750.28. Despite the setback, the benchmark remains in a short-term positive trend, having recorded gains in six of the past eight sessions. Today’s move represents a retracement of the advance that began last Wednesday, with the index revisiting the 32,750 level. Notably, the prior test of this level last week saw buyers emerge, allowing the index to recover from intraday lows and close higher at 32,916, suggesting near-term technical support in this range.

![]()
Today’s TSX Market Statistics
Market breadth was decisively negative, with decliners significantly outpacing advancers. A total of 1,659 issues declined versus 590 advancing issues, resulting in a decliner-to-advancer ratio of 2.81:1, with 141 issues unchanged.
Internal momentum weakened, as the number of new 52-week highs fell to 183, while new 52-week lows rose to 54. This compares with 326 new highs and 23 new lows recorded in the prior session, indicating a notable deterioration in upside participation.
Trading activity accelerated, with total TSX volume reaching 541.96 million shares, representing an 18% increase from the 458.82 million shares traded in the previous session, suggesting elevated distribution pressure.
Toronto Market Wrap-Up Report
The Toronto equity market endured a broad-based and decidedly bearish session, marked by heavy downside participation and clear risk-off positioning. The S&P/TSX Composite’s decline was reinforced by weak internal market breadth, confirming that today’s selloff was not isolated but systemic in nature.
Market internals deteriorated sharply, with declining issues overwhelming advancing issues by a ratio of 2.81:1 (1,659 decliners versus 590 advancers), alongside 141 unchanged stocks. This breadth profile aligns with the index-level pullback and signals distribution rather than healthy consolidation. While the index has performed well in recent sessions, today’s negative breadth suggests that selling pressure was widespread rather than confined to a few heavyweight names.
Further evidence of weakening momentum was seen in the 52-week high/low data. New 52-week highs fell to 183 from 326 in the prior session, while new lows rose to 54 from 23. This sharp contraction in new highs, coupled with expanding new lows, points to narrowing leadership and fading upside participation, often a precursor to short-term consolidation or further downside.
Trading volume increased materially, with TSX turnover rising 18% day-over-day to 542.0 million shares. Elevated volume accompanying declining prices typically reflects institutional selling pressure, reinforcing the bearish tone suggested by market breadth.
From a sector and factor perspective, investors rotated decisively toward defensive and inflation-hedging assets. Basic Materials (+1.61%) and Utilities (+0.49%) were the only sectors to close higher, underscoring a shift toward safety and hard-asset exposure. Strength within Basic Materials was driven primarily by gold, precious metals, and industrial metals miners, which dominated the list of top-performing TSX stocks.
Conversely, cyclical and growth-oriented sectors bore the brunt of the selling. Industrials fell 2.07%, Financials declined 1.46%, and Technology was hit hardest, plunging 5.61%, reflecting elevated sensitivity to risk aversion, valuation compression, and macro uncertainty.
Notably, EQB Inc., a digital financial services provider, was the only non-mining stock to appear among the top twelve TSX performers. The remainder of the list was dominated by gold and silver miners, highlighting the market’s continued preference for safe-haven exposure amid geopolitical and policy uncertainty. This pattern may persist in the near term, particularly while unresolved geopolitical issues—such as the ongoing uncertainty surrounding U.S. policy discussions related to Greenland—remain in focus. Markets historically discount uncertainty aggressively.
While the price of gold is unlikely to sustain its current rate of ascent indefinitely, short-term momentum remains strong, and investor attention to the sector is warranted. A tactical, responsive approach—remaining prepared to adjust positioning as conditions evolve—appears prudent.
Several of today’s outperformers are small- to mid-cap mining equities, many trading below $35 per share. Among larger, more established names, Agnico Eagle Mines Ltd. (TSX: AEM) rose 2.45% (+$6.93) to close at $289.25 on volume of 1.2 million shares, while Wheaton Precious Metals Corp. (TSX: WPM) gained 2.4% (+$4.66) to finish at $195.88 with 1.0 million shares traded. Both remain consistent leadership names within the precious metals space.
For investors with an interest in smaller-cap exposure, Kinross Gold Corp (TSX: K), Iamgold Corp (TSX: IMG), and Aya Gold & Silver Inc. (TSX: AYA) merit watchlist consideration. AYA advanced 7.32% to $24.91 on robust volume of 2.9 million shares, while IMG gained 4.34% to close at $27.42 with 4.0 million shares traded. As always, further due diligence is advised, particularly with respect to fundamentals, balance sheet strength, liquidity, and earnings consistency.
Bottom line: Today’s session reflected broad-based risk aversion, confirmed by weak breadth, rising volume on declines, and defensive sector leadership. Until market internals stabilize and leadership broadens, near-term caution remains warranted.
.
The US Markets
U.S. Market Indexes
U.S. equity markets posted a sharply bearish session, with all major indexes closing decisively lower and declines exceeding 1% across the board. The Dow Jones Industrial Average fell 870.74 points, or 1.76%, to 48,488.59. The S&P 500 dropped 143.15 points, or 2.06%, ending at 6,796.86, while the Nasdaq Composite suffered the steepest loss, plunging 561.07 points, or 2.39%, to close at 22,954.32.
The Russell 2000 declined 32.38 points, or 1.21%, to 2,645.36, outperforming the large-cap benchmarks on a relative basis. While all four major indexes finished in negative territory, the magnitude of today’s selloff is notable. Declines of more than 2% in the S&P 500 and Nasdaq—indexes comprising hundreds to thousands of constituents—signal broad-based selling pressure and reflect a distinctly risk-off, bearish market environment rather than isolated profit-taking.

U.S. Market Statistics
NYSE: Market breadth on the NYSE was negative, with declining issues exceeding advancing issues, though the imbalance was moderate relative to index-level losses. A total of 2,169 stocks declined versus 610 advancers, with 65 unchanged, resulting in a decliner-to-advancer ratio of approximately 1.30:1. Despite the negative breadth, internal leadership remained mixed, as the exchange recorded 759 new 52-week highs against just 55 new lows, an improvement from the prior session’s 518 highs and 69 lows. This divergence suggests that while broad selling pressure emerged, pockets of relative strength—primarily in defensive and commodity-linked names—persisted.
Total NYSE volume rose 3.6% to 5.38 billion shares, indicating increased participation and reinforcing the downside conviction reflected in the major averages.
NASDAQ: Breadth conditions were substantially weaker on the NASDAQ, consistent with the sharp selloff in growth and technology stocks. Decliners overwhelmed advancers by a ratio of 2.76:1, with 3,560 declining issues versus 1,288 advancing and 143 unchanged. Internal momentum deteriorated sharply, as new 52-week lows (195) exceeded new highs (163), a notable reversal from Friday’s 445 highs and 110 lows. This shift highlights accelerating downside pressure and leadership breakdown within growth-oriented segments.
NASDAQ trading volume increased 1.6% to 9.75 billion shares, suggesting active institutional selling rather than low-liquidity weakness.
Interpretation: The breadth and volume data confirm that today’s U.S. market decline was broad-based and distribution-driven, particularly within technology and growth-heavy indices. While the NYSE continues to show selective resilience through new highs, the pronounced deterioration in NASDAQ internals underscores a risk-off rotation away from growth and momentum factors. Until breadth stabilizes and new lows contract—especially on the NASDAQ—near-term downside risk remains elevated.
U.S. Market Wrap-Up Report
U.S. equity markets endured a decisively bearish session, with all major indexes closing sharply lower amid broad-based selling pressure and elevated risk aversion. Market internals confirmed that the decline was distribution-driven rather than orderly profit-taking, particularly within growth-oriented segments.
From a breadth and momentum perspective, conditions deteriorated meaningfully. NYSE breadth was negative, though relatively resilient compared with index losses, as decliners outpaced advancers while new 52-week highs continued to exceed new lows. This divergence suggests selective strength in defensive and commodity-linked equities, consistent with today’s sector leadership. In contrast, NASDAQ internals weakened sharply, with decliners overwhelming advancers by nearly 3-to-1 and new 52-week lows exceeding new highs—clear evidence of leadership breakdown within growth and technology stocks. Rising volume across both exchanges further reinforces the view that institutional selling dominated the session.
Sector performance reflected a pronounced risk-off rotation. Basic Materials was the only sector to close higher, supported by strong gains in gold and precious metals miners as gold prices surged to record highs. Technology was the clear laggard, falling 2.76%, underscoring continued pressure on high-multiple and momentum-driven names. The broader market tone remained rough and unambiguously negative, with no meaningful participation outside defensive and commodity-linked exposures.
The dominant macro driver was renewed geopolitical uncertainty stemming from President Trump’s rhetoric regarding potential U.S. control of Greenland and the accompanying threat of higher tariffs on opposing nations. Such rhetoric has amplified global uncertainty, prompting investors to seek refuge in hard assets, particularly gold bullion. While projections of gold reaching $5,000 per ounce remain speculative, the metal’s current trajectory reflects heightened demand for safety. Whether gold continues higher, consolidates, or reverses will likely depend on how geopolitical and trade-related tensions evolve.
From a factor-style perspective, today’s action highlighted a clear divergence between value and growth, as well as between small-cap and large-cap equities. Value-oriented and resource-heavy stocks significantly outperformed growth, driven by strength in Basic Materials and precious metals. Growth stocks—especially mega-cap technology—remained under sustained pressure, with NVIDIA down 4.38%, emblematic of the ongoing de-risking of crowded trades.
Meanwhile, small-cap stocks showed relative resilience, with the Russell 2000 outperforming large-cap benchmarks on a percentage basis. This suggests that selling pressure was more acute in large-cap, growth-heavy indexes, while domestically oriented and less-duration-sensitive names fared comparatively better.
Despite the broad weakness, selective strength emerged within technology subsegments. Memory manufacturers and fiber optic-related companies outperformed, indicating narrow, theme-driven leadership rather than broad sector recovery. Lumentum Holdings (LITE) closed approximately 10% above its 50-day moving average, and several fiber optic manufacturing stocks displayed notable technical strength. However, these pockets of outperformance were insufficient to offset broader market declines.
Bottom line: The session was characterized by risk aversion, growth-to-value rotation, and heightened demand for safe-haven assets. Weak breadth—particularly on the NASDAQ—combined with rising volume and defensive sector leadership suggests that near-term volatility remains elevated. Until growth leadership stabilizes and market participation broadens, the path of least resistance remains to the downside.
Commodities & Bonds — Market Snapshot (11:30 PM EST, Tuesday)
Oil:
U.S. crude rose to $60.55 per barrel earlier today and is currently $59.78 (+0.35%), as supply risks gain attention amid geopolitical uncertainty around Greenland.
Gold & Silver:
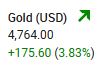
- Gold: $4,866.30 (+$99.80, +2.09%), hitting a new record high.
- Silver: $94.33 (-0.26%), slightly lower.
Bitcoin (BTC-USD): $89,355.80 (-$185.38, -0.22%).
10-Year Treasury Yield: 4.277% (up from 4.29% earlier today), marking a fresh four-month high.
After-Hours Futures:
- Dow: +96.00 pts (+0.20%)
- S&P 500: +19.75 pts (+0.29%) at 6,849.50
- Nasdaq 100: +68.50 pts (+0.27%) at 25,195.25
Commentary: Markets are responding to renewed geopolitical and trade tensions, including U.S. rhetoric on Greenland and potential tariffs on select EU countries. Futures indicate modest recovery after today’s declines, but overnight action may not correlate with tomorrow’s session.
Reminder: Overnight futures often have limited correlation to the following day’s regular trading session. All figures reflect market conditions at the time of capture only.
NOTICE TO READERS
The Canadian Vanguard Stock Market is about empowering you to build and manage wealth by yourself. There is certainly no magic in managing finances or wealth but one needs to know what to do and commit to doing what is needed. When you are ready to start the journey to Put Your Destiny In Your Own Hands, read The Canadian Vanguard every market day. If you wish to exchange ideas or need more information or for sophisticated market data analysis, please click Contact Us
Our readers are strongly advised to conduct their own research into individual stocks before making a purchase decision. In addition, investors are advised that past stock performance is no guarantee of future price appreciation. Any recommendation is not a guarantee of any particular stock’s future prices, and The Canadian Vanguard accepts no responsibility or liability for investors’ or readers’ purchases.
Stocks In The News/ Stocks To Watch and Market Strategy will soon be available but only to Paying Subscribers.
(c) This article is published by The Canadian Vanguard on January 20, 2026