The Canadian Vanguard Stock Market Report – Weekend February 27 – March 1, 2026 Edition
Inflation Data and AI Job Concerns Drive Choppy Trading, All Indexes Post Sharp Declines
. The Canadian Vanguard Stock Market Report is updated regularly during the weekend
The Toronto Market on Friday
The Toronto Market Index
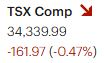
The S&P/TSX Composite Index fell 161.97 points (-0.47%) to close at 34,339.99, as choppy trading conditions persisted. The benchmark continues to oscillate between daily gains and losses, reflecting a market lacking clear directional conviction.
Despite the volatility, the index remains firmly above the 34,000 level and has yet to post back-to-back declines this year — a sign of underlying resilience and continued buying interest on pullbacks.
TSX Market Statistics
Market breadth was mildly negative, with 1,162 declining issues versus 1,052 advancing issues, resulting in a decliner-to-advancer ratio of 1.10:1. An additional 122 issues closed unchanged.
The exchange recorded 303 new 52-week highs and 29 new 52-week lows, compared with 366 highs and 16 lows in the previous session, indicating some moderation in upside momentum.
Total trading volume rose sharply to 785.7 million shares, up 56% from 503.7 million shares yesterday. The increase in activity, despite slightly negative breadth, suggests active sector rotation and continued investor engagement rather than broad-based selling pressure.
Friday’s Toronto Market Wrap-Up Report
The Toronto market traded in choppy fashion on Friday, reflecting ongoing volatility and cautious investor sentiment. The S&P/TSX Composite Index declined 161.97 points (-0.47%) to close at 34,339.99. Despite the pullback, the benchmark continues to hold above the 34,000 level and has yet to record back-to-back declines this year — a sign of underlying resilience amid heightened uncertainty.
Market Breadth & Volume
Market breadth was modestly negative, with 1,162 declining issues versus 1,052 advancing issues, producing a decliner-to-advancer ratio of 1.10:1. An additional 122 issues closed unchanged.
The TSX posted 303 new 52-week highs and 29 new lows, compared with 366 highs and 16 lows in the previous session, suggesting some moderation in upside momentum.
Total trading volume rose sharply to 785.7 million shares, up 56% from 503.7 million shares yesterday. Elevated activity alongside slightly negative breadth points to sector rotation rather than broad-based liquidation.
Sector Performance
Defensive sectors led the market as investors sought relative safety. Utilities (+1.52%) and Telecommunications Services (+1.45%) were the top performers. Basic Materials and Energy also closed higher, making them the only four sectors to finish in positive territory.
Six of the ten major sectors ended in the red. Technology (-3.57%) was the weakest performer, while Financials declined 1.72%. The continued rotation out of Technology and Financials suggests investors are repositioning toward defensive and commodity-linked names.
On a weekly basis, Basic Materials surged 8.48%, making it the top-performing sector. Utilities gained 2.44% for the week, reinforcing the defensive shift in positioning.
Commodities & Stock Highlights
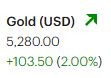
Gold, silver, and industrial mining stocks continue to provide relative stability amid geopolitical tensions and tariff-related uncertainty. A consistent performer such as Agnico Eagle Mines Ltd. remains a notable name for watchlists in the current environment.
CCL Industries Inc. was the top-performing TSX stock on Friday.
Several commodity-linked names also posted solid gains:
- Nutrien Ltd. rose 2.6%.
- Triple Flag Precious Metals gained 2.06%, closing at $56.40 on volume of 419K shares.
- Torex Gold Resources Inc. advanced 4.7% to $83.11, with 1.7 million shares traded.
- Alamos Gold Inc. climbed 3.05% to $73.93 on volume of 2.2 million shares.
Overall, Friday’s session underscored a market characterized by rotation, defensive positioning, and continued strength in precious metals amid macroeconomic and geopolitical uncertainty.
.
The US Markets
U.S. Market Indexes
U.S. equities closed mixed but broadly lower, with selling pressure concentrated in cyclical and growth-oriented sectors.
The Dow Jones Industrial Average fell 521.28 points (-1.05%) to 48,977.28. The S&P 500 declined 29.98 points (-0.43%) to 6,878.88, while the Nasdaq Composite dropped 210.17 points (-0.92%) to 22,668.21, extending its pullback for a second consecutive session.
Both the Nasdaq and S&P 500 opened lower and remained in negative territory throughout the session, mirroring Thursday’s trading pattern and reflecting persistent intraday selling pressure. Weakness in technology shares continues to weigh on the broader market, as investor concerns surrounding artificial intelligence-driven job displacement and potential labor market disruptions add to existing valuation pressures in the sector.
Technically, the Nasdaq remains below its 50-day moving average, a near-term bearish signal that suggests momentum has shifted to the downside. Investors may wish to exercise caution with technology exposure until clearer signs of stabilization emerge.
The Russell 2000 Index declined 44.93 points (-1.68%) to 2,632.36, making it the weakest performer among the major benchmarks. A drop exceeding 1% in small-cap stocks underscores risk-off sentiment and suggests reduced appetite for higher-beta names.
Overall, Friday’s session reflected defensive positioning, ongoing pressure in growth stocks, and heightened sensitivity to macro and structural themes surrounding AI and employment.

Friday’s U.S. Market Statistics
New York Stock Exchange (NYSE) : Market breadth on the NYSE was negative, with declining issues outnumbering advancers. There were 1,639 decliners versus 1,113 advancers, with 82 issues unchanged, resulting in a decliner-to-advancer ratio of 1.47:1 — roughly three decliners for every two advancers.
The exchange recorded 201 new 52-week highs and 66 new 52-week lows, a notable drop in new highs compared with 444 recorded on Thursday, while new lows remained relatively contained. The contraction in new highs suggests waning upside momentum.
Total NYSE trading volume reached 5.98 billion shares, approximately 10% higher than Thursday’s 5.45 billion shares. The rise in volume alongside negative breadth points to increased distribution rather than accumulation.
NASDAQ: Breadth was decisively weaker on the NASDAQ. Decliners totaled 3,195, compared with 1,650 advancers and 162 unchanged issues, producing a decliner-to-advancer ratio of 1.94:1 — nearly two decliners for every advancer.
The NASDAQ posted 214 new 52-week highs and 159 new 52-week lows. While new highs modestly exceeded the prior session’s 186, the increase in new lows from 112 to 159 reflects expanding internal weakness, particularly within growth-oriented names.
Total NASDAQ trading volume rose 6% to 9.91 billion shares, up from 9.32 billion shares yesterday. Elevated volume combined with weak breadth reinforces the negative tone and suggests sustained selling pressure in the technology-heavy index.
The U.S. Market Wrap-Up Report
Friday’s market session was challenging, with broad-based weakness across the major indexes as investors reacted to persistent inflation concerns and continued rotation out of growth-oriented sectors.
The Dow Jones Industrial Average fell 521.28 points (-1.05%) to 48,977.28. The S&P 500 declined 29.98 points (-0.43%) to 6,878.88, while the Nasdaq Composite dropped 210.17 points (-0.92%) to 22,668.21, extending its recent pullback. Both the Nasdaq and S&P 500 opened lower and remained negative throughout the session, reflecting sustained intraday selling pressure.
The Russell 2000 Index declined 44.93 points (-1.68%) to 2,632.36, making small caps the weakest segment of the market. A drop of this magnitude signals risk-off sentiment and reduced appetite for higher-beta names.
Sector Performance
Telecommunications Services and Energy were the leading sectors, benefiting from defensive positioning and commodity support. Six of the eleven major sectors finished higher, while four closed in negative territory. Technology and Financials were the primary laggards, as rotation out of these sectors continued.
Friday’s inflation report added to investor caution, reinforcing concerns that interest rates may remain elevated longer than previously anticipated — a headwind for growth and rate-sensitive sectors.
Technical & Sentiment Outlook
The Nasdaq remains below its 50-day moving average, reflecting deteriorating near-term momentum. Continued weakness in small caps and growth stocks suggests investors are positioning defensively amid inflation uncertainty and structural concerns surrounding AI-driven labor disruption.
Overall, Friday’s session reflected elevated volatility, sector rotation toward defensive areas, and heavier volume accompanying declines — conditions consistent with a cautious, risk-aware market environment.
Investor Takeaway
The market tone has shifted toward caution. Elevated volume on down days, weakening breadth, and continued pressure on technology and small-cap stocks point to a defensive posture among institutional investors. While major indexes remain above key longer-term support levels, near-term momentum favors selectivity and risk management. Investors may consider focusing on defensive sectors, commodity-linked names, and high-quality balance sheets while monitoring inflation data and technical levels for signs of stabilization.
NOTICE TO READERS
The Canadian Vanguard Stock Market is about empowering you to build and manage wealth by yourself. There is certainly no magic in managing finances or wealth but one needs to know what to do and commit to doing what is needed. When you are ready to start the journey to Put Your Destiny In Your Own Hands, read The Canadian Vanguard every market day. If you wish to exchange ideas, need more information or for sophisticated market data analysis, please click Contact Us
Our readers are strongly advised to conduct their own research into individual stocks before making a purchase decision. In addition, investors are advised that past stock performance is no guarantee of future price appreciation. Any recommendation is not a guarantee of any particular stock’s future prices, and The Canadian Vanguard accepts no responsibility or liability for investors’ or readers’ purchases.
Stocks In The News/ Stocks To Watch and Market Strategy will soon be available but only to Paying Subscribers.
(c) This article is published by The Canadian Vanguard on February 28, 2026