




Strong Jobs Report Ends Market Rally as Treasury Yields Rise
The Canadian Vanguard Stock Market Report Weekend September 4 – 6, 2026 Edition
.
The Toronto Market
Friday Toronto Market Index
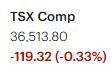
The S&P/TSX Composite Index closed Friday at 36,513.80, down 119.32 points (-0.33%), reversing after two consecutive sessions of gains. The pullback followed Thursday’s strong advance and was relatively contained, with the index holding well above the psychologically important 36,000 level.
Market Drivers
Friday’s risk tone was influenced by stronger-than-expected U.S. employment data, which reinforced expectations for a potentially more resilient U.S. economy and pushed U.S. Treasury yields higher. The rise in yields provided a headwind for equities and contributed to the TSX’s modest retreat.
The move lower should therefore be viewed in the broader context of a market digesting stronger economic data and adjusting to higher interest-rate expectations, rather than as a material deterioration in the underlying trend.
Technical Positioning
From a technical perspective, the TSX remains in a constructive position despite Friday’s decline. The index continues to trade comfortably above its 25-day, 50-day, and 200-day moving averages, preserving the broader bullish structure.
Market breadth was negative on Friday, indicating that selling pressure was relatively widespread. However, the weakness in breadth was not accompanied by a significant deterioration in the index’s overall technical internals. This suggests that, at this stage, the decline is more consistent with short-term profit-taking and consolidation than with a broad-based change in market direction.
Market Outlook
The 36,000 area remains the key near-term psychological and technical reference point. As long as the TSX maintains its position above this level and remains above its major moving averages, the medium- to long-term trend remains constructive.
For traders, the focus now shifts to whether the index can stabilize following Friday’s pullback and regain upward momentum. A sustained move back toward recent highs would reinforce the bullish setup, while a decisive break below 36,000 would warrant closer scrutiny of market breadth, momentum, and the major moving averages.
Bottom line: Friday’s decline represents a modest setback following a strong two-day advance. While breadth weakened, the TSX’s broader technical structure remains intact. For now, the pullback appears more consistent with consolidation within an established uptrend than a reversal of the prevailing trend.
Friday’s TSX Market Statistics
Market breadth improved materially on Friday, despite the TSX Composite closing lower on the session.
Advancing issues modestly outnumbered decliners, with 1,080 advancers versus 1,027 decliners, while 147 issues were unchanged. The relatively balanced distribution indicates that Friday’s index decline was not accompanied by a broad-based deterioration across the exchange.
The 52-week statistics provided a more constructive signal. The TSX recorded 35 new 52-week highs and 19 new 52-week lows, compared with 37 new highs and 52 new lows on Thursday. While the number of new highs edged lower, the number of new lows fell sharply, declining by approximately 63% from the previous session.
As a result, the new-high/new-low ratio improved substantially to approximately 1.8:1, from roughly 0.7:1 on Thursday. In other words, Friday produced nearly two new 52-week highs for every new 52-week low, compared with more new lows than new highs on Thursday.
Breadth Takeaway
The improvement in the new-high/new-low balance is noteworthy because it occurred despite the TSX pulling back 0.33%. This divergence suggests that the underlying market was more resilient than the headline index performance might imply.
From a trading perspective, Friday’s statistics therefore provide a constructive breadth signal. The decline in the Composite appears to have been driven more by consolidation following Thursday’s strong advance than by a broad deterioration in participation.
The key question heading into the next session is whether this improvement in internal breadth can persist. Continued expansion in new highs, together with a sustained decline in new lows, would strengthen the case that the broader uptrend remains intact. Conversely, a renewed expansion in new lows would warrant greater caution, particularly if accompanied by deterioration in the major moving averages.
Bottom line: Friday’s headline index decline understated the resilience of the underlying market. Although overall advancing and declining issues were relatively balanced, the sharp reduction in new 52-week lows and the improvement in the high-to-low ratio point to healthier market internals and improving participation beneath the surface.
.
Friday’s Toronto TSX Market Wrap-Up Report
The S&P/TSX Composite Index closed Friday at 36,513.80, down 119.32 points (-0.33%), ending a two-session winning streak. Although the index gave back some of Thursday’s gains, it remained firmly above the 36,000 level, leaving the broader technical structure intact.
Friday’s session represented a pause in the TSX’s recent advance rather than a decisive change in trend. The index is still trading comfortably above its 25-day, 50-day and 200-day moving averages, while the improvement in the market’s 52-week high-to-low balance suggests that underlying participation remains relatively healthy.
Friday’s Market Action
The session was mixed beneath the surface, with only three of the ten major sectors advancing. Nevertheless, the headline decline of just 0.33% indicates that the selling pressure was relatively contained at the index level.
Discretionary Consumer Goods & Services was Friday’s strongest-performing sector, advancing 1.22%, led by strength among retail-related stocks. Durable Consumer Goods & Services followed, gaining 0.72%.
On the downside, Basic Materials was the weakest sector, declining 0.98% after leading the market on Thursday. Energy fell 0.79%, while Technology declined 0.31%.
The Financials sector, which carries significant weight in the TSX, slipped 0.23%. Weakness among Canada’s major banks was particularly notable. National Bank of Canada was the only member of the Big Six Canadian banks to avoid a decline, closing $0.01 higher.
Among the major banks, Toronto-Dominion Bank (-0.98%) and Bank of Nova Scotia (-0.86%) were the weakest performers. Canadian Imperial Bank of Commerce (-0.15%) posted the smallest decline among the major banks.
Market Breadth and Internals
Despite the lower index close, Friday’s market internals were more constructive than the headline performance might suggest.
There were 1,080 advancing issues versus 1,027 declining issues, with 147 issues unchanged. More importantly, the TSX recorded 35 new 52-week highs versus only 19 new 52-week lows.
That represented a meaningful improvement from Thursday, when the exchange recorded 37 new highs and 52 new lows. The number of new lows fell sharply, while the new-high/new-low ratio improved to approximately 1.8:1, compared with roughly 0.7:1 on Thursday.
This improvement in the high-low balance is worth monitoring. The TSX declined on Friday, but the sharp reduction in new lows suggests that the underlying market did not experience a broad deterioration in participation.
Weekly Sector Performance
For the week, Durable Consumer Goods & Services was the strongest-performing sector, gaining 2.77%.
Other notable weekly gainers included:
- Telecommunications Services: +1.86%
- Healthcare: +1.41%
- Discretionary Consumer Goods & Services: +1.27%
- Financials: +1.08%
The major laggards were Technology, down 4.80%, and Basic Materials, down 1.14%.
The weekly sector performance highlights a notable rotation away from Technology and Basic Materials and toward consumer-oriented sectors, Telecommunications, Healthcare and Financials.
Key Takeaways for Traders and Investors
1. The 36,000 level remains an important reference point.
The TSX continues to hold comfortably above this psychological level. A sustained hold above 36,000 would keep the broader bullish structure intact, while a decisive break below it would increase the risk of a deeper consolidation.
2. Friday’s decline does not yet signal a technical breakdown.
The index remains above its 25-day, 50-day and 200-day moving averages. Traders should therefore distinguish between a normal pullback following a strong advance and an actual trend reversal.
3. Market internals were better than the headline index suggested.
The sharp decline in new 52-week lows and the improvement in the new-high/new-low ratio are constructive signals. Continued expansion in new highs would provide additional confirmation of underlying strength.
4. Sector rotation remains important.
Consumer-oriented sectors demonstrated relative strength, while Technology and Basic Materials remained areas of weakness. Traders should watch whether this rotation persists into next week.
5. Financials warrant close attention.
The Financials sector remains one of the most important drivers of the TSX. Continued weakness among the major Canadian banks could become a meaningful headwind for the index, particularly if it coincides with renewed weakness in other large-cap sectors.
Bottom Line
Friday’s 0.33% decline was a step backward, but it did not materially alter the TSX’s broader technical picture. The index remains above 36,000 and above its major moving averages, while the improvement in 52-week market breadth provides evidence that the underlying market remains relatively resilient.
For traders, the next focus should be whether the TSX can hold 36,000, stabilize after Friday’s pullback and resume its advance toward the 37,000 area. For investors, the more important signal is whether market participation continues to broaden beyond a narrow group of sectors and whether the number of new lows remains suppressed.
At this stage, the evidence continues to favor consolidation within a broader uptrend rather than a confirmed trend reversal.
.
The US Markets
Friday’s U.S. Market Indexes
U.S. equities finished Friday’s session broadly lower, with three of the four major indexes declining. The Russell 2000 was the exception, advancing modestly and outperforming the large-cap benchmarks.
The Dow Jones Industrial Average fell 271 points (-0.51%) to close at 53,414.25. The S&P 500 declined 29.11 points (-0.38%) to 7,718.60, while the Nasdaq Composite slipped 77.07 points (-0.29%) to 26,506.99.
In contrast, the Russell 2000 gained 7.38 points (+0.25%), closing at 2,975.65.

Friday’s Market Action
The major U.S. indexes opened below their previous-session closes and remained in negative territory throughout the session. Unlike Thursday’s powerful rally, Friday offered little evidence of renewed upside momentum in the large-cap benchmarks.
However, the magnitude of the decline was relatively modest, particularly when viewed against the strength of the preceding session. The S&P 500, Nasdaq Composite and Dow therefore gave back only a portion of their recent gains rather than experiencing a meaningful technical reversal.
The notable exception was the small-cap segment. The Russell 2000 advanced 0.25%, making it the strongest-performing major U.S. equity index on Friday. Although the move was modest, the relative strength of small-cap stocks is worth monitoring because sustained participation from smaller companies can provide useful confirmation of broader market risk appetite.
Technical Positioning
From a technical perspective, the large-cap indexes remain in a constructive position.
The Nasdaq Composite, S&P 500 and Dow Jones Industrial Average all continue to trade clearly above their 25-day, 50-day and 200-day moving averages. Friday’s relatively limited decline therefore did not materially damage their broader bullish technical structures.
The Russell 2000, however, remains technically weaker. The index continues to trade below both its 25-day and 50-day moving averages, although it remains clearly above its 200-day moving average.
This divergence is important. The large-cap benchmarks continue to exhibit stronger intermediate-term momentum, while small-cap stocks have yet to establish the same degree of technical strength. For traders, a sustained recovery in the Russell 2000 above its 50-day moving average would improve the market’s breadth and risk-appetite profile. Conversely, continued weakness below that moving average would suggest that small-cap participation remains a relative weak spot.
A break below a major moving average should not be treated as an automatic sell signal in isolation. Traders should instead consider volume, momentum, market breadth and whether the break is sustained. A high-volume breakdown below the 50-day moving average is generally more significant than a brief intraday move below it.
.
Key Takeaways for Traders and Investors
1. Friday’s weakness was orderly rather than disorderly.
The major indexes declined, but the losses were relatively modest following Thursday’s strong rally. There was no broad technical breakdown.
2. Large-cap technical trends remain constructive.
The Dow, S&P 500 and Nasdaq remain above their 25-day, 50-day and 200-day moving averages. Until that technical structure deteriorates, the broader trend remains favorable.
3. Small caps remain the key area to watch.
The Russell 2000 outperformed on Friday, but it remains below its 25-day and 50-day moving averages. Its ability to reclaim the 50-day average could provide an important signal about improving market participation and risk appetite.
4. Watch the divergence between large caps and small caps.
If the Russell 2000 begins to outperform while reclaiming its intermediate-term moving averages, it would represent a healthier broadening of the equity rally. Continued weakness, however, would indicate that the market’s advance remains more concentrated in larger-cap names.
5. Friday’s pullback should be viewed in context.
The more important question is not whether the indexes declined on Friday, but whether they can hold their major technical levels and resume their upward momentum. At present, the large-cap indexes remain in a considerably stronger technical position than the small-cap segment.
Bottom Line: Friday was a negative but relatively controlled session for U.S. equities. The Dow, S&P 500 and Nasdaq all retreated, while the Russell 2000 managed a modest gain and emerged as the session’s relative leader.
The most important technical takeaway is that the large-cap benchmarks remain comfortably above their major moving averages despite Friday’s pullback. This keeps the broader market trend constructive.
For traders, attention should now turn to whether the S&P 500 and Nasdaq can stabilize above their key moving averages and whether the Russell 2000 can build on Friday’s relative strength and reclaim its 50-day moving average.
For investors, the current setup remains supportive of the broader equity trend, but the continued weakness of small caps is a reminder that market participation has not yet fully broadened across the equity spectrum.
Friday’s U.S. Market Statistics
NYSE Market Statistics: The New York Stock Exchange (NYSE) finished Friday with market breadth essentially balanced. There were 2,245 declining issues versus 2,168 advancing issues, with 498 issues unchanged, producing a modest decliner-to-advancer ratio of 1.03:1.
The near-even distribution between advancers and decliners indicates that Friday’s weakness in the major indexes was not accompanied by a significant deterioration in overall participation. Breadth was marginally negative, but the difference between advancing and declining issues was relatively small.
The NYSE recorded 151 new 52-week highs and 167 new 52-week lows, compared with 284 new highs and 186 new lows on Thursday. The number of new highs fell by approximately 47%, while new lows declined by roughly 10%.
As a result, the new-high/new-low ratio deteriorated to approximately 0.90:1, or about 9 new highs for every 10 new lows, compared with approximately 1.53:1 on Thursday. This represents some weakening in the market’s longer-term breadth profile, although the change remains relatively modest in the context of recent market volatility.
NYSE trading volume totaled approximately 4.23 billion shares, down roughly 14% from Thursday’s approximately 4.92 billion shares. The decline in volume suggests that Friday’s pullback occurred with less participation than Thursday’s stronger advance.
NYSE Takeaway
Overall, NYSE internals weakened modestly on Friday but remained broadly healthy. The deterioration in the new-high/new-low ratio is worth monitoring, but the near-balanced advancer/decliner relationship and lower trading volume do not, by themselves, suggest a significant increase in market risk.
For traders, volatility remains a more immediate consideration than the underlying breadth data. The internals have softened somewhat, but there is currently no compelling breadth signal pointing to a major deterioration in market conditions.
NASDAQ Market Statistics: The NASDAQ posted slightly positive market breadth on Friday, with 2,552 advancing issues versus 2,356 declining issues and 455 issues unchanged. This produced an advancer-to-decliner ratio of 1.08:1, meaning that advancing issues modestly outnumbered declining issues.
Friday therefore marked the third consecutive session of positive NASDAQ breadth, an encouraging feature beneath the headline index performance.
However, the new-high/new-low statistics were less constructive. The NASDAQ recorded 80 new 52-week highs and 145 new 52-week lows, compared with 147 new highs and 164 new lows on Thursday.
New 52-week highs declined by approximately 46%, while new 52-week lows decreased by roughly 12%. Consequently, the new-high/new-low ratio weakened to approximately 0.55:1, or about 4 new highs for every 7 new lows, compared with roughly 0.90:1 on Thursday.
The deterioration in this measure indicates that, despite three consecutive sessions of positive daily breadth, the longer-term breadth picture remains somewhat less convincing. The market is seeing more stocks advance than decline on a day-to-day basis, but relatively few stocks are establishing new 52-week highs compared with those making new lows.
NASDAQ trading volume totaled approximately 6.71 billion shares, down about 12% from Thursday’s approximately 7.61 billion shares. The combination of a lower NASDAQ index, positive breadth and declining volume suggests that Friday’s weakness was not accompanied by a substantial increase in selling participation.
NASDAQ Takeaway
NASDAQ internals softened modestly on Friday, particularly in the new-high/new-low statistics, but the three-session streak of positive daily breadth remains a constructive counterpoint.
The decline in volume is also notable. A market retreat accompanied by lower rather than expanding volume generally provides less evidence of aggressive institutional distribution than a high-volume selloff would.
That said, the recent volatility warrants caution. One session of market statistics is rarely sufficient to establish a directional conviction, particularly following a strong rally such as Thursday’s advance. Traders should therefore focus on the trend in breadth and volume over several sessions rather than reacting to Friday’s figures in isolation.
Key Takeaways for Traders and Investors
1. Market breadth remained relatively resilient.
NYSE breadth was essentially neutral, while NASDAQ breadth remained modestly positive for a third consecutive session. Neither exchange showed evidence of a broad-based collapse in participation.
2. New-high/new-low statistics weakened.
Both exchanges experienced a significant reduction in new 52-week highs. This is the primary internal warning signal from Friday’s data and should be monitored over the coming sessions.
3. Lower volume reduces the significance of Friday’s decline.
Both NYSE and NASDAQ trading volume declined from Thursday’s levels. The combination of modest index losses and lower volume does not currently resemble a high-conviction distribution session.
4. NASDAQ breadth remains a relative positive.
Three consecutive sessions of positive advancer/decliner breadth provide some evidence that participation beneath the NASDAQ’s headline performance remains reasonably healthy.
5. Volatility remains the key trading risk.
The market’s internal structure has weakened somewhat, but not enough to indicate a material deterioration in risk conditions. For short-term traders, price volatility and intraday market behavior may currently be more important than the modest deterioration in breadth.
Bottom Line
Friday’s U.S. market statistics point to a modest loss of momentum rather than a material deterioration in market health.
NYSE breadth was virtually balanced, NASDAQ breadth remained slightly positive, and trading volume declined on both exchanges. The principal cautionary signal was the deterioration in the new 52-week high-to-low balance, particularly on the NASDAQ.
However, Friday followed a strong Thursday rally, and the major indexes remain above their key moving averages. The combination of resilient daily breadth, lower volume and intact large-cap technical trends argues against treating Friday’s session as a significant change in market direction.
For traders and investors, the key is to watch whether Friday’s softer internals persist or reverse. A continued decline in new highs accompanied by expanding new lows, deteriorating advancer/decliner ratios and rising downside volume would represent a more meaningful warning. Until that occurs, the evidence remains consistent with normal consolidation within a volatile but still broadly constructive market environment.
Friday’s U.S. Market Wrap-Up Report
(Your End of Day Market and Tomorrow’s Action Note )
U.S. equities pulled back on Friday as a stronger-than-expected jobs report pushed Treasury yields higher, prompting investors to reassess the interest-rate outlook. The rise in yields created a headwind for equities and brought an end to Thursday’s powerful market advance.
The Dow Jones Industrial Average declined 271 points (-0.51%) to close at 53,414.25. The S&P 500 fell 29.11 points (-0.38%) to 7,718.60, while the Nasdaq Composite slipped 77.07 points (-0.29%) to 26,506.99.
The declines were relatively orderly, however, with none of the major large-cap indexes experiencing a sharp selloff. The Russell 2000 was the notable exception, gaining 0.25% to close at 2,975.65. Small-cap stocks demonstrated relative resilience, with several individual small-cap names posting meaningful gains despite the weakness across the broader market.
Market Action and Technical Picture
Friday’s session was broadly negative for large-cap equities. The major indexes opened below their previous closes and remained in negative territory throughout the session.
Nevertheless, the relatively limited size of the declines is important when viewed against Thursday’s strong rally. The Dow, S&P 500 and Nasdaq Composite remain clearly above their 25-day, 50-day and 200-day moving averages, leaving their broader technical structures intact.
The Russell 2000 remains in a weaker technical position. Although it outperformed on Friday and remains comfortably above its 200-day moving average, it continues to trade below its 25-day and 50-day moving averages. A sustained recovery above the 50-day moving average would improve the technical picture and provide stronger evidence of renewed participation from small-cap stocks.
For traders, a move below a major moving average should not automatically be treated as a sell signal. The significance increases when the breakdown is decisive, sustained and accompanied by heavy volume, deteriorating breadth and weakening momentum.
Sector Performance: Sector participation was considerably narrower on Friday, with only three sectors advancing.
Technology was the strongest-performing sector, gaining 0.38%, followed by Industrials and Utilities, each up 0.11%.
On the downside, Telecommunications Services was Friday’s weakest sector, falling 1.38%. Energy declined 0.76%, while Basic Materials fell 0.56%.
Financials, down 0.51%, led the major losing sectors and represented an important source of pressure given the sector’s substantial influence on the broader market.
The sector distribution was notably less supportive than Thursday’s session, when market participation was considerably broader. On Thursday, Industrials (+2.15%) led the market, followed by Financials (+1.72%), Discretionary Consumer Goods & Services (+1.31%), Technology (+1.28%), Utilities (+0.96%) and Telecommunications Services (+0.82%). Energy (-0.73%) was the only major sector to decline.
The contrast between Thursday and Friday highlights how quickly leadership can rotate when macroeconomic expectations shift.
Weekly Sector Performance: Despite Friday’s pullback, several sectors posted solid gains for the week.
Energy was the week’s strongest sector, advancing 2.33%. Telecommunications Services gained 1.89%, while Technology and Financials advanced 1.06% and 0.97%, respectively.
Discretionary Consumer Goods & Services, down 1.66%, was the week’s weakest-performing sector.
The weekly performance points to continued rotation within the market rather than a uniform move across all sectors. Energy remained the strongest weekly performer, while Consumer Discretionary lagged.
Market Internals
The underlying market statistics were somewhat more constructive than Friday’s index performance might suggest.
NYSE breadth was essentially balanced, with 2,245 decliners versus 2,168 advancers, while NASDAQ breadth remained modestly positive, with 2,552 advancers versus 2,356 decliners.
However, the new-high/new-low balance weakened on both exchanges. The NYSE recorded 151 new 52-week highs and 167 new lows, while the NASDAQ posted 80 new highs and 145 new lows.
Trading volume also declined on both exchanges compared with Thursday. The NYSE traded approximately 4.23 billion shares, while NASDAQ volume was approximately 6.71 billion shares.
Taken together, Friday’s internals suggest that the market experienced some loss of momentum but not a broad-based deterioration. The lower volume is particularly relevant: the decline in the major indexes was not accompanied by a substantial increase in selling participation.
.
Individual Stocks and Trading Opportunities
Despite the broader market pullback, several individual stocks displayed significant relative strength, particularly in technology, semiconductors, data infrastructure and materials.
Within the semiconductor and data-storage complex, Western Digital gained 5.86%, Seagate Technology Holdings advanced 6.34%, and Sandisk surged 11.90%. Sandisk closed at $1,740.00 on approximately 16.6 million shares, making it one of the standout high-volume gainers of the session.
Micron Technology rose 6.10%, closing at $1,016.43 on approximately 35.2 million shares. Tower Semiconductor gained 7.85%, while Astera Labs advanced 9.75%. Marvell Technology also posted a strong 7.00% gain.
The strength across these semiconductor and storage-related names is notable because it occurred while the broader technology sector gained only modestly. This indicates that sector-level performance can conceal substantial dispersion among individual stocks, creating potential opportunities for active traders.
In the materials group, Gold.com gained 11.21%, while DPC Holdings advanced 7.99%.
In Energy, Iren rose 7.27%, while National Energy Services Reunited gained 0.72%.
The key message for active traders is that Friday’s market was not uniformly risk-off. Even as the major indexes declined, specific industries and individual stocks continued to attract strong buying interest.
.
Key Takeaways for Traders and Investors
1. Friday’s decline was primarily a macro-driven pullback.
The stronger jobs report pushed Treasury yields higher and created pressure on equities. The market’s response was negative, but relatively orderly.
2. The large-cap technical structure remains intact.
The Dow, S&P 500 and Nasdaq remain above their 25-day, 50-day and 200-day moving averages. Friday’s decline therefore does not yet constitute a meaningful technical breakdown.
3. Small caps showed encouraging relative strength.
The Russell 2000 gained while the major large-cap indexes declined. However, the small-cap index still needs to reclaim its 50-day moving average before its technical picture can be considered substantially improved.
4. Market internals softened but did not deteriorate dramatically.
NYSE breadth was nearly balanced and NASDAQ breadth remained slightly positive. The deterioration in new highs versus new lows is worth monitoring, but lower trading volume reduces the significance of Friday’s decline as a potential distribution session.
5. Stock selection remains critical.
The performance of semiconductor, storage and data-infrastructure stocks demonstrates that significant opportunities can remain available even during a weak index session. Traders should therefore pay close attention to relative strength, volume and sector leadership, rather than relying exclusively on index direction.
6. Watch Treasury yields and the interest-rate narrative.
Friday demonstrated how quickly a shift in rate expectations can affect equity valuations. Higher yields can be particularly important for growth-oriented and higher-duration stocks, making the relationship between Treasury yields and technology-sector leadership an important variable for upcoming sessions.
7. Maintain a defensive mindset without assuming a market reversal.
The technical evidence does not currently confirm a major change in trend. However, traders and investors should remain prepared to become more defensive if weakness begins to spread, volume expands on down days, new lows accelerate and the major indexes lose their key moving averages.
Bottom Line
Friday’s U.S. market session was negative but orderly, with the stronger jobs report and accompanying rise in Treasury yields providing the principal catalyst for the pullback.
The most important distinction is between price weakness and structural deterioration. The major indexes declined, but they remain above their principal moving averages. Market breadth softened, yet remained relatively resilient, while lower trading volume suggests that Friday did not represent an aggressive wave of institutional distribution.
At the same time, the strong performance of selected semiconductor, storage, data-infrastructure and materials stocks demonstrates that stock-specific opportunities remain available beneath the headline market weakness.
For traders, the next few sessions will be important. The key signals to monitor are Treasury yields, the 50-day moving averages, market breadth, new 52-week highs and lows, downside volume, and whether small-cap stocks can sustain their relative strength.
For now, the evidence continues to favor a pullback and consolidation within a broader uptrend rather than a confirmed market reversal. But given the recent volatility, maintaining disciplined risk management and being prepared to shift toward a more defensive posture remains prudent.
.
NOTICE TO READERS
The Canadian Vanguard Stock Market is about empowering you to build and manage your wealth by yourself. There is certainly no magic in managing finances or wealth but one needs to know what to do and commit to doing what is needed. When you are ready to start the journey to Take Charge and Put Your Destiny In Your Own Hands, start with reading The Canadian Vanguard every market day. If and when you need more related information or to advertise your business products or services in The Canadian Vanguard, Contact Us
Our readers are strongly advised to conduct their own research into individual stocks before making a purchase decision. In addition, investors are advised that past stock performance is no guarantee of future price appreciation. Any recommendation is not a guarantee of any particular stock’s future prices, and The Canadian Vanguard accepts no responsibility or liability for investors’ or readers’ purchases.
Stocks In The News/ Stocks To Watch and Market Strategy will soon be available only to Paying Subscribers. The dollar sign “$” in the Toronto Market section in the articles only stands for Canadian dollar and in the US market section “$” stands for US dollar.
(c) This article is published by The Canadian Vanguard on September 5, 2026