



Major Market Indexes Retreat as Rising Treasury Yields and Oil Prices Weigh on Stocks
The Canadian Vanguard Stock Market Report Tuesday September 8, 2026 Edition
.
The Toronto Market
Tuesday’s Toronto Market Index
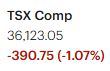
The S&P/TSX Composite Index suffered a sharp technical setback on Tuesday, falling 390.75 points, or 1.07%, to 36,123.05. The decline extended the index’s losing streak to two sessions and brought the benchmark back toward the psychologically important 36,000 level.

Technical Picture
Tuesday’s selling pressure materially weakened the short-term technical setup. The TSX opened at 36,421.61 and traded as high as 36,445.40 before reversing lower and finishing near the lower end of its daily range at 36,107.55. This produced a decisive bearish session and suggests that sellers maintained control into the close.
The index has now slipped below its 25-day moving average, signaling a deterioration in short-term momentum. However, the broader trend remains constructive as the TSX continues to trade above both its 50-day and 200-day moving averages. For intermediate- and longer-term investors, this distinction is important: the short-term trend has weakened, but there is not yet sufficient technical evidence to classify the broader uptrend as broken.
The next important test is the 36,000 support zone. A sustained break below this level would increase the probability of a deeper retracement and put the early-September low near 35,722 on the radar. A failure to hold that area would represent a more significant deterioration in the index’s technical structure.
On the upside, 36,400–36,450 represents the first area bulls need to reclaim to stabilize the short-term setup. Above that, traders will likely focus on the 36,600–36,700 area, followed by the August record-high zone around 36,958–36,992. The TSX established its record closing high at 36,957.63 on August 25.
Momentum and Market Breadth
The recent price action shows a clear loss of short-term momentum. Tuesday’s decline followed Friday’s 0.33% pullback and came after the index failed to sustain its recent advance toward record territory.
Market breadth was negative, with weakness concentrated in several heavily weighted areas of the market, particularly financials, while Shopify was also a significant drag on the index.
For traders, the key issue now is whether Tuesday’s decline develops into a normal corrective phase within the primary uptrend or becomes the beginning of a more substantial trend reversal. The answer will depend heavily on what happens around 36,000 and whether breadth deteriorates further.
Rates Remain a Headwind
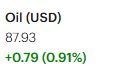
The macro backdrop is becoming less supportive for equities. U.S. 10-year Treasury yields were around 4.8%, near their highest levels since November 2023, while rising oil prices have renewed concerns about inflation. Higher yields increase the cost of capital and can place additional pressure on equity valuations, particularly when investors are already reducing risk exposure.
This creates an important cross-market signal for TSX traders: equities are weakening while bond yields are rising. If yields continue to move higher, the pressure on rate-sensitive sectors could intensify.
Bottom Line
The TSX remains in a primary uptrend but has entered a technically weaker short-term phase.
For traders, 36,000 is the key near-term pivot. Holding this level would keep the current decline within the context of a corrective pullback and leave the broader bullish structure intact. A decisive break below 36,000, followed by a move through the September low near 35,722, would substantially increase downside risk.
Conversely, a recovery back above the 25-day moving average would be the first indication that buyers are regaining short-term control. A subsequent move through 36,600–36,700 would strengthen the bullish case and put the recent record high back into focus.
Trading bias: Short-term momentum — Bearish
Intermediate trend: Bullish, but weakening
Key support: 36,000 / 35,722
Initial resistance: 36,400–36,450
Major resistance: 36,600–36,700 / 36,958
.
Tuesday’s TSX Market Statistics
Market breadth deteriorated sharply on Tuesday, with 1,542 declining issues versus 667 advancing issues, producing a decliner-to-advancer ratio of 2.31:1. In practical terms, there were roughly 12 decliners for every 5 advancers, while 138 issues finished unchanged.
The breadth reading confirms that Tuesday’s decline was broad-based rather than concentrated in a small number of heavily weighted TSX components. The substantial imbalance between decliners and advancers points to a meaningful increase in selling pressure across the exchange.
The 52-week high/low statistics also weakened materially. The TSX recorded 41 new 52-week highs and 67 new 52-week lows, compared with 35 new highs and 19 new lows on Friday.
While the number of new 52-week highs increased by approximately 17%, the more significant development was the surge in new 52-week lows, which increased by approximately 253% from Friday. Consequently, the new-high/new-low ratio deteriorated from approximately 1.84:1 on Friday to 0.61:1 on Tuesday. In other words, Tuesday produced roughly three new 52-week highs for every five new 52-week lows.
This deterioration in the new-high/new-low relationship is an important warning signal for short-term traders. Although the TSX remains above its longer-term moving averages, the sharp expansion in new lows indicates that internal selling pressure is broadening beneath the index level.
Market Internals: The combination of a 2.31:1 decliner-to-advancer ratio and a negative new-high/new-low ratio points to a meaningful deterioration in market breadth. More importantly, the acceleration in new 52-week lows suggests that weakness is beginning to spread beyond the index’s headline price action.
From a technical perspective, this creates a divergence worth monitoring: the TSX remains in a broader uptrend, but its internal structure is weakening. If breadth continues to deteriorate while the index tests the 36,000 support area, the probability of a deeper correction would increase.
For now, Tuesday’s statistics should be viewed as a short-term bearish signal within an otherwise longer-term constructive trend. Traders should watch whether declining issues remain dominant in subsequent sessions and, particularly, whether the number of new 52-week lows continues to expand.
Breadth: Bearish
Decliner/advancer ratio: 2.31:1
New highs: 41
New lows: 67
New-high/new-low ratio: 0.61:1
Short-term internal trend: Weakening
.
Tuesday’s Toronto TSX Market Wrap-Up Report
The S&P/TSX Composite Index suffered a broad-based selloff on Tuesday, falling 390.75 points, or 1.07%, to 36,123.05. Although the index managed to remain above the psychologically important 36,000 level, the close leaves that support zone increasingly vulnerable.
Tuesday’s decline extended the TSX’s losing streak to two sessions and pushed the index below its 25-day moving average, signaling a deterioration in short-term momentum. The broader trend, however, remains constructive, with the TSX still trading above its 50-day and 200-day moving averages.
The technical picture is therefore becoming more mixed: short-term momentum has turned bearish, while the intermediate- and longer-term trend remains bullish. The market’s ability to hold 36,000 will be particularly important in determining whether this is simply a normal correction or the beginning of a deeper pullback.
Market Breadth Weakens Sharply
Tuesday’s market internals were notably weak. Declining issues overwhelmed advancing issues, with 1,542 decliners versus 667 advancers, producing a 2.31:1 decliner-to-advancer ratio. In practical terms, approximately 12 stocks declined for every five that advanced, while 138 issues were unchanged.
The deterioration was even more apparent in the 52-week high/low statistics. The exchange recorded 41 new 52-week highs and 67 new 52-week lows, compared with 35 new highs and only 19 new lows on Friday.
New 52-week highs increased approximately 17%, but new lows surged approximately 253%. As a result, the new-high/new-low ratio deteriorated dramatically from approximately 1.84:1 on Friday to 0.61:1 on Tuesday.
This is an important warning sign for traders. While the TSX itself remains above its longer-term trend indicators, the sharp expansion in new lows indicates that internal selling pressure is broadening beneath the headline index.
Sector Rotation Turns Defensive
Only three of the TSX’s ten major sectors finished higher, highlighting the broad risk-off tone.
Utilities led the advancing sectors, gaining 0.72%, followed by Energy, up 0.64%, and Basic Materials, which edged higher by 0.07%.
The downside was considerably more pronounced. Telecommunications Services declined 1.21%, while Financials fell 1.48%. Consumer Discretionary dropped 2.46%, and Technology was the session’s major laggard, plunging 6.46%.
The sector performance suggests a clear shift toward more defensive areas of the market, with Utilities and Energy outperforming while Financials, Consumer Discretionary and Technology absorbed significant selling pressure.
Shopify Leads Technology Selloff
Technology was by far the weakest major sector, with Shopify Inc. (SHOP) accounting for a substantial portion of the sector’s decline.
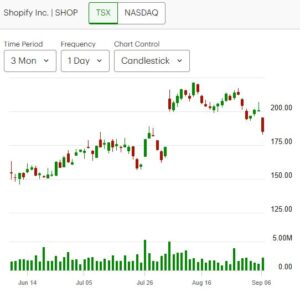
Shopify plunged 7.84% to $185.03, with approximately 2.2 million shares changing hands. Trading volume was above its recent average, adding significance to the price decline. The stock traded as low as $182.60 during the session. For traders, the combination of a large percentage decline and elevated volume is more concerning than an ordinary low-volume pullback. Shopify’s Tuesday decline also adds pressure to an already weakened technology sector and was a significant contributor to the TSX’s overall loss. Reuters identified Shopify’s sharp decline as one of the principal drivers of Tuesday’s TSX selloff.
Financials Under Pressure
The financial sector also had a difficult session, falling 1.48% and adding significant downside pressure because of its large weighting in the TSX.
Five of the six major Canadian banks declined by more than 1%, with National Bank of Canada the weakest of the group, falling 1.51% to $214.62 on approximately 1.4 million shares.
Bank of Montreal (BMO) was the relative outperformer among the major banks, declining 0.53% to $241.48 on approximately 2.6 million shares. Canadian Imperial Bank of Commerce (CM) fell 0.98% to $161.15, also trading approximately 2.6 million shares.
The weakness across the major banks is particularly relevant because financials remain one of the TSX’s most important sectors. Continued weakness in the banks would make it more difficult for the broader index to stabilize if selling pressure persists.
Bombardier Hit by U.S.-Canada Trade Tensions
Bombardier Inc. (BBD.B) was another stock in focus after U.S. President Donald Trump threatened to block the Canadian aircraft manufacturer’s access to the U.S. market unless it manufactures its aircraft in the United States.
The threat comes as trade tensions between Canada and the United States escalate. Canada’s latest retaliatory tariffs on approximately $20 billion of U.S. goods took effect Tuesday, while Washington announced additional restrictions and import bans affecting selected Canadian products.
Bombardier has emphasized its substantial U.S. footprint, including thousands of American employees and a supply chain involving approximately 2,800 U.S. companies across 47 states. The U.S. market accounts for roughly half of Bombardier’s sales, making the threat particularly significant for investors.
For traders, the Bombardier situation represents a headline-driven geopolitical risk that could remain a source of volatility until there is greater clarity on whether the threat translates into actual restrictions.
Cenovus Outperforms: Not all commodity-related stocks participated in the selloff. Cenovus Energy (CVE) gained 2.8% after JPMorgan upgraded the stock to Overweight from Neutral.
The strength in Cenovus, combined with the broader gains in Energy, helped offset some of the weakness elsewhere in the index and reinforces the importance of sector rotation in the current market environment.
Key Takeaways for Traders and Investors
1. 36,000 is the immediate technical pivot.
The TSX remains above 36,000, but Tuesday’s broad-based selling makes this support level increasingly important. A decisive break below 36,000 would weaken the short-term technical structure and could open the door to a deeper correction.
2. Short-term momentum has turned bearish.
The TSX has fallen below its 25-day moving average. Traders should look for either a quick recovery above that level or further confirmation of downside momentum.
3. Longer-term trend remains intact—for now.
The index remains above its 50-day and 200-day moving averages. Consequently, Tuesday’s decline should currently be viewed as a short-term bearish development within a still-positive intermediate trend, rather than confirmation of a major bear-market reversal.
4. Market internals are sending a stronger warning than the index itself.
The 2.31:1 decliner-to-advancer ratio and the sharp surge in new 52-week lows indicate that weakness is spreading across the market. Traders should pay close attention to whether these internal readings improve or deteriorate further over the next several sessions.
5. Technology and Financials need to stabilize.
The simultaneous weakness in two major TSX sectors is a significant headwind. Further deterioration in the major banks or another high-volume decline in Shopify and other technology names could put additional pressure on the index.
6. Watch sector rotation.
The relative strength in Utilities and Energy suggests that investors are becoming more defensive. Continued outperformance by defensive and commodity-linked sectors, combined with weakness in growth and financial stocks, would reinforce the risk-off signal.
7. The trade-war headline risk remains elevated.
The Bombardier episode and the latest Canadian-U.S. tariff escalation introduce another source of volatility for Canadian equities. Traders should expect individual stocks with significant U.S. exposure to remain particularly sensitive to political and trade headlines.
Bottom Line
Tuesday was a materially bearish session for the TSX’s short-term technical picture. The index lost more than 1%, breadth was decisively negative, new 52-week lows surged, and only three of ten major sectors advanced.
The key question now is whether 36,000 holds.
A successful defense of that level, followed by a recovery above the 25-day moving average, would support the view that Tuesday’s selloff was a correction within the broader uptrend. Conversely, a decisive break below 36,000 accompanied by continued deterioration in breadth and an expanding number of new lows would increase the probability of a deeper market correction.
Short-term bias: Bearish
Intermediate-term bias: Bullish, but weakening
Key support: 36,000
Secondary support: 35,722
Key near-term signal: TSX reclaiming its 25-day moving average
Primary internal warning: Expanding new 52-week lows
.
The US Markets
Tuesday’s U.S. Market Indexes
All four major U.S. equity indexes finished lower on Tuesday in a broad risk-off session. The Dow Jones Industrial Average was the biggest laggard, falling 628.00 points, or 1.18%, to 52,786.07. The S&P 500 declined 45.08 points, or 0.58%, to 7,673.52, while the Nasdaq Composite slipped 85.58 points, or 0.32%, to 26,421.41. The Russell 2000 fell 15.44 points, or 0.52%, to 2,960.20.

The magnitude of Tuesday’s declines varied considerably across the major indexes. The NASDAQ was the relative outperformer, losing only 0.32%, compared with a much larger 1.18% decline in the Dow. This performance gap is notable because it suggests that the selling pressure was concentrated more heavily in large, economically sensitive and value-oriented stocks than in the major technology-heavy names.
Rising Bond Yields Remain a Headwind: The continuing rise in longer-term Treasury yields remains one of the most important concerns for equity investors.
Higher long-term yields increase the cost of capital and can pressure equity valuations, particularly when investors are paying elevated multiples for future earnings growth. Rising yields can also make fixed-income investments comparatively more attractive, potentially reducing demand for equities.
For traders, the relationship between Treasury yields and equity indexes is therefore becoming increasingly important. If yields continue to rise while stocks weaken, the combination would provide stronger confirmation of a risk-off environment.
Technical Picture
The technical structure across the four major indexes is becoming increasingly differentiated.
The NASDAQ Composite and S&P 500 remain in relatively strong technical positions, trading above their 25-day, 50-day and 200-day moving averages. Tuesday’s declines therefore appear, at this stage, to be short-term pullbacks within broader bullish trends rather than evidence of a major trend reversal.
The Dow Jones, however, suffered a more significant technical deterioration. The index has now fallen below its 25-day moving average and closed Tuesday just below its 50-day moving average. A sustained move below the 50-day average would represent a more meaningful deterioration in intermediate-term momentum, particularly if accompanied by increasing trading volume.
The Russell 2000 has, after today’s decline, become the weakest technically positioned of the four major indexes. It is trading below both its 25-day and 50-day moving averages while remaining clearly above its 200-day moving average.
This configuration indicates that small-cap stocks are experiencing greater short- and intermediate-term pressure, even though the longer-term trend has not yet broken down.
Russell 2000: A Higher-Risk Technical Setup: The Russell 2000 deserves particular attention because small-cap stocks are generally more sensitive to financing costs and economic conditions.
With the index already below its 25-day and 50-day moving averages, further weakness would increase the risk of a test of its 200-day moving average. A decisive break below the 200-day average would represent a substantially more negative development for the small-cap segment.
For individual stocks, a high-volume break below the 50-day moving average is commonly treated by technical traders as a warning or potential sell signal, particularly when the move is accompanied by deteriorating momentum and weak market breadth. The same principle can be applied conceptually to the Russell 2000, although an index should not be evaluated in exactly the same way as an individual security.
Large-Cap versus Growth Leadership
Tuesday’s performance also provides an interesting read on market leadership.
The Dow’s 1.18% decline was nearly four times the NASDAQ’s 0.32% decline, while the S&P 500 fell 0.58%. This relative-performance gap suggests that investors were not indiscriminately selling equities.
Instead, the market appears to be differentiating between segments, with the large-cap Dow components under considerably greater pressure while technology-heavy NASDAQ stocks showed greater relative resilience.
That relative strength is worth monitoring. If the NASDAQ continues to outperform while maintaining its position above all three major moving averages, it would suggest that the market’s growth leadership remains intact despite the broader risk-off environment.
Conversely, a breakdown in the NASDAQ below its 25-day and 50-day moving averages would represent a much more significant deterioration in the overall U.S. equity market.
Key Takeaways for Traders and Investors
- All four major indexes declined, confirming a broadly negative session, but the magnitude of the declines varied significantly.
- The Dow was the clear laggard, falling 1.18% and breaking below both its 25-day and 50-day moving averages.
- The Nasdaq remains the strongest technically, despite Tuesday’s decline, as it continues to trade above its 25-day, 50-day and 200-day moving averages.
- The S&P 500 also retains a constructive technical structure, remaining above all three major moving averages.
- The Russell 2000 remains technically vulnerable, trading below its 25-day and 50-day averages while still holding above its 200-day average.
- Rising long-term Treasury yields remain a key risk factorfor equities and should be monitored closely alongside the major indexes.
- A high-volume break below the 50-day moving averagewould increase the significance of the technical deterioration in the Dow and Russell 2000.
- The NASDAQ’s relative strength is important. Continued NASDAQ leadership would suggest that the broader equity-market uptrend remains resilient despite weakness in other segments.
Bottom Line
Tuesday’s session was clearly negative, but the technical damage was uneven across the major U.S. indexes.
The Dow and Russell 2000 are flashing the strongest short- and intermediate-term warning signals, while the NASDAQ and S&P 500 remain above their key moving averages. This suggests that the U.S. equity market has entered a period of increased internal differentiation rather than a confirmed broad-market breakdown.
For traders, the next several sessions will be important. Watch Treasury yields, the Dow’s 50-day moving average, the Russell 2000’s ability to defend its 200-day average, and whether the NASDAQ can maintain its relative strength.
We summarize the technical message as follows:
Short-term U.S. market bias: Bearish
S&P 500: Bullish trend, short-term pressure
NASDAQ: Bullish trend, relative-strength leader
Dow: Bearish short-term / weakening intermediate trend
Russell 2000: Highest technical risk among the major indexes
Primary macro risk: Rising long-term Treasury yields
.
Tuesday’s U.S. Market Statistics
New York Stock Exchange (NYSE): Market breadth on the New York Stock Exchange deteriorated noticeably on Tuesday, with 2,832 declining issues versus 1,617 advancing issues. With 540 issues unchanged, the decliner-to-advancer ratio stood at 1.75:1, meaning there were approximately nine decliners for every five advancers.
The breadth reading confirms that Tuesday was a broadly negative session rather than a decline concentrated in a relatively small number of stocks.
The 52-week high/low statistics also weakened. The NYSE recorded 142 new 52-week highs and 216 new 52-week lows, compared with 151 new highs and 167 new lows on Friday.
The number of new highs declined by approximately 6%, while new lows increased by approximately 29%. As a result, the new-high/new-low ratio deteriorated from approximately 0.90:1 on Friday to 0.66:1 on Tuesday. In other words, there were roughly two new 52-week highs for every three new 52-week lows.
This deterioration is more important than the modest decline in the number of new highs by itself. The sharp increase in new lows indicates that selling pressure is becoming more widespread across NYSE-listed stocks.
NYSE Volume: Total NYSE volume reached approximately 5.12 billion shares, up about 21% from Friday’s 4.23 billion shares.
The combination of negative breadth, an expanding number of new lows, and substantially higher volume deserves attention. However, the volume increase by itself does not indicate panic selling. A 21% increase in volume is significant, but a panic-type session would normally be accompanied by considerably more extreme price deterioration and/or additional evidence of forced liquidation.
For traders, the more important message is that participation increased while the majority of stocks moved lower. That makes Tuesday’s weakness more meaningful than a low-volume decline.
NYSE Internal Assessment: The NYSE internals are weakening, but they have not yet reached a level that would by itself justify a major increase in trading risk.
The combination of a 1.75:1 decliner-to-advancer ratio and a new-high/new-low ratio below 1.0 indicates a clear deterioration in market participation. Nevertheless, one session of weak breadth is insufficient to establish a sustained bearish trend.
Traders should therefore monitor whether Tuesday’s deterioration continues over the next several sessions. Persistent negative breadth, particularly if accompanied by further expansion in new 52-week lows, would be a stronger warning signal.
At present, market internals should be treated as a risk-management consideration rather than the primary reason to stop trading or dramatically reduce exposure.
NASDAQ: NASDAQ market breadth was also decidedly negative on Tuesday. There were 3,149 declining issues versus 1,762 advancing issues, with 396 issues unchanged. This produced a decliner-to-advancer ratio of 1.78:1, or approximately nine decliners for every five advancers.
Therefore, contrary to what might initially appear from the index’s relatively small 0.32% decline, the underlying NASDAQ market was considerably weaker than the index itself suggested.
The 52-week statistics reinforced that message. NASDAQ recorded 83 new 52-week highs and 194 new 52-week lows, compared with 80 new highs and 145 new lows on the previous session.
New highs increased approximately 4%, while new lows increased approximately 34%. Consequently, the new-high/new-low ratio deteriorated to approximately 0.43:1, or roughly four new highs for every nine new lows.
This is a distinctly weak internal reading.
The fact that the Nasdaq Composite declined only 0.32% while nearly twice as many stocks declined as advanced suggests that the index’s relatively modest loss does not fully reflect the weakness underneath the surface. Stronger performance from some of the large technology and mega-cap components helped cushion the headline index.
NASDAQ Volume: NASDAQ trading volume reached approximately 7.94 billion shares, an increase of about 18% from Friday’s 6.71 billion shares.
The increase in volume is significant, particularly because the Nasdaq Composite declined on the session. However, the combination does not appear to represent panic selling.
Instead, the higher volume may indicate increased portfolio repositioning, profit-taking and risk reduction as investors responded to the recent market volatility. Some investors may also have been willing to lock in gains rather than risk seeing recent profits erode further.
Status of the Market Internals: Tuesday’s statistics present a somewhat more cautious picture than the headline index performance.
The Dow declined 1.18%, the S&P 500 fell 0.58%, and the Nasdaq slipped only 0.32%, giving the impression that the Nasdaq was relatively resilient. However, the underlying breadth tells a different story.
Both the NYSE and NASDAQ produced decliner-to-advancer ratios close to 1.8:1, while both exchanges recorded substantially more new 52-week lows than new highs.
This creates an important distinction for investors and especially traders: Index performance remained relatively orderly, but internal participation was weak.
That does not necessarily mean that a major market breakdown is underway. It does mean that traders should be more selective with new positions and more disciplined with position sizing.
Key Takeaways for Traders and Investors
- Breadth was clearly negative on both exchanges. Approximately 1.75–1.78 stocks declined for every advancing stock.
- New 52-week lows exceeded new highs on both exchanges, providing another indication that market weakness is broadening.
- NASDAQ’s internal weakness was particularly notable. The index declined only 0.32%, yet there were 3,149 decliners versus only 1,762 advancers.
- Volume increased substantially on both exchanges, rising approximately 21% on the NYSE and 18% on NASDAQ.
- Higher volume does not automatically mean panic selling. Tuesday’s data are more consistent with increased repositioning and profit-taking than outright capitulation.
- The deterioration in new highs versus new lows deserves close monitoring. Continued expansion in new lows would be a more serious warning than Tuesday’s single-session reading.
- Market internals should influence position sizing and trade frequency. Weak breadth argues for greater selectivity rather than necessarily abandoning the market.
- Geopolitical risk remains an important source of short-term volatility. With tensions in the Middle East contributing to uncertainty, traders should be careful about interpreting one day’s technical or breadth data in isolation.
Bottom Line
Tuesday’s market statistics were weaker than the headline index performance suggested.
Both the NYSE and NASDAQ showed approximately 1.8 decliners for every advancer, while new 52-week lows substantially outnumbered new highs. At the same time, trading volume increased by roughly 18–21%.
The data therefore point to deteriorating market internals, but not yet to panic or a confirmed broad-market breakdown.
For traders and investors, the appropriate response is increased vigilance rather than an immediate change to a highly defensive posture. Position sizing, trade frequency and stock selection should become more disciplined while investors watch for confirmation over the next several sessions.
The key question is whether Tuesday’s weak internals prove to be a one-session deterioration or the beginning of a persistent trend. A continued rise in new 52-week lows, sustained negative breadth and heavy volume on declining sessions would materially increase the risk level.
NYSE breadth: Bearish
NASDAQ breadth: Bearish
NYSE decliner/advancer ratio: 1.75:1
NASDAQ decliner/advancer ratio: 1.78:1
NYSE new-high/new-low ratio: 0.66:1
NASDAQ new-high/new-low ratio: 0.43:1
Volume: Significantly higher
Overall internal condition: Weakening, but not yet indicative of panic
.
Tuesday’s U.S. Market Wrap-Up Report
U.S. equities retreated on Tuesday as rising Treasury yields, higher crude-oil prices and escalating geopolitical tensions combined to pressure risk assets. All four major indexes finished lower, although the declines remained relatively orderly rather than disorderly.
The Dow Jones Industrial Average was the weakest major index, falling 628 points, or 1.18%, to 52,786.07. The S&P 500 declined 0.58% to 7,673.52, while the Nasdaq Composite slipped only 0.32% to 26,421.41. The Russell 2000 fell 0.52% to 2,960.20.
The performance gap between the Dow and Nasdaq was particularly notable. The Dow lost nearly four times as much as the Nasdaq on a percentage basis, indicating that Tuesday’s selling pressure was concentrated more heavily in large, economically sensitive stocks than in the technology-heavy Nasdaq.
Rising Yields and Oil Prices Pressure Equities
The bond market remained one of the most important sources of pressure on equities. The 10-year U.S. Treasury yield increased by three basis points, reinforcing investor concerns that the cost of capital is moving higher.
At the same time, crude oil prices continued to climb. West Texas Intermediate crude rose approximately 2.2% to $93.52 a barrel, while Brent crude gained about 1.6% to $98.59 a barrel.
Brent’s approach toward the psychologically important $100-a-barrel level is becoming an increasingly important market variable.
Higher energy prices create a difficult environment for the Federal Reserve. A sustained increase in crude prices could feed into headline inflation and make it more difficult for policymakers to bring inflation sustainably toward the Fed’s 2% objective. For equity investors, the combination of higher oil prices and higher Treasury yields is particularly uncomfortable because both can pressure valuations while increasing the cost of financing.
The market is therefore dealing with two related risks: higher inflation expectations and higher borrowing costs.
Geopolitical Risk Adds Another Layer of Volatility
Geopolitical developments in the Middle East remain an additional source of uncertainty.
Reports of U.S. military action involving Iranian oil tankers, along with attacks and counterattacks in the region, have raised concerns about potential disruptions to energy infrastructure and oil supplies. Reports of attacks affecting civilian and economic sites in Saudi Arabia and temporary operational disruptions at energy facilities have further heightened those concerns.
For traders, geopolitical headlines should be treated as a significant event-risk variable. Oil prices can react rapidly to developments affecting production, transportation routes or energy infrastructure, and those moves can quickly feed into equity markets.
The important issue is not simply today’s oil price. The persistence and direction of the oil move will matter more. A sustained move toward or above $100 Brent would likely receive considerably more attention from equity investors than a brief headline-driven spike.
Market Internals Confirm Broad Selling Pressure
The relatively modest declines in the S&P 500 and Nasdaq should not obscure the weakness underneath the surface.
NYSE breadth was clearly negative, with 2,832 decliners versus 1,617 advancers, producing a 1.75:1 decliner-to-advancer ratio. The exchange also recorded 142 new 52-week highs versus 216 new lows.
NASDAQ breadth was similarly weak, with 3,149 decliners versus 1,762 advancers, a 1.78:1 ratio. NASDAQ recorded 83 new 52-week highs and 194 new 52-week lows.
The combination of negative breadth and substantially more new lows than new highs indicates that market participation weakened considerably even though the major indexes did not experience a major breakdown.
Trading volume also increased significantly. NYSE volume rose approximately 21%, while NASDAQ volume increased approximately 18% from Friday.
Higher volume accompanying a down session deserves attention, but Tuesday’s activity does not by itself indicate panic selling. The more important signal for traders will be whether heavy volume, negative breadth and expanding new lows persist over multiple sessions.
Technical Picture Remains Mixed: Tuesday’s market action produced a widening technical divergence among the major indexes.
The Nasdaq Composite and S&P 500 remain above their 25-day, 50-day and 200-day moving averages, keeping their intermediate- and longer-term bullish structures intact despite Tuesday’s decline.
The Dow Jones, however, suffered greater technical damage. The index is now below its 25-day moving average and closed just below its 50-day moving average. A sustained move below the 50-day average would represent a more significant deterioration in intermediate-term momentum.
The Russell 2000 remains below its 25-day and 50-day moving averages, although it continues to trade clearly above its 200-day moving average. Small-cap stocks therefore remain technically more vulnerable to rising financing costs and deteriorating economic expectations.
For traders, the message is clear: the U.S. market has not entered a confirmed broad technical breakdown, but several important warning signals are developing beneath the surface.
Semiconductor Stocks Show Significant Rotation
The semiconductor group produced some of the most interesting individual-stock moves of the session.
Intel (INTC) surged 9.1% to $104.47, with approximately 140.2 million shares traded. Reports citing supply-chain sources indicated that Intel may raise PC CPU prices by another 10% in early October.
The size of Intel’s move and exceptionally heavy volume make the stock one of the day’s most important semiconductor names to monitor. Traders should distinguish between a strong individual-stock move and broader sector strength, however, because several major semiconductor names declined despite Intel’s rally.
Advanced Micro Devices (AMD) gained 5.9% to $505.74 on approximately 28.2 million shares. AMD has now advanced for two consecutive sessions but remains approximately 13.5% below its 52-week high of $584.73, reached June 30.
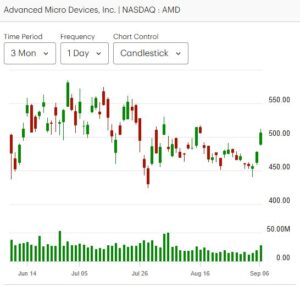
The semiconductor group was therefore mixed rather than uniformly bullish.
Nvidia (NVDA) declined 2.0% to $225.73 on approximately 122.9 million shares, while Micron Technology (MU) fell 1.61% to $1,000.25 on approximately 26.6 million shares. Astera Labs (ALAB) was considerably weaker, falling 6.94% to $288.85 on approximately 5.7 million shares.
The divergence within semiconductors is noteworthy. While Intel and AMD attracted strong buying interest, weakness in Nvidia, Micron and Astera Labs indicates that investors were not indiscriminately buying semiconductor stocks.
Optoelectronics Remain a Pocket of Strength
Optoelectronic stocks provided another area of relative strength.
Corning (GLW) advanced 7.56% to $165.96, with approximately 13.8 million shares traded. Lumentum (LITE) surged 11.04% to $978.54 on approximately 7.4 million shares, while Coherent (COHR) gained 7.10% with approximately 8.7 million shares changing hands.
The strength in these names stands out against the broader market decline and suggests that there was still considerable appetite for selected technology and communications-infrastructure stocks.
For traders, this is an important reminder that a risk-off index session does not mean every growth or technology stock is being sold. Relative strength remains an important tool for identifying where institutional buying may still be occurring.
Key Takeaways for Traders and Investors
- The headline indexes were weak, but the decline remained orderly. There was no evidence of broad panic or capitulation.
- The Dow was the weakest major index, while the Nasdaq showed significant relative strength.
- Market breadth was considerably weaker than the headline index performance suggested, with roughly 1.8 decliners for every advancer on both NYSE and NASDAQ.
- New 52-week lows substantially exceeded new highs, signaling deterioration beneath the index level.
- Higher Treasury yields remain a major risk factor, particularly if they continue rising alongside crude oil.
- Brent approaching $100 is an important macro risk. A sustained move above that level could increase inflation concerns and place additional pressure on equity valuations.
- The Nasdaq and S&P 500 remain technically constructive, trading above their major moving averages.
- The Dow and Russell 2000 are technically more vulnerable, particularly if they fail to reclaim their 50-day moving averages.
- Technology leadership remains selective rather than broad-based. Intel, AMD and several optoelectronic stocks showed strong relative strength, while Nvidia, Micron and Astera Labs declined.
- Higher trading volume deserves monitoring, but does not yet indicate panic. The key is whether elevated volume accompanies continued deterioration in breadth and new lows.
Bottom Line
Tuesday’s session delivered a cautionary rather than catastrophic signal for U.S. equities.
The major indexes declined, market breadth was weak, new 52-week lows expanded relative to new highs, and trading volume increased materially. At the same time, the S&P 500 and Nasdaq remain above their major moving averages, and several technology and optoelectronic stocks continued to attract strong buying interest.
The biggest near-term risks are now increasingly interconnected: rising Treasury yields, crude oil approaching $100, geopolitical escalation and weakening market internals.
For traders, the priority should be selectivity and risk control rather than abandoning the market. Stocks demonstrating strong relative strength should receive greater attention, while positions showing deteriorating price action, weak relative strength or high-volume breaks of key moving averages warrant closer scrutiny.
The next few sessions will be particularly important. If yields and oil continue higher while breadth deteriorates further, the probability of a deeper equity-market correction will increase. Conversely, stabilization in yields and oil, combined with improving breadth, would provide an important signal that Tuesday’s weakness was primarily a short-term risk-off adjustment rather than the beginning of a broader trend reversal.
Short-term U.S. market bias: Bearish
S&P 500: Bullish trend, short-term pressure
Nasdaq: Relative-strength leader
Dow: Technically weakened
Russell 2000: Higher-risk technical structure
Market internals: Weakening
Primary macro risks: Treasury yields, crude oil and geopolitical tensions
.
NOTICE TO READERS
The Canadian Vanguard Stock Market is about empowering you to build and manage your wealth by yourself. There is certainly no magic in managing finances or wealth but one needs to know what to do and commit to doing what is needed. When you are ready to start the journey to Take Charge and Put Your Destiny In Your Own Hands, start with reading The Canadian Vanguard every market day. If and when you need more related information or to advertise your business products or services in The Canadian Vanguard, Contact Us
Our readers are strongly advised to conduct their own research into individual stocks before making a purchase decision. In addition, investors are advised that past stock performance is no guarantee of future price appreciation. Any recommendation is not a guarantee of any particular stock’s future prices, and The Canadian Vanguard accepts no responsibility or liability for investors’ or readers’ purchases.
Stocks In The News/ Stocks To Watch and Market Strategy will soon be available only to Paying Subscribers. The dollar sign “$” in the Toronto Market section in the articles only stands for Canadian dollar and in the US market section “$” stands for US dollar.
(c) This article is published by The Canadian Vanguard on September 8, 2026