



Major Market Indexes Defy Rising Treasury Yields as In-Line Inflation Data Fuels Rebound
The Canadian Vanguard Stock Market Report Weekend, September 11 – 13, 2026, Edition
.
The Toronto Market
Friday Toronto Market Index
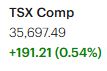
The S&P/TSX Composite Index rebounded on Friday, gaining 191.21 points, or 0.54%, to close at 35,697.49. The advance snapped a four-session losing streak and provided some relief following the market’s recent weakness. Despite Friday’s recovery, however, the TSX remains below the psychologically important 36,000 level, which continues to represent a key near-term threshold for investors.
Friday’s positive close should be viewed in the context of the broader weekly decline. Rising government bond yields and continued strength in the U.S. 10-year Treasury yield are keeping upward pressure on borrowing costs and remain an important headwind for equity valuations. At the same time, heightened geopolitical tensions in the Middle East have added another layer of uncertainty and contributed to the risk-off tone that dominated trading earlier in the week.
Market breadth improved on Friday, with advancing issues outnumbering decliners. This was a constructive development and suggests that the session’s gain was relatively broad-based rather than concentrated in a small number of large-cap stocks.
From a technical perspective, however, the overall picture remains cautious. The TSX’s decline earlier in the week was significant enough that Friday’s rebound did little to repair the near-term trend. The index remains well below both its 25-day and 50-day moving averages, indicating that short- and intermediate-term momentum remains under pressure.
The longer-term technical picture is more encouraging. The TSX continues to hold a meaningful cushion above its 200-day moving average, keeping the primary long-term trend intact, at least for now. Traders will likely be watching closely to see whether the index can regain the 36,000 level and begin rebuilding momentum, or whether renewed selling pressure pushes the market toward its longer-term support levels.
For investors, Friday’s rebound is encouraging but does not yet constitute a clear trend reversal. For traders, the combination of improving breadth, the 36,000 resistance area, and the position of the index relative to its major moving averages should provide important signals for the next phase of the market.
Friday’s TSX Market Statistics
Market breadth was decisively positive on Friday, with advancing issues substantially outnumbering declining issues. There were 1,474 advancers and 676 decliners, producing an advancer-to-decliner ratio of approximately 2.18 to 1—or roughly two advancing stocks for every declining stock. Another 145 issues closed unchanged.
Despite the strong breadth, the new-high/new-low statistics remained a concern. The TSX recorded 22 new 52-week highs and 121 new 52-week lows, compared with 36 new highs and 242 new lows on Thursday. While both new highs and new lows declined from the previous session, the imbalance continued to favor new lows by a wide margin.
The number of new 52-week highs fell approximately 39%, while new 52-week lows declined by roughly 50%. As a result, the high-to-low ratio improved only marginally, from approximately 7:50 on Thursday to 9:50 on Friday. In other words, for every 9 stocks reaching a new 52-week high, approximately 50 were making new 52-week lows. This remains a weak reading and suggests that, despite Friday’s broad market advance, investors were still showing limited willingness to bid aggressively for stocks at or near their yearly highs.
The combination of strong daily breadth and a persistently weak new-high/new-low ratio presents a mixed picture. Friday’s advance was broad-based, which is encouraging for short-term market sentiment, but the lack of new 52-week highs indicates that the underlying market remains under pressure. Nevertheless, the improvement in the internals from Thursday is a modestly positive development.
Trading volume was 369,593,467 shares, compared with 462,858,104 shares on Thursday. Friday’s volume was therefore approximately 20% lower than the previous session. The lower volume accompanied the TSX’s rebound and suggests that Friday’s recovery did not attract the same level of participation seen during Thursday’s trading session.
Overall, Friday’s market statistics were constructive but not decisively bullish. Strong advancing breadth was the principal positive signal, while the large disparity between new 52-week lows and new highs remained the major technical concern. For traders and investors, the key question is whether the improvement in breadth can persist and eventually translate into a meaningful expansion in new highs.
Friday’s Toronto TSX Market Wrap-Up Report
The S&P/TSX Composite Index rebounded on Friday, ending a four-session losing streak and bringing some relief after a difficult week for Canadian equities. Despite Friday’s gain, the TSX still finished the week significantly lower, with all ten major sectors ending the week in negative territory.
The market’s weakness throughout the week was driven largely by rising oil prices, higher government bond yields, and increasing geopolitical uncertainty. On Friday, however, the TSX managed to recover despite continued strength in Treasury yields. A modest pullback in crude oil prices also helped ease some of the pressure on equities.
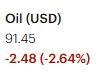
West Texas Intermediate (WTI) and Brent crude both declined on Friday as reports of possible diplomatic efforts to reduce tensions around the Strait of Hormuz eased concerns about immediate supply disruptions. The retreat in crude prices followed Thursday’s sharp rally and provided some relief to the broader market, particularly after energy-related gains had been an important factor influencing trading earlier in the week.
Sector Performance
Five of the TSX’s ten major sectors advanced on Friday, led by Technology, which gained 2.20%. The sector’s strong performance was an important contributor to the index’s rebound.
Energy and retail-related stocks were among Friday’s weaker areas. However, there were no major sector declines. Utilities, the weakest-performing sector, fell only 0.74%, illustrating that Friday’s selling pressure was relatively contained.
The Financials sector also remained closely watched. Among Canada’s Big Six banks, Bank of Nova Scotia (BNS), Toronto-Dominion Bank (TD), and Bank of Montreal (BMO) were the three strongest performers on Friday.
BNS gained 0.95% to close at $129.63, with approximately 3.0 million shares traded. TD advanced 0.85% to $167.72, also with approximately 3.0 million shares traded, while BMO gained 0.81% to close at $242.47, on approximately 1.5 million shares.
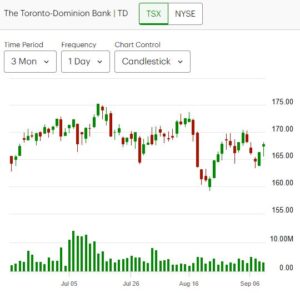
TD’s Friday volume was notably below its 50-day average of approximately 5.1 million shares, suggesting that the stock’s advance was achieved without particularly strong participation.
Canadian Bank Initiatives
In company news, Bank of Montreal announced plans to mobilize up to C$70 billion over the next decade to support critical sectors of the Canadian economy, including electricity, energy, transportation infrastructure, defense, mining, and artificial intelligence.
Canadian Imperial bank of Commerce also announced a significant initiative, committing C$2 billion to support financing for small and medium-sized defense-related and dual-use businesses across Canada.
These initiatives highlight the increasing importance of infrastructure, defense, energy, mining, and technology investment themes within the Canadian economy and could create longer-term opportunities for companies exposed to these areas.
Market Internals and Technical Picture
Friday’s market internals improved considerably from the previous session. Advancing issues outnumbered declining issues by approximately 2.18 to 1, providing evidence that Friday’s rebound was broad-based rather than driven solely by a handful of large-cap stocks.
However, the new-high/new-low data remained considerably less encouraging. The TSX recorded only 22 new 52-week highs compared with 121 new 52-week lows. Although both figures improved from Thursday, the large imbalance continued to indicate underlying weakness beneath the surface.
The TSX also remains below its 25-day and 50-day moving averages, confirming that short- and intermediate-term momentum remains under pressure. The more encouraging aspect of the technical picture is that the index continues to hold a meaningful distance above its 200-day moving average, leaving the longer-term trend intact for now.
Friday’s lower trading volume also deserves attention. Approximately 369.6 million shares changed hands, down about 20% from Thursday’s 462.9 million shares. A rebound accompanied by lighter volume can be viewed as less convincing than a recovery supported by expanding participation.
Key Takeaway for Traders and Investors
Friday’s advance was encouraging, but it should not yet be interpreted as confirmation of a market reversal.
The strongest positive signal was the broad improvement in market breadth, with more than two stocks advancing for every stock that declined. The improvement in the new-high/new-low statistics was another modestly positive development.
However, the TSX remains below its key short- and intermediate-term moving averages, and new 52-week lows continue to dramatically outnumber new highs. The lighter trading volume on Friday also suggests that conviction behind the rebound was not particularly strong.
For traders, caution remains warranted. The 36,000 level is an important psychological threshold, while the 25-day and 50-day moving averages represent significant technical hurdles that the index must reclaim before the short-term outlook becomes more constructive. Traders should also watch whether improving breadth continues over the next several sessions.
For longer-term investors, the fact that the TSX remains above its 200-day moving average is an important positive. Nevertheless, the market’s internal weakness argues for patience and disciplined risk management rather than aggressive positioning.
Bottom line: Friday produced a welcome rebound after four consecutive losing sessions, but one positive session does not erase a difficult week. The market needs to demonstrate sustained improvement in breadth, expanding new highs, stronger volume, and a recovery above key moving averages before the recent weakness can be considered decisively over. Until then, preserving capital, controlling position size, and adhering to trading and risk-management rules remain particularly important.
.
The US Markets
Friday’s U.S. Market Indexes
All four major U.S. equity indexes rebounded on Friday, ending a four-session losing streak and providing some relief after a difficult week for U.S. stocks.
The Dow Jones Industrial Average advanced 509.19 points, or 0.98%, to close at 52,573.29. The S&P 500 gained 65.28 points, or 0.86%, finishing at 7,656.98, while the Nasdaq Composite rallied 251.31 points, or 0.96%, to close at 26,333.04. The Russell 2000 also recovered, gaining 13.00 points, or 0.45%, to finish at 2,903.94.
Friday’s session was clearly positive, but the recovery was not particularly broad-based. Only five of the major sectors advanced, suggesting that the gains were concentrated rather than the result of a broad improvement across the equity market.

Bond Yields Remain a Major Headwind
One of the most important issues facing the market remains the continued rise in long-term interest rates. The U.S. 10-year Treasury yield increased another 3 basis points on Friday to 4.97%, ending the week substantially higher than its 4.78% close one week earlier.
That increase in borrowing costs remains an important headwind for equities. Higher Treasury yields raise the cost of capital, put pressure on equity valuations, and can make fixed-income investments increasingly attractive relative to stocks.
The rise in long-term yields is particularly important for growth-oriented and smaller companies, where higher financing costs can have a more pronounced impact on earnings expectations and future expansion plans.
Small-Cap Stocks Get Some Relief
Small-cap stocks received a modest reprieve on Friday, with the Russell 2000 gaining 0.45%. However, the move was relatively small compared with the gains in the Dow, S&P 500, and Nasdaq.
The technical position of the Russell 2000 remains a concern. The index is still below both its 25-day and 50-day moving averages, although it remains comfortably above its 200-day moving average.
For traders, the position of the Russell 2000 is particularly important because small-cap stocks tend to be more sensitive to financing costs and changes in economic expectations. A sustained move below the 50-day moving average—particularly if accompanied by heavy volume—would generally represent a warning signal and could indicate further deterioration in short- to intermediate-term momentum.
Technical Picture Remains Cautious
The major U.S. indexes continue to show signs of technical weakness despite Friday’s rebound.
The Nasdaq Composite and S&P 500 are now below both their 25-day and 50-day moving averages, which is a negative development for short- and intermediate-term momentum. The Dow Jones is also below its 25-day moving average and closed just below its 50-day moving average earlier in the week.
The Russell 2000 remains in a similar position, trading below its 25-day and 50-day moving averages while maintaining a meaningful distance above its 200-day moving average.
This creates a mixed technical picture: the longer-term trend has not yet been decisively broken, but short- and intermediate-term momentum has weakened considerably.
Key Takeaway for Traders and Investors
Friday’s rebound was encouraging, but it should be treated as a recovery within a weakened short-term market structure rather than confirmation of a new uptrend.
The biggest concerns remain elevated Treasury yields, higher borrowing costs, and the indexes’ positions below their key short- and intermediate-term moving averages. The relatively narrow sector participation also suggests that Friday’s advance lacked the breadth normally associated with a powerful market reversal.
For traders, the next several sessions will be important. A sustained recovery above the 25-day and 50-day moving averages, accompanied by stronger market breadth and increasing volume, would provide considerably more evidence that the recent selling pressure is easing.
For investors, the fact that the major indexes remain above their 200-day moving averages is an important stabilizing factor. However, the current combination of elevated bond yields, weaker technical momentum, and limited market breadth argues for discipline, selective positioning, and careful risk management.
Bottom line: Friday was a positive session, but the market still has significant technical and macroeconomic obstacles to overcome. Traders should avoid mistaking a single-session rebound for a confirmed reversal and should continue to let price action, breadth, volume, and moving averages guide risk decisions.
Friday’s U.S. Market Statistics
New York Stock Exchange (NYSE): Market breadth on the New York Stock Exchange was positive on Friday, with advancing issues substantially outnumbering declining issues. There were 2,732 advancers, 1,718 decliners, and 459 issues unchanged, producing an advancer-to-decliner ratio of approximately 1.60 to 1—roughly three advancing stocks for every two declining stocks.
Although Friday’s breadth was stronger than during several of the earlier sessions this week, the broader market internals remain a concern. The NYSE recorded 90 new 52-week highs and 395 new 52-week lows, compared with 101 new highs and 674 new lows on Thursday.
Both new highs and new lows declined from Thursday, but the imbalance remained heavily tilted toward new lows. Friday produced approximately 23 new highs for every 100 new lows, a ratio that continues to reflect considerable underlying weakness.
The deterioration in market internals has been particularly evident in the new-high/new-low relationship. The number of new 52-week highs declined approximately 11% from Thursday and was already down about 20% from Tuesday. While the number of new lows improved from Thursday’s unusually high level, the number of stocks making new lows remains substantially elevated compared with earlier in the week.
This distinction is important: Friday’s positive breadth does not yet indicate that the deterioration in market internals has been reversed. The market will likely require a sustained series of sessions with positive breadth, together with a meaningful improvement in the new-high/new-low ratio, before the internal damage from the recent selling can be considered repaired.
NYSE trading volume totaled approximately 4.83 billion shares, about 5% below Thursday’s 5.06 billion shares. The lower volume accompanied Friday’s market advance, suggesting that participation did not expand significantly during the rebound.
Nasdaq: Market breadth was also positive on the Nasdaq on Friday. There were 2,852 advancing issues and 1,977 declining issues, with 450 issues unchanged. This produced an advancer-to-decliner ratio of approximately 1.44 to 1, or roughly three advancers for every two decliners.
The positive breadth was a welcome change following four consecutive sessions of negative breadth. However, the new-high/new-low data continues to paint a much weaker picture.
The Nasdaq recorded 72 new 52-week highs and 327 new 52-week lows, compared with 59 new highs and 432 new lows on Thursday. The number of new highs increased modestly, while new lows declined by approximately 24% from Thursday.
Despite this improvement, the imbalance remains significant. Friday produced only about 22 new 52-week highs for every 100 new 52-week lows, indicating that stocks making new lows continued to dramatically outnumber those reaching new highs.
Therefore, while daily breadth was positive, the Nasdaq’s underlying internals remain considerably weaker than they were earlier in the week. A few positive breadth sessions will be needed before there is convincing evidence that the internal deterioration has been reversed.
Nasdaq trading volume reached approximately 6.79 billion shares, about 10% below Thursday’s 7.50 billion shares. The Nasdaq advanced despite the decline in volume. The 10% reduction is worth monitoring, although it is not, by itself, large enough to invalidate Friday’s rebound. A stronger recovery would be more convincing if accompanied by expanding volume and improving breadth.
Market Internals: What Traders Should Watch
Friday delivered an important improvement in daily market breadth on both the NYSE and Nasdaq. This is a positive development following several sessions of widespread weakness.
However, the new-high/new-low statistics remain the more important warning signal. New 52-week lows continue to substantially outnumber new highs on both exchanges, indicating that the underlying market remains fragile despite Friday’s index gains.
For traders and investors, this is a situation where the headline indexes can look considerably healthier than the market beneath the surface. The recent deterioration in market internals has not been repaired in a single session.
The next several trading sessions will therefore be important. A sustained period of positive breadth, an expanding number of new 52-week highs, a continued reduction in new lows, and stronger trading volume would provide increasingly convincing evidence of an improvement in market conditions.
Until those signals emerge, traders should remain disciplined with position sizing, trade frequency, and risk exposure. In a market where the major indexes have already fallen below important short- and intermediate-term moving averages, protecting capital should remain a priority.
Bottom line: Friday’s market breadth was encouraging, but the underlying internals remain weak. The rebound needs follow-through. Traders should look for several consecutive sessions of improving breadth and new-high/new-low statistics before concluding that the market’s recent deterioration has been decisively reversed.
Friday’s U.S. Market Wrap-Up Report
The major U.S. equity indexes rebounded sharply on Friday, breaking a four-session losing streak and providing some relief after a difficult week for the market. The Dow Jones Industrial Average gained 0.98%, the S&P 500 advanced 0.86%, the Nasdaq Composite rallied 0.96%, and the Russell 2000 gained 0.45%.
The market also appeared to look past a higher-than-desired inflation reading released Friday. While the inflation data remained elevated, investors focused instead on the broader market recovery and the improvement in sector participation.
The change in sector breadth was particularly notable. Only two of the eleven major sectors advanced on Thursday, while nine of the eleven sectors gained on Friday. That represents a significant improvement in participation and was one of the more encouraging aspects of Friday’s session.
Telecommunications Services, Industrials, and Technology led the market, gaining 1.51%, 1.43%, and 1.14%, respectively. Energy was essentially flat, gaining only 0.05%, while Healthcare was the weakest sector, slipping 0.10%.
Despite the broad improvement in sector performance, investors should not overlook the market’s underlying technical weakness. The S&P 500 and Nasdaq remain below their 25-day and 50-day moving averages, while the Dow is below its 25-day moving average and remains close to its 50-day average. The Russell 2000 is also below its 25-day and 50-day moving averages, although it continues to hold well above its 200-day moving average.
Friday’s market internals were better, but they did not yet confirm a reversal. Breadth was positive on both the NYSE and Nasdaq, yet new 52-week lows continued to dramatically outnumber new highs. This is an important warning for traders: the indexes recovered, but the underlying market still has some repair work to do.
Stocks to Watch
Oracle Corporation (ORCL) remains a stock worth monitoring following its earnings report. Oracle initially opened significantly higher on Friday after reporting earnings Thursday evening, but the early strength quickly faded. The stock moved below its previous close within approximately 30 minutes of the opening bell and remained below that level for the rest of the session.
Selling pressure increased during the final half hour, although the stock did not experience a major breakdown. Oracle finished down 1.82% at $150.15, with approximately 80.4 million shares traded.
The price action is worth watching because the inability to hold the post-earnings gap higher could indicate that sellers remain active. At the same time, the stock avoided a much deeper decline, leaving open the possibility of stabilization. Traders should watch Oracle’s next few sessions for evidence of whether Friday represented normal post-earnings profit-taking or the beginning of a more significant technical deterioration.
Palantir Technologies (PLTR) is another stock that deserves a place on the watchlist. Investor interest in the company’s artificial-intelligence capabilities remains strong, and Nvidia has highlighted Palantir’s supply-chain intelligence technology.
From a technical perspective, however, PLTR has slipped below its 25-day moving average while remaining well above its 50-day and 250-day moving averages. That combination makes the stock interesting for a medium-term watch rather than an immediate buy signal. Traders should look for stabilization and renewed price strength before interpreting the recent decline as an opportunity.
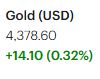
Gold and Gold-Mining Stocks: Gold and gold-mining stocks also deserve continued attention as the precious-metal market remains strong.
Gold producers can provide significant operating leverage to rising gold prices because mine production cannot generally be increased quickly when prices rise. Developing new mines or significantly expanding existing operations requires substantial capital, time, permitting, and infrastructure. As a result, a sustained increase in the price of gold can have a disproportionately positive effect on the profitability and cash flow of efficient producers, particularly those operating high-quality deposits.
Among the gold-related stocks worth monitoring are Agnico Eagle Mines (AEM), Franco-Nevada (FNV), AngloGold Ashanti (AU), and First Mining Gold (FFMGF).
However, traders should distinguish between a strong long-term fundamental theme and a short-term trading opportunity. Even in a favorable gold environment, mining stocks can experience sharp pullbacks following extended advances. Profit-taking, changes in gold prices, movements in interest rates, and broader market risk appetite can all produce significant short-term volatility.
The current strength in gold therefore makes selected gold miners worthy of a watchlist, but traders should wait for appropriate technical setups rather than chase extended moves.
Semiconductor Stocks: Semiconductor stocks delivered a mixed performance on Friday, reinforcing the importance of being selective within the sector.
Sandisk (SNDK) declined 3.50%, while Micron Technology (MU) slipped 0.22%, closing at $975.26 on approximately 21.7 million shares traded. In contrast, Intel (INTC) gained 2.61%, closing at $102.94 on approximately 87 million shares. Tower Semiconductor (TSEM) also advanced 1.66%, finishing at $211.52 on approximately 1.1 million shares.
The divergence among semiconductor stocks suggests that traders should focus on individual technical setups rather than treating the entire semiconductor group as a single trade.
Intel is particularly interesting from a trading perspective. The stock has experienced considerable volatility, but Friday’s advance and the recent price action suggest that the stock may be attempting to stabilize. A sustained move higher accompanied by strong volume would provide a more convincing signal than a single positive session.
Key Takeaway for Traders and Investors
Friday delivered several encouraging developments: all four major indexes advanced, nine of eleven sectors gained, and daily market breadth improved substantially. After four consecutive sessions of declines, the rebound was clearly welcome.
However, the market has not yet provided enough evidence to conclude that the recent correction is over. The S&P 500 and Nasdaq remain below their 25-day and 50-day moving averages, and the new-high/new-low statistics on both the NYSE and Nasdaq remain weak. In addition, the 10-year Treasury yield ended the week at a historically elevated 4.97%, compared with 4.78% a week earlier, keeping financial conditions relatively restrictive.
For traders, the most important question now is whether Friday’s improvement will have follow-through. Several consecutive sessions of positive breadth, improving new-high/new-low ratios, stronger volume, and a recovery above key moving averages would substantially strengthen the bullish case.
For investors, the market’s longer-term trend has not yet been decisively broken because the major indexes remain above their 200-day moving averages. Nevertheless, the current environment favors selectivity and disciplined risk management rather than aggressive exposure.
Bottom line: Friday was a constructive rebound, but it is still only one session. Traders should watch the follow-through closely. The market needs to demonstrate that Friday was the beginning of a sustained recovery—not simply a temporary bounce following four consecutive sessions of selling.
.
NOTICE TO READERS
The Canadian Vanguard Stock Market is about empowering you to build and manage your wealth by yourself. There is certainly no magic in managing finances or wealth but one needs to know what to do and commit to doing what is needed. When you are ready to start the journey to Take Charge and Put Your Destiny In Your Own Hands, start with reading The Canadian Vanguard every market day. If and when you need more related information or to advertise your business products or services in The Canadian Vanguard, Contact Us
Our readers are strongly advised to conduct their own research into individual stocks before making a purchase decision. In addition, investors are advised that past stock performance is no guarantee of future price appreciation. Any recommendation is not a guarantee of any particular stock’s future prices, and The Canadian Vanguard accepts no responsibility or liability for investors’ or readers’ purchases.
Stocks In The News/ Stocks To Watch and Market Strategy will soon be available only to Paying Subscribers. The dollar sign “$” in the Toronto Market section in the articles only stands for Canadian dollar and in the US market section “$” stands for US dollar.
(c) This article is published by The Canadian Vanguard on September 12, 2026