
Precious and Industrial Metals Plunge, Dragging Stocks Lower
The Canadian Vanguard Stock Market Report – Monday December 29, 2025 Edition.
.
The Toronto Market
The S&P/TSX Composite Index declined by 103.17 points, or 0.32%, to close at 31,896.59, marking a second consecutive session of losses. The downward move was largely attributable to pronounced declines in gold and other precious metals, which exerted significant pressure on the materials sector and accounted for a substantial portion of the index’s weakness. Despite the recent pullback, the TSX Composite remains among the top-performing major equity indices year to date, reflecting strong gains accumulated earlier in the year and continued resilience across several key sectors.


![]()
Toronto Market Statistics
Market breadth on the TSX was negative, with declining issues exceeding advancing issues. A total of 1,122 securities declined, while 983 advanced, resulting in a decliner-to-advancer ratio of 1.14:1. An additional 182 securities closed unchanged, underscoring a modestly risk-off tone across the market.
Internal momentum indicators remained constructive, however, as the number of new 52-week highs increased to 195, compared with 13 new 52-week lows. This compares favorably with the prior session, which recorded 178 new highs and 17 new lows, suggesting continued underlying strength in select equities despite broader market weakness.
Total trading volume on the TSX reached 432.4 million shares, representing a 166% increase from the 162.1 million shares traded on Wednesday. The sharp increase in volume largely reflects the prior session’s abbreviated trading day, as the market was open for only a half-day, resulting in significantly below-average activity.
Toronto Market Wrap-Up Report
Market performance remained closely tied to commodity price movements, with sharp declines in precious metals exerting meaningful pressure on the index, particularly within resource-heavy segments of the Canadian equity market.
Telecommunications Services and Energy were the strongest-performing sectors on the TSX. Energy stocks benefited from firm commodity pricing and renewed investor interest, with Suncor Energy Inc. (SU) gaining 1.37% on volume of 5.6 million shares.
In contrast, Technology, Healthcare, and Basic Materials were the weakest sectors. Healthcare continues to underperform, having declined approximately 10% during last week’s shortened three-day trading period.
Stock-Specific Highlights
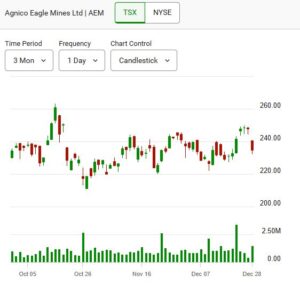
Precious metals equities, which had been among the year’s top performers, experienced sharp pullbacks amid declining gold and silver prices. Pan American Silver Corp. (TSX: PAAS) fell 5.67% on heavy volume of 9.2 million shares. Agnico Eagle Mines Ltd. (TSX: AEM) declined 5.25%, or $13.01, with 1.4 million shares traded. Franco-Nevada Corp. (TSX: FNV) dropped 3.53%, or $10.42, on volume of 444,400 shares, while Wheaton Precious Metals Corp. (TSX: WPM) declined 3.33%, or $5.53, with 1.3 million shares traded. Industrial metals miners generally held up better relative to precious metals peers.
Year-to-Date Leaders and Structural Themes
Despite the current pullback, the TSX remains one of the top-performing major equity indices year to date. Several high-profile names continue to reflect strong longer-term performance trends. Bombardier Inc. (BBD.B), while down 1.35% today to close at $235.90, has delivered substantial gains over the year, having closed at $92.95 on April 29. Cameco Corp. (TSX: CCO), a leading nuclear fuel and infrastructure company, declined modestly by 0.24% to $127.18. The stock previously traded at $62.84 earlier in the year and reached a high of $148.80 on October 29.
These companies remain noteworthy from a strategic investment perspective. The rapid expansion of large-scale data centers continues to drive demand for reliable, high-capacity power generation, positioning nuclear energy as a leading solution given current technological constraints. Both names remain suitable candidates for investor watchlists, a theme highlighted repeatedly in prior Stock Market Reports.
.
The US Markets
U.S. equity markets closed broadly lower, reflecting a risk-off session across major indices. The Dow Jones Industrial Average declined 249.04 points, or 0.51%, to close at 48,461.93. The S&P 500 Index fell 24.20 points, or 0.35%, ending the session at 6,905.74, while the Nasdaq Composite declined 118.75 points, or 0.50%, to finish at 23,474.35.
Small-cap stocks underperformed, with the Russell 2000 Index falling 14.55 points, or 0.57%, to close at 2,519.80. Performance among the Dow Jones Industrial Average and the Russell 2000 closely mirrored Friday’s session, as both indices again ranked among the weakest performers. The Nasdaq Composite marginally outperformed these indices but still posted a notable decline.
Overall, the session reflected broad-based weakness across U.S. equities, with selling pressure evident across large-cap, technology, and small-cap segments. In comparison, the Toronto Stock Exchange exhibited a relatively more balanced performance, supported by sector rotation and selective strength outside of commodity-linked equities.

Today’s U.S. Market Statistics
Market breadth across U.S. exchanges deteriorated meaningfully, reinforcing the negative tone observed in major equity indices.
On the New York Stock Exchange (NYSE), declining issues significantly outnumbered advancing issues. A total of 1,712 stocks declined, compared with 1,025 advancers, while 102 issues closed unchanged. This resulted in a decliner-to-advancer ratio of 1.67:1, indicating broad-based selling pressure. Internal momentum weakened sharply, as the exchange recorded only 41 new 52-week highs against 27 new 52-week lows. This represented a substantial decline from Friday’s session, which saw 342 new highs and 66 new lows, signaling a notable loss of upside leadership.
Total NYSE trading volume reached approximately 3.66 billion shares, representing a 38% increase from the 2.66 billion shares traded on Friday, suggesting heightened participation during the selloff.
Conditions were more pronounced on the NASDAQ, where selling pressure was concentrated in growth-oriented and technology stocks. Decliners totaled 3,351 issues, while advancers numbered 1,405, with 317 securities unchanged. This produced a decliner-to-advancer ratio of 2.38:1, or roughly twelve decliners for every five advancers.
New 52-week low activity accelerated on the NASDAQ, with 291 stocks registering new lows compared with 58 new highs. This compares unfavorably with Friday’s session, which recorded 140 new highs and 197 new lows, underscoring increasing downside momentum among growth and small-cap technology names.
NASDAQ trading volume rose to approximately 6.74 billion shares, up 29% from 5.22 billion shares traded in the prior session, further confirming elevated selling intensity.
U.S. Market Wrap-Up Report
U.S. equity markets experienced a broadly negative session, driven primarily by sharp reversals in precious and industrial metals and continued volatility in select high-valuation growth stocks. Commodity-linked assets, which had been among the strongest performers earlier in the year, came under significant pressure following regulatory and margin-related developments.
Commodities and Macro Drivers
The dominant market catalyst was the abrupt selloff in gold, silver, and other industrial and precious metals. Silver mining stocks, which had outperformed earlier in the year as silver prices surged from approximately $20 to $74, reversed sharply after the metal spiked to nearly $80 over the weekend. In response to heightened volatility and rapid price appreciation, CME Group announced an increase in margin requirements for gold and industrial metals futures, including silver, platinum, and palladium.
The tightening of margin requirements triggered forced deleveraging across the sector. As a result, silver prices declined 7.3% during the session, while gold prices fell 4.5%, effectively erasing the bulk of the recent gains recorded over the weekend. The sharp pullback weighed heavily on mining equities and broader market sentiment.
Equity Market Highlights
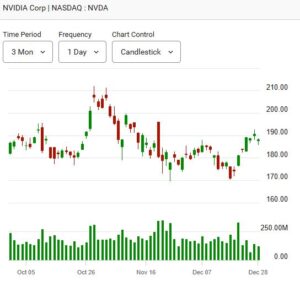
Within the Dow Jones Industrial Average, Nvidia Corp. (NVDA) was among the weakest performers, declining 1.2% amid continued valuation sensitivity across AI-related stocks. Elevated expectations and rich valuations have left the sector vulnerable to volatility, particularly during broader risk-off sessions.
Intel Corp. (INTC) outperformed the broader market after announcing the completion of an equity issuance totaling approximately 214.8 million common shares to Nvidia for $5 billion in cash. Intel shares rose 1.33%, or $0.48, to close at $36.68 on volume of 36.2 million shares, reflecting investor approval of the balance-sheet strengthening transaction.
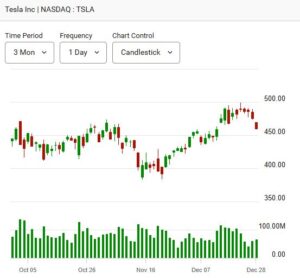
Tesla Inc. (TSLA) was among the worst performers on the S&P 500, declining 3.27%, or $15.55, to close at $459.64 on heavy volume of 66 million shares. The stock continues to face pressure amid reports indicating that full-year vehicle sales are projected to decline by approximately 7.75% year over year, with deliveries lagging several industry peers. The stock has now declined for four consecutive sessions, reinforcing near-term downside momentum.
Stocks Showing Relative Strength
Despite the broader market weakness, select names demonstrated relative resilience. EchoStar Corporation (SATS) advanced 2.8%, or $2.95, to close at $108.55, with 2.5 million shares traded.
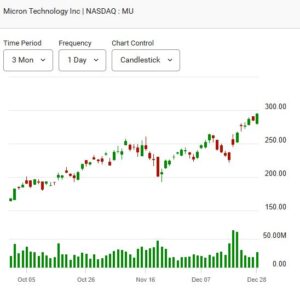
Micron Technology Inc. (MU), a key player in the memory semiconductor industry, rose 3.40%, or $9.69, to close at $294.37 on strong volume of 26.6 million shares, significantly outperforming the S&P 500, which declined approximately 0.3% during the session. The stock has exhibited elevated volatility in recent sessions, gaining 3.8% midweek before retreating modestly on Friday. MU’s relative strength amid broader market weakness positions it as a stock worth continued monitoring or inclusion on investor watchlists.
Market Outlook
Overall, the session underscored heightened sensitivity to policy, margin, and valuation-driven risks across commodities and growth equities. Near-term market direction is likely to remain influenced by commodity price stability, margin policy developments, and earnings visibility among high-multiple technology stocks.
Commodities and Bonds
Oil Price: Crude Oil futures was down -0.17% at $57.98 per barrel, as of the time (10:00 pm EST, Monday) of this post update.
Gold price is up $34.30, or 0.74%, at $4,376.00 per troy ounce, while silver price is up $3.03, or 4.31%, at $73.47 per ounce as of the time of this post update. Gold, other precious and industrial metals prices were up sharply over the weekend. However, the prices but crashed at the regular market session earlier today. Silver price dropped 7.5% during the regular market session today.
Bitcoin (BTC-USD) was trading down -$612.65 or 0.70% at $86,902.00 as of the time of this post update.
10 –year Treasury Yield: The 10-year Treasury yield declined 2.4 basis points to 4.11% during the day and remains at 4.11%, as of the time (10:00 pm EST, Monday) of this post update.
After-hours action: Futures are only little changed Monday evening after a session of profit taking in technology stocks during the regular market session today. Dow futures is down -10.00 points or -0.02% vs. fair value. S&P 500 futures is down -4.00 points or -0.06% at 6,951.00 and Nasdaq 100 futures is down -28.00 points or -0.11% at 25,710.75 as of the time (10:00pm EST, Monday) of this post update.
Reminder: Overnight futures often have little correlation to the following day’s regular trading session. All figures reflect market conditions at the time of capture only.
NOTICE TO READERS
- The Canadian Vanguard Stock Market is about empowering you to build and manage wealth by yourself. There is certainly no magic in managing finances or wealth but one needs to know what to do and commit to doing what is needed. When you are ready to start the journey to Put Your Destiny In Your Own Hands, read The Canadian Vanguard regularly, and to exchange ideas with a member of our team, click Contact Us
Our readers are strongly advised to conduct their own research into individual stocks before making a purchase decision. In addition, investors are advised that past stock performance is no guarantee of future price appreciation. Any recommendation is not a guarantee of any particular stock’s future prices, and The Canadian Vanguard accepts no responsibility or liability for investors’ or readers’ purchases.
Stocks In The News/ Stocks To Watch and Market Strategy will soon be available but only to Paying Subscribers.
(c) This article is published by The Canadian Vanguard on December 29, 2025