
Indexes Ease Lower as Gold and Industrial Metals Stage a Partial Rebound
The Canadian Vanguard Stock Market Report – Tuesday December 30, 2025 Edition.
.
The Toronto Market
Market Overview
The S&P/TSX Composite Index edged lower by 30.33 points (-0.10%) to close at 31,866.26, marking its third consecutive daily decline. The magnitude of the pullback was significantly smaller than the prior session’s loss, indicating a deceleration in short-term downside momentum. Intraday trading remained range-bound, with limited sector leadership and muted volatility. Reduced turnover, consistent with seasonal holiday effects, suggests the decline was driven more by lower liquidity than by broad-based risk aversion. From a technical perspective, the index remains near recent highs, and the shallow nature of the recent declines points to consolidation rather than a deterioration in underlying market conditions.


Toronto Market Statistics
Market breadth was positive despite the modest decline in the benchmark index, with advancing issues outpacing decliners. A total of 1,133 securities advanced versus 930 declines, resulting in an advancer-to-decliner ratio of 1.21:1, while 165 issues finished unchanged.
New 52-week highs continued to materially exceed new lows, underscoring underlying strength in select equities. The TSX recorded 148 new 52-week highs and 17 new 52-week lows, compared with 195 highs and 13 lows in the prior session, reflecting a moderation in momentum rather than a reversal.
Trading activity declined notably, with total volume reaching 366.7 million shares, a 15% decrease from the previous session’s 432.4 million shares. The lower volume is consistent with seasonal liquidity conditions and suggests that today’s price action occurred in a subdued participation environment rather than through broad-based repositioning.
Toronto Market Wrap-Up and Outlook
Trading on the TSX was subdued and uneven, reflecting ongoing sector rotation rather than broad-based risk aversion. Weakness early in the session was partly driven by the prior day’s sharp decline in gold and other precious metals, which weighed on index performance. However, the subsequent recovery in gold and industrial metal prices suggests that the earlier selloff may have been an overreaction rather than a structural shift in demand. Consistent with this view, several gold mining equities rebounded during today’s session.
Sector performance highlighted this rotation. Energy, Telecommunications, and Basic Materials emerged as the top-performing sectors, with Basic Materials rebounding after being the weakest performer in the previous session. The recovery in this sector reflects improving sentiment toward both precious and industrial metals, supported by stabilizing commodity prices.
In contrast, Financials, Healthcare, Industrials, and Technology lagged the broader market. Technology was the weakest sector, declining 1.87%, extending a rotation out of the sector that began early last week. The sustained weakness in Technology suggests profit-taking following prior strength and a shift in investor preference toward more cyclical and commodity-linked sectors.
Industry and Stock-Specific Highlights
Energy continued to attract capital, reinforcing evidence of an ongoing rotation into the sector. Three of the four top-performing industries within the TSX were related to Oil & Gas, including drilling, exploration, and integrated producers. Notable gainers included Suncor Energy Inc. (TSX: SU), Cenovus Energy Inc. (TSX: CVE), and Imperial Oil Ltd. (TSX: IMO). Suncor, in particular, has advanced in seven of the past eight sessions and outperformed the broader market both today and yesterday. The stock gained 1.77% ($1.06) to close at $60.97 on strong volume of 7.8 million shares.
The strength in Energy is being supported by rising in-situ bitumen production in Alberta. According to a recent RBC Capital Markets report, increasing production underscores Canada’s potential to strengthen its position as a global energy supplier. This structural tailwind suggests continued investor interest in select Energy names, warranting close monitoring of the sector.
From a technical standpoint, Imperial Oil remains weak, trading below its 25-day and 50-day moving averages and currently hovering near its 200-day moving average. While the stock bears watching for stabilization, the technical setup suggests caution, and new capital deployment appears premature at this stage.
Within Technology, several large-cap names contributed to the sector’s underperformance. Shopify Inc. (TSX: SHOP) declined 2.45% ($5.64) to close at $224.21 on 1.4 million shares, while Celestica Inc. (TSX: CLS) fell 1.28% ($5.33) to $410.04 on volume of approximately 450,000 shares. The continued weakness among market leaders reinforces the view that Technology is undergoing a near-term consolidation phase.
Near-Term Market Outlook
Looking ahead, the TSX appears to be transitioning into a consolidation phase characterized by selective leadership rather than broad index advances. Constructive breadth and sector rotation toward Energy and Basic Materials suggest that underlying risk appetite remains intact, while the pullback in Technology and Financials reflects repositioning rather than systemic stress. In the near term, market direction is likely to be influenced by commodity price stability, sector rotation dynamics, and the return of normal trading volumes. Overall, the outlook remains neutral to mildly constructive, with opportunities emerging primarily in cyclical and commodity-linked sectors.
.
The US Markets
U.S. equity markets closed modestly lower across all major indices, reflecting a cautious tone rather than broad-based risk aversion. The Dow Jones Industrial Average declined 94.87 points (-0.20%) to 48,367.06, while the S&P 500 slipped 9.50 points (-0.14%) to finish at 6,896.24. The Nasdaq Composite underperformed slightly, falling 55.27 points (-0.24%) to close at 23,419.08, weighed down by continued weakness in select large-cap technology names.
Small-cap stocks experienced more pronounced pressure. The Russell 2000 fell 19.21 points (-0.76%) to 2,500.59, declining steadily throughout the session from the opening bell to the close. The intraday trend highlights persistent selling pressure in smaller-cap equities, likely reflecting tighter financial conditions sensitivity, reduced risk appetite, and ongoing sector rotation toward larger, more liquid names.
The Russell 2000 has now underperformed all other major indices for five consecutive sessions and has been the weakest performer for the past three sessions. This sustained relative weakness suggests increasing investor caution toward economically sensitive and lower-liquidity segments of the market.
In the near term, the divergence between large-cap and small-cap performance bears close monitoring. While losses in the Dow, S&P 500, and Nasdaq remain contained—indicating market resilience—the continued drawdown in the Russell 2000 points to selective risk reduction rather than a broad market correction. If small-cap underperformance persists, it could act as an early warning signal for broader market consolidation. However, as long as large-cap indices hold recent support levels, the overall market outlook remains neutral, with downside risks concentrated primarily in higher-beta and economically sensitive segments.
![]()
U.S. Market Statistics
NYSE: Market breadth on the NYSE was modestly negative, with declining issues narrowly outpacing advancers. A total of 2,258 stocks declined versus 2,129 advances, producing a decliner-to-advancer ratio of 1.06:1, while 390 issues finished unchanged. The marginally negative breadth indicates a cautious market tone rather than broad-based liquidation.
Notably, the number of new 52-week highs increased sharply to 190, up from 41 in the prior session, while new lows rose to 80 from 27. The expansion on both sides of the distribution suggests increasing dispersion across sectors, with leadership emerging in select large-cap and defensive names even as pockets of weakness persist.
NYSE trading volume declined 8% to approximately 3.38 billion shares, consistent with a lower-conviction environment and reinforcing the view that today’s pullback lacked aggressive institutional selling.
NASDAQ: Breadth conditions were materially weaker on the NASDAQ, where decliners outnumbered advancers by a ratio of 1.67:1 (2,978 decliners versus 1,784 advancers), with 300 issues unchanged. This skew reflects continued pressure on growth-oriented and higher-beta stocks, particularly within the technology and small- to mid-cap segments.
The NASDAQ recorded 84 new 52-week highs and 251 new 52-week lows, compared with 58 highs and 291 lows in the prior session. While the reduction in new lows suggests some stabilization, the elevated level relative to new highs indicates that downside momentum remains dominant across a broad swath of the exchange.
Trading volume on the NASDAQ increased 3% to approximately 6.95 billion shares, indicating more active participation on a down day. This volume profile points to ongoing repositioning and profit-taking rather than passive consolidation.
U.S. Market Wrap-Up Report
Energy emerged as the leading sector across North American equity markets, supported by firm commodity pricing and renewed investor interest in cyclical exposures. In the U.S., Energy, Telecommunications Services, and Basic Materials were the top-performing sectors, while Healthcare, Industrials, and Consumer Discretionary—largely retail-oriented names—underperformed.
With only one trading session remaining in the year, market activity was relatively subdued, reflecting reduced liquidity and limited institutional repositioning. Precious and industrial metals, which experienced an abrupt and high-volume selloff in the prior session, rebounded meaningfully today. The sharp decline on Monday appears to have been driven largely by an overreaction rather than a deterioration in underlying fundamentals. Consistent with this assessment, several gold and silver mining equities posted solid gains, although many failed to fully retrace Monday’s losses. For example, Agnico Eagle Mines Ltd. (NYSE: AEM), which fell 5.25% in the previous session, stabilized but remained below pre-selloff levels.
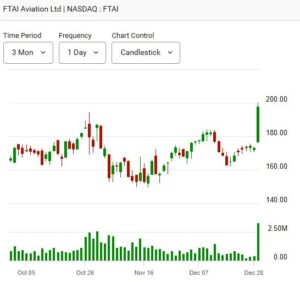
The standout equity of the session was FTAI Aviation Ltd. (NYSE: FTAI). The company, which specializes in commercial jet engine maintenance, drew significant investor attention after highlighting opportunities to repurpose jet engines into power turbines for electricity generation. This initiative targets growing energy constraints tied to the rapid expansion of large-scale data centers planned by major technology companies, where power availability has increasingly become a bottleneck. Shares of FTAI surged 15%, gaining $24.85 to close at $197.68 on elevated volume of 3.26 million shares.
Near-Term Market Outlook
Looking ahead, sector leadership in Energy and Basic Materials, combined with the rebound in metals prices, suggests that risk appetite remains selective rather than broadly risk-off. With year-end liquidity constraints still in place, near-term market movements are likely to remain muted and headline-driven. As trading volumes normalize in the new year, investors will be watching for confirmation of sector leadership and whether recent rotations solidify into more durable trends.
Commodities and Bonds
Oil Price: Crude Oil futures was mostly steady today. Oil price was down -0.28% at $57.80 per barrel, as of the time (11:30 pm EST, Tuesday) of this post update.
Gold price is down -$51.90, or -1.21%, at $4,334.70 per troy ounce, while silver price is down -$6.34, or -8.17%, at $71.55 per ounce as of the time of this post update.
Bitcoin (BTC-USD) was trading up $625.26 or 0.71% at $88,567.96 as of the time of this post update.
10 –year Treasury Yield: The 10-year Treasury yield was at 4.116%, as of the time (11:30 pm EST, Tuesday) of this post update.
After-hours action: Futures are only little changed Tuesday evening. Dow futures is down -58.00 points or -0.12% vs. fair value. S&P 500 futures is down -16.00 points or -0.23% at 6,928.75 and Nasdaq 100 futures is down -86.25 points or -0.34% at 25,585.00 as of the time (11:30pm EST, Tuesday) of this post update.
Reminder: Overnight futures often have little correlation to the following day’s regular trading session. All figures reflect market conditions at the time of capture only.
IMPORTANT NOTICE
- The Canadian Vanguard Stock Market is about empowering you to build and manage wealth by yourself. There is certainly no magic in managing finances or wealth but one needs to know what to do and commit to doing what is needed. When you are ready to start the journey to Put Your Destiny In Your Own Hands, read The Canadian Vanguard regularly, and to exchange ideas with a member of our team, click Contact Us
Our readers are strongly advised to conduct their own research into individual stocks before making a purchase decision. In addition, investors are advised that past stock performance is no guarantee of future price appreciation. Any recommendation is not a guarantee of any particular stock’s future prices, and The Canadian Vanguard accepts no responsibility or liability for investors’ or readers’ purchases.
Stocks In The News/ Stocks To Watch and Market Strategy will soon be available but only to Paying Subscribers.
(c) This article is published by The Canadian Vanguard on December 30, 2025