Big Tech Fuels U.S. Index Gains While Toronto’s S&P/TSX Lags
The Canadian Vanguard Stock Market Report – Monday January 26, 2026 Edition.
.
The Toronto Market
The S&P/TSX Composite Index slipped 51.66 points, or 0.16%, to close at 33,093.32. Despite today’s decline, the index has finished higher in nine of the past eleven trading sessions.
It was a weak session overall for the TSX. The index opened higher and edged up during the first half hour, reaching an intraday high near 33,419, before trending lower for the remainder of the day and closing below the 33,100 level.
Gains on the day were led primarily by gold, silver, and copper mining stocks.


![]()
Monday’s TSX Market Statistics
Market breadth was positive on Monday, with advancing issues clearly outpacing decliners. A total of 1,369 stocks advanced versus 843 decliners, producing a solid advancer-to-decliner ratio of 1.62:1. An additional 138 issues finished unchanged.
Momentum also remained strong, as 372 stocks recorded new 52-week highs compared with just 24 new lows. This marked an improvement from Friday’s session, which saw 269 new highs and 23 new lows, highlighting continued upside leadership across the market.
Trading activity increased meaningfully, with total TSX volume climbing to 591.9 million shares—up 28% from Friday’s 462.5 million shares—suggesting growing investor participation and commitment behind recent price action.
Toronto Market Wrap-Up Report
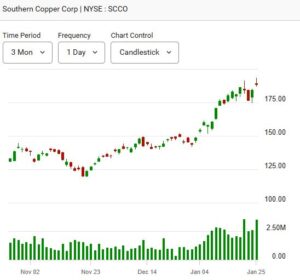
Precious and industrial metals miners continued to dominate the list of top performers on the TSX, with copper miners remaining particularly strong and well-represented among today’s leaders.
Overall market performance was narrow. The Basic Materials sector led the market, followed by Utilities and Energy, while Financials and Technology closed lower.
The Technology sector declined 0.49%. Despite the sector weakness, Celestica Inc. (TSX: CLS) gained 1.67% on volume of 517,100 shares, showing relative strength. Shopify Inc. fell 1.06% on 1.85 million shares traded, and its technical setup continues to deteriorate, suggesting further consolidation or repair may be needed. Nutrien Ltd. (TSX: NTR) slipped 0.88% on 2.2 million shares traded but remains a stock to monitor closely due to its liquidity and sector relevance.
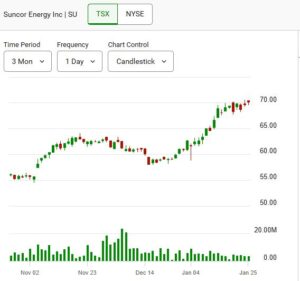
The Energy sector advanced, supported in part by Suncor Energy Inc. (TSX: SU), which rose 0.75% on volume of 3.4 million shares. The stock appears to be forming an early-stage flat base or consolidation pattern and remains technically constructive. Suncor has gained approximately 16% since early January, keeping it firmly on traders’ watchlists.
The Financials sector finished lower, with five of the six major banks closing in the red. Scotiabank (TSX: BNS) was the lone outperformer, rising 0.35%, while Canadian Imperial Bank of Commerce (TSX: CM) was the weakest of the group, declining 1.2%.
Among precious metals stocks, Wheaton Precious Metals Corp. (TSX: WPM) gained 1.23%, or $2.47, to close at $202.73 on volume of 1.109 million shares. WPM also trades on the NYSE, providing additional liquidity. Agnico Eagle Mines (TSX: AEM) continued its strong run, closing at $295.52 after having closed at $234.07 on January 2. The stock is now approximately 9% above its 50-day moving average, indicating it is somewhat extended. While gold stocks continue to trend higher, new entries should be approached with caution.
On the downside, Bombardier Inc. (TSX: BBD.D)—previously a top performer—fell sharply, down 9.33% on 817,000 shares traded. The decline followed a downgrade from Goldman Sachs, which raised its price target to $191 from $184 but cut the stock to Sell from Neutral, pressuring shares despite the higher target.
.
The US Markets
U.S. equity markets finished broadly higher, led by large-cap stocks. The Dow Jones Industrial Average rose 313.69 points, or 0.64%, to close at 49,412.40. The S&P 500 advanced 34.62 points, or 0.50%, ending the session at 6,950.23, while the Nasdaq Composite gained 100.11 points, or 0.43%, to finish at 23,601.36.
In contrast, the Russell 2000 underperformed, slipping 9.49 points, or 0.36%, to close at 2,659.67. The Russell 2000 was the only major U.S. index to decline on the day, highlighting relative weakness in small-cap stocks despite strength elsewhere in the market.
The divergence between large-cap and small-cap performance suggests the potential early stages of a rotation from small-cap to large-cap leadership. While the pullback in small caps was modest, continued outperformance by the Dow and S&P 500 would reinforce the view that investors are favoring size, stability, and balance-sheet strength over higher-risk segments of the market.

Monday’s U.S. Market Statistics
New York Stock Exchange (NYSE)
Market breadth on the NYSE was marginally positive, with advancing issues narrowly outpacing decliners. There were 1,411 advancers, 1,354 decliners, and 81 unchanged, resulting in an advancer-to-decliner ratio of 1.04:1, effectively signaling a neutral breadth environment.
Momentum moderated compared with Friday. The NYSE recorded 185 new 52-week highs and 18 new 52-week lows, down from 302 new highs and 14 new lows in the prior session, indicating some cooling in upside leadership.
Trading activity increased modestly, with total NYSE volume reaching 5.03 billion shares, up 3% from 4.89 billion shares traded on Friday, suggesting steady—but not aggressive—institutional participation.
NASDAQ
Breadth on the NASDAQ tilted slightly negative, with declining stocks modestly outnumbering advancers. The exchange saw 2,466 decliners versus 2,384 advancers, producing a decliner-to-advancer ratio of 1.03:1, with 164 issues unchanged.
Leadership narrowed more noticeably in growth and technology stocks. The NASDAQ posted 284 new 52-week highs and 119 new 52-week lows, compared with 568 new highs and 82 new lows on Friday, highlighting reduced upside momentum and increased dispersion.
NASDAQ trading volume declined to 7.71 billion shares, down 7% from 8.31 billion shares on Friday, reflecting lighter participation and a more cautious tone among growth-oriented traders.
U.S. Market Wrap-Up Report
U.S. equity markets delivered a broadly constructive session, with seven of the eleven major sectors closing higher. Technology, Utilities, and Financials led the advance, while Basic Materials and Consumer Discretionary lagged modestly. Notably, even among the laggards, downside pressure was limited—Basic Materials slipped just 0.13%, while Energy finished flat, underscoring a generally resilient tape.
Breadth & Index Divergences
Despite gains in the S&P 500 and Nasdaq Composite, market breadth painted a more nuanced picture. NYSE breadth was essentially neutral, while NASDAQ breadth skewed slightly negative, with decliners narrowly outnumbering advancers. This divergence suggests that index-level strength was driven primarily by large-cap leadership rather than broad participation.
The Nasdaq Composite’s advance, in particular, masked internal weakness, as fewer stocks participated in the rally even while the index pushed higher. This type of divergence often reflects concentrated buying in mega-cap technology names, rather than a broad-based risk-on move.
Large-Cap vs. Small-Cap Rotation
This breadth behavior aligns with the underperformance seen in small-cap stocks, reinforcing the view that the market may be entering—or already in—the early stages of a rotation from small caps into large caps. Investors appear to be favoring liquidity, balance-sheet strength, and earnings visibility, characteristics typically associated with large-cap and mega-cap stocks, particularly in Technology and Financials.
If this rotation persists, continued leadership from the Dow, S&P 500, and Nasdaq—paired with lagging Russell 2000 performance—would confirm a more defensive or selective risk posture, rather than a full risk-on expansion.
Sector & Volume Insights
While Technology led on price performance, volume analysis revealed stronger buyer interest in Basic Materials, particularly within gold mining stocks. Elevated volumes alongside firm pricing suggest institutional accumulation, reflecting sustained demand for precious metals amid ongoing geopolitical uncertainty.
Gold miners continue to benefit from gold’s role as a safe-haven asset, as global trade tensions and geopolitical risks remain elevated. Precious metals have emerged as a refuge for capital, though investors should be mindful of the fundamental differences between gold and copper within this space.
Gold vs. Copper – Fundamental Distinction
Unlike copper, which is 100% consumed for industrial applications, gold prices are driven primarily by investment demand rather than physical consumption. According to the World Gold Council, investment accounted for 41% of gold’s final demand in Q3 2025, followed by jewelry at 28%, while industrial applications represented just 6%. This distinction is critical when evaluating miners’ price behavior during periods of macro stress.
Stock Highlights
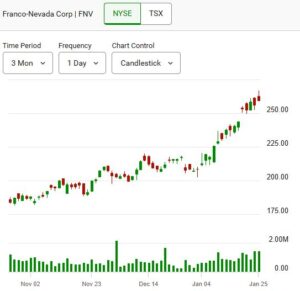
- Franco-Nevada Corp. (FNV) remains a key name to watch as gold prices stay elevated. The stock rose 1.33% ($3.41) to close at $259.16 on 1.4 million shares, reflecting continued investor appetite for high-quality precious metals exposure.
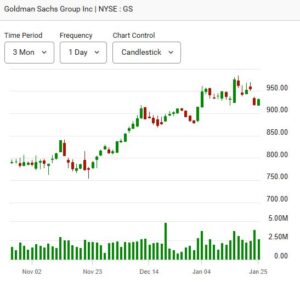
- In Financials, Goldman Sachs advanced 1.41% ($12.98) to close at $931.86, with 2.65 million shares traded, reinforcing large-cap financial leadership.
- Oracle Corp. (ORCL) gained 2.98% ($5.28) to close at $182.44 on 21 million shares. Despite the strong session, the stock’s technical structure remains damaged, as noted in last week’s report, suggesting further base-building may be required before a sustainable advance.
NOTICE TO READERS
The Canadian Vanguard Stock Market is about empowering you to build and manage wealth by yourself. There is certainly no magic in managing finances or wealth but one needs to know what to do and commit to doing what is needed. When you are ready to start the journey to Put Your Destiny In Your Own Hands, read The Canadian Vanguard every market day. If you need more information please Contact Us
Our readers are strongly advised to conduct their own research into individual stocks before making a purchase decision. In addition, investors are advised that past stock performance is no guarantee of future price appreciation. Any recommendation is not a guarantee of any particular stock’s future prices, and The Canadian Vanguard accepts no responsibility or liability for investors’ or readers’ purchases.
Stocks In The News/ Stocks To Watch and Market Strategy will soon be available but only to Paying Subscribers.
(c) This article is published by The Canadian Vanguard on January 26, 2026