
Markets Push Higher to Record Levels on Hopes U.S.–Iran Ceasefire Holds
The Canadian Vanguard Stock Market Report – Thursday April 16, 2026 Edition.
.
The Toronto Market
Thursday’s Toronto Market Index
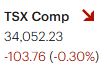
The S&P/TSX Composite Index declined by 103.76 points, or 0.30%, to close at 34,052.23. This marks a modest pullback following eleven consecutive sessions of gains.
The decline is relatively minor and can best be described as a slight and orderly retracement rather than a shift in market sentiment. Trading volume also edged lower, falling by approximately 4% compared to the previous session, indicating limited selling pressure.
It is notable that the index remained above the 34,000 level. While this is not a technically significant threshold, it does reflect continued underlying strength. For context, the recent high stands at 34,541, reached on March 31.
Overall, the pullback appears normal and largely expected after an extended upward run. Current indications suggest this movement represents a healthy pause rather than the beginning of a broader correction.

![]()
Thursday’s TSX Market Statistics
At the S&P/TSX Composite Index, declining issues outnumbered advancing issues. A total of 1,103 stocks declined, compared to 1,012 that advanced, resulting in a decliner-to-advancer ratio of 1.09 to 1—effectively close to parity, with a slight negative bias. An additional 163 issues remained unchanged.
The exchange recorded 174 new 52-week highs and 25 new 52-week lows. This compares to 186 new highs and 19 new lows in the previous session, indicating a modest cooling in upside momentum while new lows remain relatively limited.
Total trading volume on the TSX reached 418,807,382 shares, representing a 4% decrease from the 436,842,362 shares traded yesterday. The lighter volume suggests that the day’s pullback occurred without significant selling pressure.
Overall, market breadth showed mild weakness, but not to a degree that would signal a decisive shift in trend.
.
The US Markets
Thursday’s U.S. Market Indexes
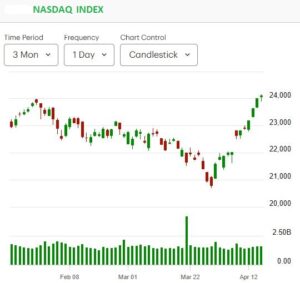
U.S. equities closed higher, with all major indexes finishing in positive territory. The Dow Jones Industrial Average rose 115.00 points, or 0.24%, to close at 48,578.72. The S&P 500 gained 18.33 points, or 0.26%, ending the session at 7,041.28. The Nasdaq Composite advanced 86.69 points, or 0.36%, to finish at 24,102.70, while the Russell 2000 Index added 5.94 points, or 0.22%, closing at 2,719.60.
The Nasdaq continues to demonstrate notable strength, extending its rally with a twelfth consecutive daily gain. While today’s increase of 0.36% is more modest compared to the previous session’s 1.6% surge, the sustained upward momentum highlights strong investor appetite for technology and growth stocks.
Both the Nasdaq Composite and the S&P 500 remain in record territory, underscoring the resilience of the current market trend. A winning streak of this length for the Nasdaq has not been seen since 2009, emphasizing the scale of the current outperformance.
Overall, the market continues to be driven by renewed strength in the technology and growth sectors, which remain at the forefront of the ongoing rally.

Thursday’s U.S. Market Statistics
On the New York Stock Exchange (NYSE), advancing issues outnumbered declining issues, indicating modestly positive market breadth. A total of 2,457 stocks advanced, compared to 2,001 decliners, while 360 issues remained unchanged. This resulted in an advancer-to-decliner ratio of 1.22 to 1—approximately six advancers for every five decliners. Overall, market breadth remained largely consistent with the previous session.
The NYSE recorded 351 new 52-week highs and 40 new 52-week lows, compared with 271 new highs and 45 new lows yesterday. This increase in new highs alongside a slight decline in new lows points to strengthening upside momentum.
Total NYSE trading volume reached 5,246,067,694 shares, representing a 2% decrease from the 5,360,574,765 shares traded in the prior session, suggesting lighter participation despite the market’s gains.
On the Nasdaq Stock Market, advancing stocks also outpaced declining stocks, though by a narrower margin. There were 2,553 advancers and 2,272 decliners, resulting in an advancer-to-decliner ratio of 1.12 to 1, with 348 issues unchanged.
The Nasdaq posted 285 new 52-week highs and 64 new 52-week lows, compared with 235 new highs and 73 new lows in the previous session. This reflects continued strength in leading stocks, even as some pockets of weakness persist.
Total Nasdaq trading volume amounted to 10,225,922,434 shares, down 3% from the previous session’s 10,527,546,105 shares. As with the NYSE, the decline in volume suggests that the day’s gains were not driven by aggressive buying activity.
Overall, both exchanges showed positive but measured breadth, with improving new highs supporting the continuation of the broader market uptrend.
U.S. Market Wrap-Up Report
U.S. equities extended their upward momentum, with all major indexes closing higher. Both the Nasdaq Composite and the S&P 500 finished at fresh record highs, reinforcing a strong bullish trend supported by continued risk-on sentiment.
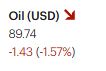
Sector performance remained constructive, with six of eleven sectors advancing. Communication Services led (+2.79%), followed by Energy (+1.64%) and Technology (+0.45%). Financials (-0.31%) and Healthcare (-0.71%) lagged, suggesting ongoing rotation dynamics as capital flows back toward growth and cyclical leadership.
Leadership & Stock-Level Trends
Verizon Communications (VZ) rose 3.89%, aligning with strength in Communication Services.
Technology leadership remained broad:
- Cisco Systems (CSCO) +2.60%
- IBM +2.53%
- Microsoft (MSFT) +2.20%
- Salesforce (CRM) +2.04%
The participation of large-cap software names suggests that the prior rotation out of software may be stabilizing. For traders, this is an early signal that leadership could broaden further within growth.
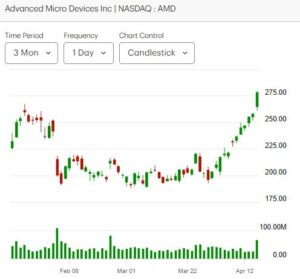
Within the S&P 500, Albemarle Corporation (ALB) surged 16.31%, while Advanced Micro Devices (AMD) gained 7.80%, marking a 12-session winning streak with volume significantly above its 50-day average—a strong momentum confirmation signal. Arista Networks (ANET) added 4.33%, reinforcing strength in AI infrastructure.
In semiconductors, TSMC (TSM) declined 3.5% despite strong earnings, reflecting elevated expectations and possible short-term rotation. Nonetheless, the broader AI-driven demand narrative remains intact.
Intel (INTC) gained 5.5% and broke out to a new 52-week high, signaling renewed momentum interest within the chip space.
Technical Outlook (Near-Term Levels to Watch)
S&P 500
- Immediate support: ~7,000 (psychological level and recent breakout zone)
- Secondary support: 6,920–6,950 (prior consolidation range)
- Resistance: Blue-sky territory above 7,050; next moves will depend on momentum continuation
The index remains extended above short-term moving averages, suggesting strong momentum but also increasing the probability of short-term consolidation.
Nasdaq Composite
- Immediate support: ~23,800–24,000 (recent breakout area)
- Secondary support: ~23,500
- Resistance: Continues in uncharted territory; momentum-driven upside
A 12-session winning streak places the Nasdaq in overbought territory on many technical indicators (e.g., RSI), which traders should monitor for potential mean reversion.
Market Breadth & Momentum
While indexes are at highs, breadth has been mixed in recent sessions. Sustained rallies typically require expanding participation—something to monitor closely in the next few sessions.
Key Risks to Watch (Next Session and Near-Term)
1. Overbought Conditions
The extended rally—especially in the Nasdaq—raises the risk of short-term pullbacks. Even a modest catalyst could trigger profit-taking after such a strong run.
2. Narrowing Leadership
Although software and tech are reasserting strength, leadership remains somewhat concentrated. If participation does not broaden, the rally could become more fragile.
3. Sector Rotation Volatility
Weakness in Financials and Healthcare suggests ongoing repositioning. արագ rotations can create choppy conditions beneath the surface, even if indexes remain elevated.
4. Earnings Reactions vs Expectations
The reaction to TSMC highlights a key theme: strong results are not always enough if expectations are already priced in. This dynamic could lead to increased volatility around earnings releases.
5. Volume Divergence
Both NYSE and Nasdaq volumes declined despite index gains. Rising markets on declining volume can indicate weakening conviction and should be monitored for confirmation or divergence.
Bottom Line for Investors & Traders
The primary trend remains firmly bullish, supported by strong momentum, record highs, and renewed leadership in growth sectors—particularly technology and AI-linked names.
- For investors: The backdrop continues to favor growth exposure, but selectivity and risk management are increasingly important at elevated valuations.
- For traders: Momentum remains the dominant strategy, but conditions are becoming extended. Monitoring key support levels and volume will be critical for identifying whether this rally continues or pauses.
A consolidation or mild pullback at this stage would be technically healthy and could provide more sustainable entry points if the broader trend remains intact.
NOTICE TO READERS
When you are ready to start the journey to Take Charge and Put Your Destiny In Your Own Hands, read The Canadian Vanguard every market day. If you need more related information, Contact Us
Our readers are strongly advised to conduct their own research into individual stocks before making a purchase decision. In addition, investors are advised that past stock performance is no guarantee of future price appreciation. Any recommendation is not a guarantee of any particular stock’s future prices, and The Canadian Vanguard accepts no responsibility or liability for investors’ or readers’ purchases.
Stocks In The News/ Stocks To Watch and Market Strategy will soon be available but only to Paying Subscribers. The dollar sign “$” in the Toronto Market section in the articles only stands for Canadian dollar and in the US market section “$” stands for US dollar.
(c) This article is published by The Canadian Vanguard on April 16, 2026