
Sustained Tech Rotation Sparks Broad Market Selloff
The Canadian Vanguard Stock Market Report – Thursday February 5, 2026 Edition.
.
The Toronto Market
The Toronto Market Index
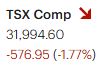
The S&P/TSX Composite Index declined 576.95 points, or 1.77%, to close at 31,994.60, reflecting broad-based selling pressure. The move follows a sharp selloff on Friday, January 30, when the TSX closed at 31,924. Despite a three-session rebound on Monday through Wednesday, today’s decline fully retraced those gains, reinforcing the near-term vulnerability of the index.
From a technical perspective, downside momentum accelerated after the first hour of trading, with the index failing to establish intraday support. The TSX remained approximately 400 points lower for the majority of the session and closed near the session low, a bearish signal indicating persistent selling interest into the close. Overall market action suggests a lack of conviction among buyers and limited support for a sustained uptrend in the near term.

![]()
Thursday’s TSX Market Statistics
Market breadth on the TSX was decisively negative, with declining issues significantly outpacing advancing issues. A total of 1,622 stocks declined versus 614 advancers, resulting in a decliner-to-advancer ratio of 2.64:1, or approximately five decliners for every two advancers. An additional 116 issues were unchanged on the session.
Internal momentum weakened further as new 52-week lows exceeded new highs. The TSX recorded 91 new 52-week highs and 110 new 52-week lows, a notable deterioration from the prior session, which saw 274 new highs and 109 new lows. This shift reflects waning upside participation and increasing downside pressure across the market.
Total trading volume reached 563.5 million shares, representing an 11% decline from the 632.5 million shares traded in the previous session. The lighter volume suggests reduced investor conviction amid the broader market pullback.
Toronto Market Wrap-Up Report
The S&P/TSX Composite Index plunged on Thursday, extending losses throughout the trading session. Selling pressure was persistent from the open, with the market remaining firmly negative for the duration of the day. Only one of the TSX’s ten major sectors closed in positive territory. Utilities gained 0.45%, standing out as the lone advancer and reflecting a defensive rotation as investors sought relative safety amid heightened market volatility.
Technology and Basic Materials were the session’s weakest performers, declining 2.02% and 6.39%, respectively. Notably, no metal mining stocks appeared among the TSX’s top 20 performers—a rare occurrence given the index’s heavy weighting toward resource and mining companies. This absence underscores the breadth and severity of the selloff in cyclical and commodity-linked names.
Despite the overall market decline, performance among the day’s top 20 stocks was broad-based, with representation from nine of the ten sectors. Eight of those sectors posted gains within the top-performer list, led by Consumer Discretionary and Energy stocks. The Discretionary Consumer Goods & Services sector advanced 2.58%, benefiting from selective buying interest.
Within the Technology sector, performance was mixed. Celestica Inc. emerged as the top-performing stock on the TSX and led the “Top 20 Stocks of the Day.” In contrast, shares of Shopify Inc. (TSX: SHOP) declined 2.75% to close at $152.41 on volume of 2.4 million shares. Shopify remains 39.8% below its 52-week high of $253.10, with trading volume exceeding its 50-day average of 1.7 million shares, indicating elevated investor activity amid the broader selloff.
In the Financials sector, only two of Canada’s Big Six banks closed higher. Bank of Nova Scotia (TSX: BNS) gained 1.08%, or $1.10, on volume of 8.89 million shares, while National Bank of Canada (TSX: NA) rose 0.73%, or $1.21, with 2.47 million shares traded. The remaining four banks ended the session modestly lower, with declines ranging from 0.53% for Royal Bank of Canada to 0.20% for Bank of Montreal, reflecting relative resilience despite overall market weakness.
Weekly Outlook:
Heading into the remainder of the week, market internals and sector rotation point to a fragile technical backdrop for the TSX. The dominance of defensive leadership, weakness in materials, and limited participation among financials suggest investors remain focused on capital preservation rather than risk accumulation. Unless commodity-linked sectors stabilize and broader market breadth improves, near-term rallies may be viewed as corrective rather than trend-forming. Investors may continue to favor defensive sectors, high-quality balance sheets, and stock-specific opportunities while maintaining caution toward cyclicals until clearer signs of stabilization emerge.
.
The US Markets
U.S. Market Indexes
U.S. equity markets posted broad-based losses, with all major indexes declining by more than 1% and closing near their intraday lows—an indication of sustained selling pressure throughout the session. The Dow Jones Industrial Average fell 592.58 points, or 1.20%, to close at 48,908.72. The S&P 500 declined 84.32 points, or 1.23%, ending the day at 6,798.40, while the Nasdaq Composite dropped 363.99 points, or 1.59%, to finish at 22,540.59.
Small-cap stocks underperformed, with the Russell 2000 plunging 46.90 points, or 1.79%, to close at 2,577.65. The magnitude of the decline in small caps is particularly notable, as it reflects heightened risk aversion and reduced appetite for economically sensitive and lower-liquidity names.
From a technical standpoint, all four indexes traded in negative territory for the majority of the session and closed just above their respective session lows. The near-identical intraday chart patterns across indexes point to systematic, program-driven selling rather than isolated sector weakness. Market breadth and price action suggest that selling decisively outweighed buying interest, reinforcing a risk-off environment.
Outlook:
The synchronized declines across large-cap, technology, and small-cap indexes, combined with closes near the lows, warrant a cautious near-term trading stance. Until volatility subsides and indexes demonstrate the ability to reclaim key support levels on improving breadth, rallies are likely to face resistance. Investors may favor capital preservation strategies and selective positioning while monitoring for signs of stabilization.

Thursday’s U.S. Market Statistics
New York Stock Exchange (NYSE): Market breadth on the NYSE deteriorated meaningfully, with declining issues decisively outnumbering advancing issues. A total of 3,180 stocks declined versus 1,427 advancers, with 358 issues unchanged. This produced a decliner-to-advancer ratio of 2.23:1, indicating that sellers maintained a clear advantage throughout the session.
Internal momentum weakened as the number of new 52-week highs fell sharply while new lows increased. The NYSE recorded 285 new 52-week highs and 276 new 52-week lows, compared with 595 new highs and 226 new lows in the prior session. This reversal signals fading upside participation and growing downside pressure.
Total NYSE trading volume reached 7.12 billion shares, representing a 6% decline from the 7.59 billion shares traded the previous day. The lighter volume suggests reduced conviction among buyers amid the broader market pullback.
NASDAQ: Market internals were similarly negative on the NASDAQ, where declining issues outpaced advancers for the fourth consecutive session. The exchange saw 3,749 decliners versus 1,143 advancers, with 222 issues unchanged, resulting in a decliner-to-advancer ratio of 1.65:1—approximately seven decliners for every five advancers.
Breadth deterioration was more pronounced on the NASDAQ, particularly among growth-oriented stocks. New 52-week lows surged to 581, while new highs fell to 161, compared with 345 new highs and 449 new lows in the prior session. This divergence highlights mounting pressure on higher-beta and momentum-driven names.
Total NASDAQ trading volume amounted to 10.44 billion shares, about 6% lower than the 11.06 billion shares traded yesterday. The decline in volume, combined with worsening breadth, underscores a risk-averse environment and continued defensive positioning by market participants.
U.S. Market’s Wrap-Up Report
U.S. equity markets closed sharply lower on Thursday, with all major indexes declining amid elevated trading volume relative to recent daily averages. The combination of broad-based price weakness and higher volume is a negative signal for investors, indicating strong institutional selling rather than isolated profit-taking. A continued rotation away from technology—particularly software and high-multiple growth stocks—was a primary driver of the day’s selloff.
Only one of the eleven sectors within the S&P 500—Durable Consumer Goods & Services—ended the session in positive territory. Market leadership narrowed significantly, underscoring the severity of the risk-off environment. Discretionary Consumer Goods & Services declined 2.22%, while Basic Materials fell 3.47%, making them the session’s weakest-performing sectors. Although gold and silver mining stocks have recently pulled back alongside declining precious metal prices, these moves appear corrective in nature. Most analysts continue to expect gold and silver prices to trend higher over time, which would likely support renewed upside in precious metal miners once the consolidation phase concludes.
Technology stocks remained under pronounced pressure. Semiconductor names led the downside, with Advanced Micro Devices (AMD) plunging 17.31%. SanDisk Corp. (SNDK) illustrates the extent of recent volatility within the sector. After closing at $201.87 on December 15, SNDK surged to $409.24 by January 15, 2026, gaining 5.53% on 14.1 million shares traded. The stock then declined 15.95% ($110.96) on Wednesday, followed by an additional 1.43% ($8.35) drop on Thursday. Despite these pullbacks, SanDisk gained more than 560% in 2025, and its strong momentum carried into early 2026. However, the recent price action suggests the stock may be entering the early stages of consolidation—a reminder that extended rallies are often followed by periods of digestion.
Weekly and Macro Outlook
Market internals reinforce the cautious tone suggested by index-level declines. On both the NYSE and NASDAQ, decliners materially outpaced advancers, while new 52-week highs fell sharply and new lows expanded—particularly on the NASDAQ, where growth stocks dominate. These breadth dynamics, combined with declining volume participation, signal weakening underlying momentum and reduced risk appetite.
From a macro perspective, the synchronized selling across sectors and capitalization tiers suggests investors are reassessing exposure amid valuation concerns and elevated uncertainty. The persistent rotation away from technology, coupled with defensive positioning and limited leadership, implies that near-term market rallies may struggle to gain traction without a meaningful improvement in breadth and sector participation. Heading into the coming week, investors may continue to favor capital preservation, selectively rotate into under-owned or defensive sectors, and await clearer technical stabilization before re-engaging aggressively in high-beta growth names.
Bull / Base / Bear Weekly Scenarios
Bull Case
In the bull scenario, U.S. equity markets stabilize as selling pressure in technology moderates and market breadth begins to improve. A rebound in advancing issues, coupled with a recovery in new 52-week highs, would signal renewed investor confidence. Earnings results from large-cap technology and consumer companies exceed tempered expectations, supporting valuations and encouraging selective risk-taking. Treasury yields stabilize or decline modestly, easing financial conditions and providing support for growth-oriented sectors. Under this scenario, recent weakness proves corrective rather than structural, and the major indexes attempt to reclaim near-term resistance levels.
Base Case
The base case assumes continued consolidation and elevated volatility as markets digest recent gains and sector rotation persists. Technology stocks remain under pressure, while defensive and value-oriented sectors attract incremental inflows. Market breadth remains mixed, with neither buyers nor sellers asserting decisive control. Earnings season delivers uneven results, reinforcing stock-specific performance rather than broad index advances. Interest rates remain range-bound as inflation data shows gradual moderation but not enough to prompt immediate policy shifts. In this environment, markets move sideways with a downward bias, favoring disciplined positioning and selective opportunities.
Bear Case
The bear scenario unfolds if selling pressure accelerates and deteriorating market internals persist. Further expansion in new 52-week lows, particularly on the NASDAQ, would signal deeper stress in growth and momentum stocks. Disappointing earnings from large-cap technology or consumer leaders exacerbate downside risk, while higher-than-expected inflation readings push bond yields higher and tighten financial conditions. In this case, defensive assets outperform, cyclical sectors underperform, and major indexes break below key technical support levels, extending the current drawdown.
Key Macro Catalysts to Watch
- Interest Rates:
Treasury yield direction remains critical. Stabilization or easing in yields would help relieve pressure on high-duration growth stocks, while renewed upside in yields could further weigh on technology and small-cap equities. - Inflation Data:
Upcoming inflation releases will shape expectations around the Federal Reserve’s policy path. Evidence of cooling inflation would support risk assets, while sticky or re-accelerating inflation could reinforce a higher-for-longer rate narrative. - Earnings Season:
Corporate earnings remain the primary driver of near-term market direction. Forward guidance—particularly from technology, consumer discretionary, and financial companies—will be closely scrutinized for signs of margin compression, demand softness, or resilience. - Sector Rotation Signals:
Continued leadership from defensive sectors would reinforce a cautious outlook, while renewed participation from technology and cyclicals would be an early signal of improving risk appetite.
Commodities and Bonds Update
Oil: Oil prices extended a decline ahead of upcoming U.S.-Iran talks. As of this update, U.S. crude is up $0.90 at $64.16 per barrel.
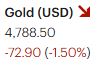
Precious Metals: Gold traded lower, down $36.50, or 0.75%, at $4,853.20 per troy ounce. Silver fell more sharply, down $5.25, or 6.82%, to $71.46 per ounce (12:30 a.m. EST, Friday).
Cryptocurrency: Bitcoin (BTC-USD) recovered earlier losses and was trading higher by $1,454.78, or 2.36%, at $64,982 as of the time of this update.
10-Year Treasury Yield: The benchmark 10-year U.S. Treasury yield stood at 4.192% (12:30 a.m. EST, Friday).
After-Hours Futures: U.S. equity futures showed modest declines Thursday evening into Friday morning. Dow futures were down 45 points (-0.09%), S&P 500 futures declined 12.25 points (-0.17%) to 6,808.75, and Nasdaq 100 futures fell 72.75 points (-0.29%) to 24,581.25 as of 12:30 a.m. EST.
Note: Overnight futures often have limited correlation to the regular trading session. All figures reflect market conditions at the time of capture.
NOTICE TO READERS
The Canadian Vanguard Stock Market is about empowering you to build and manage wealth by yourself. There is certainly no magic in managing finances or wealth but one needs to know what to do and commit to doing what is needed. When you are ready to start the journey to Put Your Destiny In Your Own Hands, read The Canadian Vanguard every market day. If you need more information please Contact Us
Our readers are strongly advised to conduct their own research into individual stocks before making a purchase decision. In addition, investors are advised that past stock performance is no guarantee of future price appreciation. Any recommendation is not a guarantee of any particular stock’s future prices, and The Canadian Vanguard accepts no responsibility or liability for investors’ or readers’ purchases.
Stocks In The News/ Stocks To Watch and Market Strategy will soon be available but only to Paying Subscribers.
(c) This article is published by The Canadian Vanguard on February 5, 2026