


The Canadian Vanguard Stock Market Report Weekend April 17-19, 2026 Edition
Markets Rally Strongly as Investors Anticipate Easing Geopolitical Tensions and Potential End to Conflict
The Canadian Vanguard Stock Market Report is updated regularly during the weekend
See our Weekend Feature Article at the bottom of this page: Article Title: What if TD Bank’s share price doubles in one year
.
The Toronto Market
Friday’s Toronto Market Index
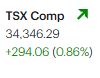
The Toronto S&P/TSX Composite Index gained 294.06 points, or 0.86%, to close at 34,346.29. The index has now advanced in twelve of the past thirteen trading sessions, underscoring the strength of the current rally.
Today’s gain was supported by a 40% increase in trading volume compared to the previous session, a clear sign of strengthening momentum. The nearly 1% rise also suggests a growing level of conviction among traders and investors.
The market opened above the prior session’s close, continued to trend upward throughout the day, and finished well above its session low—further reinforcing the positive tone.
![]()
Thursday’s TSX Market Statistics
On the TSX, advancing issues significantly outnumbered declining issues. There were 1,777 advancers compared to 470 decliners, resulting in an advancer-to-decliner ratio of 3.78 to 1—approximately four advancers for every decliner. An additional 97 issues closed unchanged.
The exchange recorded 327 new 52-week highs and 32 new 52-week lows, compared with 174 new highs and 25 new lows in the previous session.
Total trading volume reached 589,634,352 shares, representing a 40% increase from the 418,807,382 shares traded in the prior session.
Overall, the Toronto market delivered a strongly bullish session, supported by a notable increase in trading volume—an encouraging sign for investors.
Friday’s Toronto Market Wrap-Up Report
The TSX rally is showing increasing strength, with gains recorded in ten of the past twelve sessions—an indication of sustained upward momentum. However, with the index now trading just below its all-time high of 34,544 (March 1), the risk-reward profile is becoming less favorable in the near term, and the probability of a technical pullback is rising.
Intraday price action reinforces the bullish bias, but also signals a maturing trend. Today’s high of 34,431 places the index within close proximity of resistance, where profit-taking and short-term consolidation are likely to emerge.
Market breadth was constructive, with six of ten sectors closing higher, suggesting underlying support for the advance. Leadership came from Consumer Discretionary (+2.98%) and Technology (+2.21%), with additional support from Basic Materials (+1.88%) and Financials (+1.45%). In contrast, defensive positioning was limited, while Energy (-2.74%) and Utilities (-0.73%) lagged, highlighting a clear rotation away from commodity-linked sectors.
On a weekly basis, sector rotation has become more pronounced. Technology (+11.46%) has reasserted leadership, supported by strong momentum and capital inflows. Financials (+3.44%) and Healthcare (+2.95%) also demonstrated relative strength. Meanwhile, Energy (-1.70%) and Consumer Discretionary (-4.77%) lagged, reflecting both declining oil prices and a shift in investor positioning.
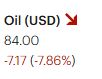
The pullback in oil—likely influenced by easing geopolitical tensions—is acting as a catalyst for this rotation. Energy and resource stocks, which previously led the market, are now under distribution, while capital is rotating into growth-oriented sectors such as technology and financials. This shift suggests a transition from a commodity-driven rally to a broader, more diversified advance.
Stock-specific action further confirms this divergence. Canadian Natural Resources Limited (CNQ) declined 7.34% on heavy volume (21.95 million shares), signaling potential distribution. Suncor Energy Inc. also weakened, falling 4.21% with elevated volume, reinforcing the bearish near-term outlook for the energy sector.
Conversely, strength in growth and financial names remains notable. Celestica Inc. (CLS) and four of Canada’s Big Six banks—Canadian Imperial Bank of Commerce (CM), National Bank of Canada (NA), Bank of Montreal (BMO), and Royal Bank of Canada (RY)—all reached new 52-week highs. This reflects continued institutional accumulation and suggests that leadership is rotating toward sectors with stronger earnings visibility and momentum characteristics.
Outlook:
While the primary trend remains bullish, the TSX is approaching a key resistance zone. Traders should monitor for signs of exhaustion, including weakening breadth, declining volume on advances, or failed breakout attempts. A short-term pullback or consolidation would be technically healthy and could provide more attractive entry points, particularly in sectors demonstrating relative strength such as Technology and Financials.
.
The US Markets
Friday’s U.S. Market Indexes
U.S. equities extended their rally with strong, broad-based gains across all major indexes, reinforcing the prevailing bullish trend. The Dow Jones Industrial Average surged 881.71 points (+1.79%) to close at 49,447.43, while the S&P 500 advanced 84.78 points (+1.20%) to 7,126.06. The Nasdaq Composite gained 365.78 points (+1.52%), finishing at 24,468.48, and the Russell 2000 outperformed with a 2.11% rise to 2,776.90.
The strength across large-cap, growth, and small-cap segments suggests a well-supported advance rather than a narrow, concentrated rally. Participation from the Russell 2000 is particularly notable, as it signals improving risk appetite and broader market confirmation.
The Nasdaq remains in a strong price discovery phase, continuing its record-setting trajectory. The index has now posted thirteen consecutive sessions of gains—its longest winning streak in over three decades—highlighting persistent institutional demand for growth assets. Importantly, today’s advance was accompanied by a 2% increase in trading volume, indicating that the rally continues to be supported by capital inflows rather than weakening participation.
Leadership remains firmly concentrated in technology and growth stocks, which continue to attract momentum-driven buying. This sustained leadership profile suggests that investors are still positioning for earnings growth and are willing to pay a premium for high-quality, high-growth names.
Analytical View:
While the trend remains decisively bullish, the length and consistency of the Nasdaq’s advance raise the probability of a near-term consolidation or pullback. Extended winning streaks, particularly those supported by rising volume, often precede short-term overbought conditions. Traders should watch for signs of momentum fatigue, including slowing price acceleration, negative divergences, or a contraction in market breadth.

Friday’s U.S. Market Statistics
New York Stock Exchange (NYSE): Market breadth strengthened significantly, with advancing issues overwhelmingly outpacing decliners. A total of 3,601 stocks advanced versus 890 declines, with 321 unchanged, resulting in a robust advancer-to-decliner ratio of 4.04 to 1. This level of breadth reflects strong and expanding participation, reinforcing the durability of the current rally.
New 52-week highs surged to 622, up sharply from 351 in the previous session, while new lows remained contained at 45 (vs. 40 previously). The expansion in new highs, alongside stable lows, signals accelerating upside momentum and confirms bullish price action across a wide range of sectors.
Trading volume rose meaningfully, with 6.21 billion shares exchanged—an 18% increase from the prior session. Rising volume alongside strong breadth is a constructive signal, suggesting institutional accumulation rather than retail-driven activity.
NASDAQ: Breadth remained firmly positive, with 3,685 advancing issues compared to 1,183 decliners, and 321 unchanged—producing an advancer-to-decliner ratio of 3.11 to 1. While slightly less expansive than the NYSE, this still reflects solid participation within a growth-heavy index.
New 52-week highs climbed to 522 from 285 in the prior session, while new lows declined to 56 from 64. This improvement indicates continued strength in growth and momentum names, with fewer stocks breaking down even as the market extends higher.
NASDAQ volume totaled 10.35 billion shares, a modest 1% increase from Thursday. While volume growth was less pronounced than on the NYSE, it remains supportive of the ongoing uptrend, particularly given the index’s extended winning streak.
Analytical Takeaway:
The combination of strong breadth, expanding new highs, and rising (or stable) volume across both exchanges confirms that the rally is broad-based and institutionally supported. This reduces the likelihood of an immediate reversal but increases the probability of a near-term consolidation phase, especially in extended segments of the market such as high-growth technology stocks.
U.S. Market Wrap-Up Report
The Nasdaq’s extended rally remains the defining feature of the current market environment. The index has now advanced for thirteen consecutive sessions—its longest winning streak in over three decades—underscoring powerful momentum and sustained institutional demand for growth assets. This strength is not occurring in isolation but is part of a broader North American equity advance, increasingly driven by expectations of easing geopolitical tensions.
For the week, performance across major U.S. indexes was notably strong: the Dow Jones Industrial Average gained 3.7%, the S&P 500 rose approximately 4.5%, and the Nasdaq Composite led with a 6.6% advance. Month-to-date, momentum has accelerated further, with the Nasdaq posting double-digit gains and the S&P 500 advancing more than 8% in just over two weeks. While this rapid ascent reflects strong bullish conviction, it also raises the likelihood of near-term overbought conditions.
The Canadian market is confirming this broader trend. The TSX has advanced in thirteen consecutive sessions and is now trading just below its all-time high of 34,544 reached on March 1. This alignment between U.S. and Canadian equities strengthens the case for a coordinated North American rally, supported by improving sentiment and capital flows.
Sector Rotation and Leadership
Sector performance continues to highlight a clear rotation toward growth and cyclical leadership. In the U.S., nine of eleven sectors closed higher, led by Consumer Discretionary (+2.06%), Industrials (+1.66%), Technology (+1.51%), and Healthcare (+1.51%). Energy (-3.23%) was a notable laggard, while Utilities (+0.02%) showed relative weakness.
On a weekly basis, Technology (+7.03%) maintained leadership, followed by Consumer Discretionary (+3.93%), Financials (+1.85%), and Communication Services (+1.30%). In contrast, Energy (-0.69%), Utilities (-0.81%), and Consumer Discretionary ex-durables (-2.01%) underperformed, reinforcing the ongoing shift away from defensive and commodity-linked sectors.
The decline in energy stocks is closely tied to falling oil prices, which have been reacting quickly to developments around geopolitical tensions. As expectations for stabilization improve, capital is rotating out of energy and into sectors with stronger earnings visibility—particularly technology and financials. However, this rotation remains highly sensitive to geopolitical headlines and could reverse quickly if conditions change.
Stock-Specific and Macro Catalysts
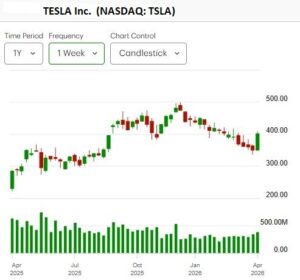
Among individual names, Tesla Inc. gained 3.01% to close at $400.62 on heavy volume (90.6 million shares), breaking an eight-week losing streak. The move appears partly driven by reports of a potential product launch in India, as well as renewed momentum in high-beta growth stocks.
Looking ahead, attention is shifting to the upcoming earnings cycle, particularly among mega-cap technology leaders. Companies such as Alphabet Inc., Meta Platforms, Microsoft, and Apple Inc. are set to report next week. Their results will be critical in determining whether current valuations and momentum in the technology sector are justified.
Analytical Outlook
The prevailing trend across North American markets remains decisively bullish, supported by strong breadth, sector rotation into growth, and rising investor confidence. However, the combination of extended price advances, elevated short-term returns, and concentrated leadership in technology suggests that markets are approaching a potential inflection point.
Traders should remain disciplined, monitoring for signs of exhaustion such as weakening breadth, divergence in leadership, or failure to sustain breakouts. A short-term pullback or consolidation would be technically constructive and could offer more favorable entry points—particularly in sectors demonstrating relative strength.
At the same time, geopolitical developments and upcoming earnings releases represent key catalysts that could either sustain the rally or trigger volatility. In this environment, active risk management and adherence to trading rules remain essential.
.
Weekend Feature Article
🔒 Premium Content
You must be a subscriber to access the remaining parts of this section. Current subscription rate is $60 CAD for a year
Login or Subscribe
NOTICE TO READERS
When you are ready to start the journey to Take Charge and Put Your Destiny In Your Own Hands, read The Canadian Vanguard every market day. If you need more related information, Contact Us
Our readers are strongly advised to conduct their own research into individual stocks before making a purchase decision. In addition, investors are advised that past stock performance is no guarantee of future price appreciation. Any recommendation is not a guarantee of any particular stock’s future prices, and The Canadian Vanguard accepts no responsibility or liability for investors’ or readers’ purchases.
Stocks In The News/ Stocks To Watch and Market Strategy will soon be available but only to Paying Subscribers. The dollar sign “$” in the Toronto Market section in the articles only stands for Canadian dollar and in the US market section “$” stands for US dollar.
(c) This article is published by The Canadian Vanguard on April 17, 2026