

Risk-Off Intensifies as Oil Prices Spike, Pressuring Global Equities
The Canadian Vanguard Stock Market Report Tuesday April 28, 2026 Edition
.
The Toronto Market
Wednesday’s Toronto Market Index
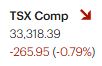
The Toronto S&P/TSX Composite Index fell 265.95 points, or 0.79%, to close at 33,318.39. The index opened below the previous session’s close and trended downward throughout the day, finishing near its intraday low. In total, it shed roughly 265 points.
The day’s decline was not primarily driven by economic fundamentals. Instead, investor sentiment was weighed down by geopolitical tensions in the Middle East, which influenced market behavior despite occurring far from domestic markets.


![]()
Wednesday’s TSX Market Statistics
On the TSX, declining issues outnumbered advancing issues by a wide margin. There were 1,573 decliners compared to 635 advancers, resulting in a decliner-to-advancer ratio of 2.47:1—approximately five decliners for every two advancers. An additional 116 issues remained unchanged.
The exchange recorded 85 new 52-week highs and 46 new 52-week lows, compared with 73 highs and 15 lows in the previous session.
Total trading volume reached 488,685,758 shares, a marginal increase of 0.08% from the 484,744,687 shares traded the day before.
North American equity markets were broadly lower, pressured by rising oil prices—driven by developments related to tensions between the U.S. and Iran—which climbed above US$100 per barrel. Market breadth remained firmly negative, with conditions deteriorating further compared to the previous session. Markets have trended downward since the start of the week, largely reacting to ongoing geopolitical tensions in the Middle East rather than underlying economic fundamentals.
Wednesday’s Toronto Market Wrap-Up Report
The TSX Composite Index extended its losing streak to five consecutive sessions, with the latest two declines notably sharper than the earlier pullback. Price action continues to reflect a weak technical structure, as the index trends lower with little evidence of sustained buying support. Momentum indicators remain negative, and the absence of strong rebounds suggests sellers are still in control in the near term.
From a technical perspective, the index appears to be testing short-term support levels, and a decisive break below recent lows could open the door to further downside. Market breadth reinforces this bearish tone, with persistent weakness across a majority of stocks—an indication that the decline is broad-based rather than isolated. Until the index can reclaim key resistance levels and show improving breadth, rallies may continue to be viewed as selling opportunities by active traders.
Sector performance was largely negative, with only two of the ten major sectors finishing higher. Energy led the market, gaining 2.01%, supported by strength in crude oil prices. Telecommunications Services edged up 0.04%. On the downside, Financials fell 1.08%, Utilities declined 1.09%, and Basic Materials dropped 2.30%, making it the weakest-performing sector. Technology also remained under pressure, slipping 1.00%.
In company-specific activity, Celestica Inc. (CLS) rebounded modestly after the previous session’s decline, rising 4.45% to close at $515.17 on volume of 560K shares. Despite the bounce, the stock remains volatile, and traders will be watching for confirmation of a sustained reversal versus a short-term technical rebound.
Canadian Natural Resources (CNQ) continued its recovery trend, advancing 1.88% to close at $64.63 with approximately 6 million shares traded. The stock is benefiting from strength in the energy complex and is attempting to re-establish an upward trajectory.
Suncor Energy Inc. (SU) gained 3.01%, closing at $91.81 on volume of 2.4 million shares. The move reflects ongoing momentum in oil-linked equities, with traders closely monitoring whether the sector can maintain leadership if crude prices remain elevated.
Overall, the market remains in a short-term downtrend, with risk sentiment driven more by external geopolitical developments than by domestic fundamentals. For traders, the focus remains on key support levels, sector rotation into energy, and confirmation signals before positioning for any sustained reversal.
.
The US Markets
Wednesday’s U.S. Market Indexes
The Dow Jones Industrial Average declined 280.81 points, or 0.57%, to close at 49,861.81, reflecting continued weakness in large-cap industrial and energy-sensitive names. The S&P 500 edged lower by 2.85 points, or 0.04%, finishing at 7,135.95, while the Nasdaq Composite managed a marginal gain of 9.44 points, or 0.04%, to end at 24,673.24. The Russell 2000 Index fell 16.58 points, or 0.60%, closing at 2,739.47.
Rising oil prices remained the dominant macro driver, as geopolitical tensions in the Middle East pushed crude sharply higher earlier in the session. Elevated energy costs continue to pressure broader market sentiment, particularly for sectors sensitive to input costs and global trade flows.
From a market dynamics standpoint, divergence across indices remains notable. Large-cap stocks, as reflected in the Dow, faced sustained selling pressure, consistent with historical sensitivity to rising energy prices. Small-cap equities also underperformed, with the Russell 2000 showing relative weakness as higher oil prices weigh on growth expectations and financing conditions.
In contrast, technology and growth-oriented stocks demonstrated relative resilience. The Nasdaq Composite managed to stay in positive territory, supported by continued interest in mega-cap and momentum-driven names, although gains were modest and lacked strong conviction.
Technically, the broader market continues to show signs of fragility. The Dow, S&P 500, and Russell 2000 all closed in negative territory for a second consecutive session, reinforcing the short-term bearish bias. Market participants are closely watching whether this divergence—between defensive weakness and selective strength in tech—resolves through broader downside continuation or rotation into growth leadership.

Wednesday’s U.S. Market Statistics
On the New York Stock Exchange (NYSE), declining issues decisively outpaced advancing issues, underscoring broad-based selling pressure. There were 3,143 decliners compared to 1,243 advancers, with 335 issues unchanged. This resulted in a decliner-to-advancer ratio of 2.53:1—roughly five decliners for every two advancers.
The NYSE recorded 187 new 52-week highs and 84 new 52-week lows, compared with 179 highs and 42 lows in the previous session—indicating an expansion in new lows despite a modest increase in highs.
Total trading volume on the NYSE rose to 5,220,285,869 shares, an increase of nearly 4% from the prior session’s 4,998,608,995 shares. The uptick in volume alongside declining prices points to strengthening distribution activity.
On the NASDAQ, market breadth was also negative, though slightly less severe than the NYSE. Declining stocks totaled 3,414, while advancing issues came in at 1,497, with 284 unchanged—producing a decliner-to-advancer ratio of 2.28:1 (approximately eleven decliners for every five advancers).
The NASDAQ posted 127 new 52-week highs and 155 new 52-week lows, compared with 132 highs and 119 lows in the prior session. The shift toward more new lows signals underlying weakness beneath the surface, despite relative resilience in headline index performance.
Total NASDAQ trading volume reached 8,440,289,424 shares, up 9.5% from 7,710,078,092 shares traded yesterday. The higher volume, coupled with negative breadth, suggests increased selling pressure, particularly outside of large-cap technology names.
From a technical standpoint, both exchanges reflect deteriorating market internals. Expanding new lows and rising volume on down days are typical characteristics of a market under distribution, reinforcing the current short-term bearish bias despite pockets of strength in select sectors.
U.S. Market Wrap-Up Report – Wednesday
U.S. equities closed mixed, with the Dow Jones Industrial Average and S&P 500 finishing lower, while the Nasdaq Composite managed to hold a marginal gain. The session reflected ongoing divergence between growth-oriented technology stocks and broader market weakness.
Crude oil prices surged to approximately $110 per barrel during the session, driven by geopolitical tensions, while the U.S. 10-year Treasury yield rose by seven basis points. The combination of rising energy costs and higher yields continues to pressure valuation multiples and raises concerns about persistent inflation.
Comments from Jerome Powell following the latest Federal Reserve meeting reinforced a cautious policy stance. The Fed held rates steady, signaling concern over inflation risks linked to higher oil prices. Market expectations have now largely shifted away from any meaningful rate cuts in the near term.
Sector performance reflected this macro backdrop. Energy led with a gain of 2.15%, followed by modest strength in Communication Services (+0.35%) and Technology (+0.26%). On the downside, defensive and rate-sensitive sectors lagged, with Healthcare down 0.93%, Financials off 1.04%, Utilities declining 1.56%, and Basic Materials falling 1.70%.
In company-specific developments, storage and semiconductor names showed notable strength. Seagate Technology Holdings plc surged 11.10% following a strong earnings report, closing at $643.30 on heavy volume. SanDisk Corporation gained 6.17% to close at $1,064.21, while Western Digital Corporation rose 5.57% to $412.76.
Optical networking stocks rebounded after prior weakness. Lumentum Holdings Inc. advanced 8.46% to $858.32, and Applied Optoelectronics Inc. climbed 11.34% to $152.83.
Within semiconductors, Advanced Micro Devices gained 4.30% to close at $337.11, while Astera Labs Inc. rose 7.39% to $196.85, reflecting continued investor interest in high-growth chip names.
Outside the technology sector, The Vita Coco Company Inc. delivered a standout performance, surging 29.67% to $66.95 on strong momentum and volume.
From a technical standpoint, the broader market remains under pressure. The Dow and S&P 500 continue to trend lower, with price action confirming a short-term downtrend characterized by lower highs and weak rebounds. Market breadth remains negative, and rising yields combined with elevated oil prices are acting as headwinds. The Nasdaq’s relative resilience highlights ongoing rotation into growth, but the narrow leadership suggests limited overall market strength.
Trader Setups & Key Levels
1. Index-Level Setups
- S&P 500: Watch for support near recent swing lows. A confirmed break below support could trigger downside continuation. Resistance remains near recent breakdown levels—any bounce into that zone may face selling pressure.
- Dow Jones: weakness suggests a sell-on-rallies environment. Traders may look for failed bounces into resistance as short opportunities.
- Nasdaq Composite: The index is ցaining relative strength. A sustained hold above recent support could attract momentum buyers, but failure would likely align it with broader market weakness.
2. Sector Rotation
- Energy: This sector continues to lead. Pullbacks toward short-term support may present continuation setups if oil remains elevated.
- Technology/Semiconductors: Selective strength persists. Focus on leaders showing strong relative strength and volume confirmation.
- Financials & Utilities: Remain calm and focused. Avoid or consider short setups on weak rallies given sensitivity to rates.
3. Stock-Specific Ideas
- Momentum Continuation: Names like Seagate and Applied Optoelectronics may offer continuation setups if they hold above breakout levels on strong volume.
- Earnings-Driven Plays: Stocks with strong post-earnings gaps should be monitored for consolidation patterns (flags/pullbacks) rather than chasing extended moves.
- Mean Reversion Risks: Extended movers (e.g., Vita Coco) may experience volatility—wait for structured pullbacks before considering entries.
4. Risk Factors to Monitor
- Oil price trajectory (sustained move above $110 could pressure equities further)
- U.S. Treasury yields (continued rise may weigh on valuations)
- Geopolitical developments influencing energy markets
.
NOTICE TO READERS
The Canadian Vanguard Stock Market is about empowering you to build and manage your wealth by yourself. There is certainly no magic in managing finances or wealth but one needs to know what to do and commit to doing what is needed. When you are ready to start the journey to Take Charge and Put Your Destiny In Your Own Hands, read The Canadian Vanguard every market day. If you need more related information, Contact Us
Our readers are strongly advised to conduct their own research into individual stocks before making a purchase decision. In addition, investors are advised that past stock performance is no guarantee of future price appreciation. Any recommendation is not a guarantee of any particular stock’s future prices, and The Canadian Vanguard accepts no responsibility or liability for investors’ or readers’ purchases.
Stocks In The News/ Stocks To Watch and Market Strategy will soon be available but only to Paying Subscribers. The dollar sign “$” in the Toronto Market section in the articles only stands for Canadian dollar and in the US market section “$” stands for US dollar.
(c) This article is published by The Canadian Vanguard on April 29, 2026