

Markets Slide as AI Infrastructure Funding Concerns Re-emerge
The Canadian Vanguard Stock Market Report Tuesday April 28, 2026 Edition
.
The Toronto Market
Tuesday’s Toronto Market Index
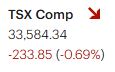
The S&P/TSX Composite Index fell 233.85 points (-0.69%) to close at 33,584.34. The index opened lower but briefly climbed above its opening level before dropping roughly 200 points—all within the first ninety minutes of trading.
From that point through to the close, the index largely oscillated around the 33,600 level. The magnitude of these fluctuations falls within what can be considered normal market variation, often referred to by traders as “market noise.”
![]()
Tuesday’s TSX Market Statistics
On the TSX, declining issues outnumbered advancing issues. There were 1,288 decliners versus 804 advancers, resulting in a decliner-to-advancer ratio of 1.60:1—approximately three decliners for every two advancers. An additional 136 issues closed unchanged.
The exchange recorded 73 new 52-week highs and 15 new 52-week lows, compared with 142 new highs and 16 new lows in the previous session.
Total trading volume reached 484,744,687 shares, representing a 2.5% decrease from the 497,379,855 shares traded yesterday.
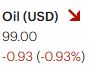
The Toronto market continues to be influenced by developments related to the US–Iran tensions, particularly through their impact on oil prices, which remain elevated relative to pre-conflict levels. However, there are signs that market volatility may be easing, potentially reflecting the effects of an extended ceasefire period announced by the U.S. administration.
Tuesday’s Toronto Market Wrap-Up Report
The S&P/TSX Composite Index has now declined for four consecutive sessions—a relatively uncommon occurrence in the current market cycle and the first such streak since mid-2025. Notably, the magnitude of losses has accelerated with each session: a modest -0.03% on Friday, followed by -0.25% yesterday, and a sharper -0.69% today. While this pattern does not yet confirm a structural downturn, the increasing pace of selling suggests a shift in short-term sentiment from consolidation toward risk reduction.
From a technical perspective, consecutive declines accompanied by expanding losses often point to weakening near-term momentum. However, the index continues to trade within a broader uptrend, and remains one of the stronger-performing global benchmarks year-to-date. For longer-term investors, this may still resemble a corrective phase rather than a trend reversal, whereas short-term traders may interpret it as a signal to tighten risk controls or look for tactical short opportunities.
Market breadth reinforced the underlying weakness. Decliners significantly outpaced advancers, and although new 52-week highs still exceeded lows, their sharp drop from the prior session indicates waning upside momentum. Volume also declined modestly, suggesting that while selling pressure is present, it is not yet accompanied by panic or capitulation—another sign of a controlled pullback rather than a disorderly selloff.
Sector performance reflected a defensive and commodity-driven tilt. Only four of ten major sectors finished higher. Energy led with a 1.86% gain, benefiting from elevated crude prices tied to ongoing US–Iran tensions. Utilities (+0.54%) and Financials (+0.13%) also posted gains, signaling a partial rotation into more defensive or income-oriented segments. Consumer Discretionary edged higher (+0.29%), though gains there remain tentative.
On the downside, growth-sensitive and cyclically exposed sectors bore the brunt of selling. Technology fell -1.00%, Industrials dropped -1.48%, and Basic Materials declined sharply by -3.75%. The weakness in Materials is particularly notable given its weight in the Canadian market and may reflect concerns over global growth expectations or profit-taking following prior strength.
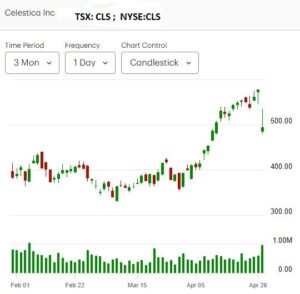
In company-specific developments, Celestica Inc. experienced a sharp pullback, declining 14.48% despite reporting strong earnings and forward guidance, with revenue reaching US$4.05 billion. The reaction suggests elevated expectations had already been priced in after the stock’s substantial rally—over 200% in the past year—and highlights a broader theme in the market: high-growth AI-linked names are increasingly vulnerable to “sell-the-news” reactions even on positive fundamentals. This dynamic introduces heightened volatility in the technology segment and underscores the importance of valuation discipline.
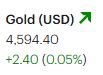
Conversely, Canadian Natural Resources Limited (CNQ) rebounded, resuming its upward trajectory following a period of consolidation after strong gains earlier in the year. Strength in energy equities continues to be underpinned by firm oil prices, which remain elevated relative to pre-conflict levels.
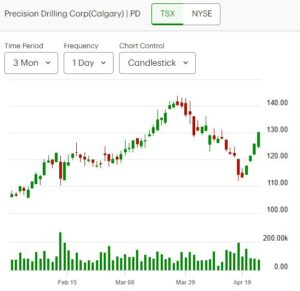
Precision Drilling Corporation (PD) also stands out as a stock to monitor. In the current environment, companies providing oilfield and infrastructure services may benefit not only from higher commodity prices but also from increased capital spending across the North American energy sector.
Market Interpretation & Outlook
For investors, the current environment appears to be transitioning from a momentum-driven rally to a more selective, fundamentals-sensitive phase. Elevated oil prices are providing support to energy-heavy indices like the TSX, partially offsetting weakness in growth and cyclical sectors.
For traders, the combination of declining breadth, sector rotation, and increased sensitivity to earnings outcomes suggests a market that may remain choppy in the near term. Opportunities are likely to be more tactical—favoring sector rotation strategies, short-term mean reversion trades, and careful monitoring of macro catalysts such as geopolitical developments and commodity price movements.
There are also early indications that volatility may begin to moderate, potentially reflecting the impact of an extended ceasefire period. If sustained, this could stabilize oil prices and reduce one of the key sources of recent market uncertainty. However, until clearer direction emerges, both investors and traders may benefit from maintaining a balanced approach—remaining engaged with strong sectors like energy while exercising caution in overstretched growth names.
.
The US Markets
Tuesday’s U.S. Market Indexes
The Dow Jones Industrial Average slipped 25.86 points (-0.05%) to close at 49,141.93. The S&P 500 declined 35.11 points (-0.49%) to finish at 7,138.80, while the Nasdaq Composite fell 223.30 points (-0.90%) to 24,663.80. The Russell 2000 underperformed, dropping 32.14 points (-1.15%) to close at 2,756.05.
Despite broad-based declines, large-cap stocks showed relative resilience. The Dow’s modest loss highlights a continued preference for established, blue-chip names, which tend to offer more stable earnings profiles during periods of uncertainty. In contrast, the sharper declines in the Nasdaq and Russell 2000 point to increased pressure on growth-oriented and small-cap stocks.
This divergence is significant. Weakness in small caps often signals tightening financial conditions or reduced risk appetite, as these companies are generally more sensitive to interest rates, credit availability, and domestic economic expectations. The Russell 2000’s pronounced decline suggests that investors are becoming more selective and may be rotating away from higher-risk segments of the market.
Meanwhile, the relatively mild pullback in the Dow suggests that capital is rotating into defensive large-cap equities. This type of internal rotation—away from high-beta growth and into stability—can occur even when broader indexes remain near elevated levels.
Importantly, while all major indexes closed lower, they continue to trade above key technical support levels. This indicates that, for now, the broader uptrend remains intact, though momentum appears to be weakening. If these support levels hold, the current move may represent a consolidation phase. However, a decisive break below them could trigger a more meaningful correction.

Tuesday’s U.S. Market Statistics
New York Stock Exchange (NYSE): Declining issues outnumbered advancing issues by a wide margin. There were 2,703 decliners compared with 1,629 advancers, along with 396 unchanged issues, resulting in a decliner-to-advancer ratio of 1.66:1—approximately five decliners for every three advancers.
The exchange recorded 179 new 52-week highs and 42 new 52-week lows, a notable decline in new highs from the 336 recorded in the previous session, while new lows remained relatively contained.
Total trading volume on the NYSE reached 4,998,608,995 shares, representing an increase of nearly 3% from the 4,866,276,606 shares traded yesterday. This rise in volume alongside negative breadth suggests moderately stronger conviction behind the day’s selling pressure.
NASDAQ: Market breadth was weaker on the Nasdaq, where declining stocks significantly outpaced advancing stocks. There were 3,076 decliners versus 1,714 advancers, with 357 issues unchanged, producing a decliner-to-advancer ratio of 1.79:1—close to two decliners for every advancer.
The exchange posted 132 new 52-week highs and 119 new 52-week lows. While new lows were unchanged from the prior session, new highs dropped sharply from 251, indicating a continued loss of upward momentum in growth-oriented names.
Total Nasdaq trading volume came in at 7,710,078,092 shares, down 7.5% from the previous session’s 8,326,963,246 shares. The decline in volume suggests that, despite broad weakness, selling pressure in the technology-heavy index was somewhat less aggressive than the prior day.
Market Interpretation:
Across both exchanges, the combination of negative breadth and a sharp drop in new highs points to a market experiencing internal weakening rather than outright liquidation. The increase in NYSE volume contrasts with the decline in Nasdaq volume, reinforcing the idea of sector rotation—away from growth and toward more defensive or value-oriented segments.
For investors and traders alike, these conditions typically signal a transition phase, where selectivity becomes more important and broad-based upside momentum is harder to sustain.
Tuesday’s U.S. Market Wrap-Up Report
U.S. equities traded broadly lower on Tuesday, reflecting renewed weakness in growth-oriented sectors and a noticeable shift in market sentiment. Concerns surrounding AI-driven demand—one of the primary engines of the recent rally—have resurfaced, placing pressure on technology stocks. In particular, uncertainty tied to OpenAI and its ability to sustain aggressive spending commitments has raised questions about the durability of the AI infrastructure buildout theme that has supported valuations across the sector.
The implication is significant: much of the recent upside in technology and semiconductor stocks has been predicated on sustained, large-scale investment in data centers and AI infrastructure. Any indication of slowing demand or capital expenditure risks triggering a repricing across the entire ecosystem.
Sector performance reflected a defensive rotation. Energy led with a 1.45% gain, supported by firm oil prices, while Consumer Discretionary rose 1.01%, Telecommunications Services gained 0.85%, and Financials edged up 0.13%. The remaining sectors closed in negative territory, led by Technology (-1.33%) and Basic Materials (-2.04%). The divergence highlights a market increasingly favoring value and defensive positioning over high-growth exposure.
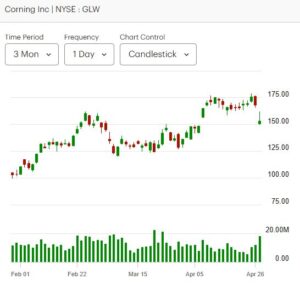
Technology stocks, particularly those tied to AI infrastructure, faced pronounced selling pressure. Companies linked to optical networking and data center buildouts declined sharply, including Corning Inc. (-8.9%), Lumentum Holdings Inc. (-7.9%), Applied Optoelectronics (-5.84%), and Coherent Corp. (-5.46%). Notably, Corning declined despite reporting better-than-expected earnings, reinforcing a “sell-the-news” dynamic that is becoming more prevalent in the sector.
Weakness extended across storage and semiconductor-related names. SanDisk fell 6.34%, Seagate Technology declined 2.82%, Western Digital dropped 2.43%, and Micron Technology lost 3.86%.
Among major chipmakers, Nvidia slipped 1.6% following a strong rally in the previous session, while Arm Holdings fell sharply by 7.98%, marking its second consecutive decline. Advanced Micro Devices dropped 3.4%, and Broadcom declined 4.4%.
The breadth of declines across the semiconductor and infrastructure ecosystem suggests that this is not an isolated pullback but rather a broader reassessment of AI-driven valuations.
Market Interpretation & Outlook
For investors, the current market environment signals a transition from momentum-driven gains toward a more valuation-sensitive phase. The AI theme remains structurally intact, but expectations had become elevated, leaving stocks vulnerable to even modest disappointments or shifts in forward guidance.
For traders, volatility within the technology sector may present short-term opportunities, particularly in the form of mean-reversion trades or relative weakness strategies. The divergence between energy strength and technology weakness also opens the door for sector rotation trades.
More broadly, the market appears to be entering a period of consolidation, characterized by narrowing leadership and increased sensitivity to earnings and macro developments. While the major indexes remain above key support levels, the internal weakness—particularly in growth and small-cap segments—suggests that caution is warranted in the near term.
.
NOTICE TO READERS
The Canadian Vanguard Stock Market is about empowering you to build and manage your wealth by yourself. There is certainly no magic in managing finances or wealth but one needs to know what to do and commit to doing what is needed. When you are ready to start the journey to Take Charge and Put Your Destiny In Your Own Hands, read The Canadian Vanguard every market day. If you need more related information, Contact Us
Our readers are strongly advised to conduct their own research into individual stocks before making a purchase decision. In addition, investors are advised that past stock performance is no guarantee of future price appreciation. Any recommendation is not a guarantee of any particular stock’s future prices, and The Canadian Vanguard accepts no responsibility or liability for investors’ or readers’ purchases.
Stocks In The News/ Stocks To Watch and Market Strategy will soon be available but only to Paying Subscribers. The dollar sign “$” in the Toronto Market section in the articles only stands for Canadian dollar and in the US market section “$” stands for US dollar.
(c) This article is published by The Canadian Vanguard on April 28, 2026