







Markets Wobble as Semiconductor Stocks Sell Off While Oil Prices Rise
The Canadian Vanguard Stock Market Report Tuesday July 7, 2026 Edition
.
The Toronto Market
Tuesday’s Toronto Market Commentary
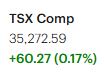
The S&P/TSX Composite Index advanced 60.27 points, or 0.17%, to close at 35,272.59, extending its streak of closes above the 35,000 level to three consecutive sessions. While the market finished higher, the session was characterized by subdued price action and limited directional conviction.
The index opened with an upside gap but encountered early selling pressure, retracing much of its initial gains during the first hour of trading. Buyers subsequently regained control, allowing the index to recover; however, upside momentum remained constrained, with the benchmark trading within approximately 100 points of the previous session’s close throughout the day. A late-afternoon pullback was met with renewed buying interest, enabling the index to finish near the upper end of its intraday range.
Market internals reflected a balanced trading environment, with neither buyers nor sellers establishing sustained control. The narrow trading range and relatively low volatility suggest that investors remain cautious despite the prevailing bullish trend. Although buying interest was sufficient to maintain positive territory, there was little evidence of the conviction needed to drive a meaningful breakout to new highs.
From a technical perspective, the intermediate- and long-term outlook remains constructive. The index continues to trade comfortably above its 25-day, 50-day, and 200-day moving averages, reinforcing the strength of the prevailing uptrend. Maintaining support above the psychologically important 35,000 level will be an important technical indicator in the coming sessions, while a decisive move above recent highs could provide the catalyst for the next leg higher.
Tuesday’s TSX Market Statistics
Market breadth on the TSX was negative despite the S&P/TSX Composite Index posting a modest gain. Declining issues outnumbered advancing issues by 1,352 to 898, resulting in a decliner-to-advancer ratio of 1.50:1, or approximately three declining stocks for every two advancing stocks. An additional 115 issues closed unchanged.
The exchange recorded 171 new 52-week highs and 38 new 52-week lows, compared with 184 new highs and 22 new lows in the previous session. While the number of new highs declined modestly and new lows increased, the overall leadership profile remains constructive, with new highs continuing to outnumber new lows by a wide margin.
Total trading volume reached 463.3 million shares, up approximately 5% from 440.1 million shares traded yesterday. Trading activity also returned to a level more consistent with recent norms, finishing close to the 50-day average daily volume.
Although the index closed higher, the negative market breadth indicates that gains were concentrated in a relatively small group of larger-cap stocks rather than broadly distributed across the market. This divergence warrants monitoring but is not yet a cause for concern, particularly given the still-favorable ratio of new highs to new lows. Unless weakening breadth persists over several consecutive sessions, today’s statistics are best viewed as a normal short-term variation within an otherwise constructive market environment.
.
Tuesday’s Toronto TSX Market Wrap-Up Report
The S&P/TSX Composite Index advanced 60.27 points (+0.17%) to close at 35,272.59, marking its third consecutive close above the 35,000 level. Although the benchmark index finished higher, trading was characterized by subdued price action and limited volatility. The index opened with an upside gap, weakened during the first hour, recovered through the middle of the session, and overcame a late-afternoon pullback to finish modestly higher.
Despite the positive close, underlying market breadth was negative. Declining issues outnumbered advancing issues by 1,352 to 898, a decliner-to-advancer ratio of 1.50:1, indicating that gains in the index were driven primarily by larger-cap stocks rather than broad market participation. Nevertheless, the exchange recorded 171 new 52-week highs versus 38 new 52-week lows, suggesting that the market’s longer-term technical backdrop remains constructive.
Sector performance was broadly positive, with eight of the ten major sectors closing higher and five sectors gaining more than 1%. Leadership rotated toward cyclical and growth-oriented sectors, while weakness in the materials complex limited the advance in the broader index.
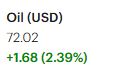
Energy led the market with a 2.72% gain, supported by rising crude oil prices following renewed geopolitical tensions in the Middle East. Telecommunication Services (+1.82%), Technology (+1.52%), Consumer Durables & Apparel (+1.23%), and Utilities (+1.04%) also posted strong gains, reflecting broad sector rotation. Financials, the largest weighting in the TSX Composite Index, added a modest 0.31%, providing additional support to the benchmark.
The principal drag on the market was Basic Materials, which declined 3.47%. Given the TSX’s significant exposure to mining companies, weakness in the materials sector offset much of the strength seen elsewhere and prevented the index from posting a stronger advance.
Within the financial sector, five of Canada’s six largest banks closed higher. Bank of Montreal (BMO) led the group with a 1.23% gain, while Bank of Nova Scotia was the lone decliner, easing 0.03%. Manulife Financial Corp. also slipped 0.03%, reflecting generally muted trading activity among insurance stocks.
Trading volume totaled 463.3 million shares, approximately 5% above the previous session and close to the 50-day average, indicating that market participation returned to more typical levels after lighter activity in recent sessions.
.
Key Takeaways for Traders and Investors
- Technical trend remains bullish. The TSX has now closed above the 35,000 level for three consecutive sessions and continues to trade comfortably above its 25-day, 50-day, and 200-day moving averages, reinforcing the prevailing intermediate- and long-term uptrend.
- Breadth warrants monitoring. While the index advanced, negative market breadth suggests that leadership was concentrated in a relatively small number of large-cap stocks. If this divergence persists over several sessions, it could signal weakening underlying market participation.
- Sector rotation remains active. Strength in Energy, Technology, Telecommunications, and Utilities more than offset weakness in Basic Materials. Traders should continue monitoring sector leadership, particularly if commodity prices remain volatile.
- Materials remain a key influence. The sharp decline in the Basic Materials sector highlights the importance of mining stocks to the TSX. Sustained weakness in metals and mining could continue to cap gains in the broader Canadian market despite strength in other sectors.
- Watch for a breakout. Today’s narrow trading range and subdued volatility suggest the market is consolidating recent gains. A decisive move above recent highs, supported by stronger market breadth and higher trading volume, would strengthen the case for another leg higher in the current bull trend.
.
The US Markets
Tuesday’s U.S. Market Indexes
U.S. equities retreated on Tuesday as broad-based selling pressure weighed on all four major benchmark indexes, with technology stocks leading the decline.
The Dow Jones Industrial Average fell 130.76 points (-0.25%) to close at 52,925.15. The S&P 500 declined 33.58 points (-0.45%) to 7,503.85, while the Nasdaq Composite dropped 302.47 points (-1.16%) to 25,818.69. The Russell 2000 Index, a benchmark for small-cap stocks, lost 27.05 points (-0.90%), ending the session at 2,982.49.

Technology stocks bore the brunt of the selling pressure, particularly semiconductor and chip-related companies, resulting in the Nasdaq Composite significantly underperforming the broader market. The Nasdaq traded in negative territory throughout the session, briefly rebounding from its intraday low before renewed selling pressure pushed the index back toward the day’s lows by the close.
From a technical perspective, the Nasdaq has now slipped below its 25-day moving average, indicating a loss of near-term momentum. However, the index continues to trade comfortably above both its 50-day and 200-day moving averages, suggesting that the intermediate- and long-term uptrend remains intact despite the recent pullback.
The Dow Jones Industrial Average also finished lower but largely reflected a period of consolidation following five consecutive advancing sessions. Relative to the other major indexes, the Dow continues to demonstrate notable strength and remains comfortably above its 25-day, 50-day, and 200-day moving averages, preserving its constructive technical outlook.
The S&P 500 closed just above the psychologically important 7,500 level, finishing only a few points above that threshold. Although the index posted a modest decline, it continues to hold above key technical support levels and remains above its major moving averages. As long as these support levels continue to hold, the broader bullish trend remains intact.
Overall, Tuesday’s session appeared to be driven more by sector rotation and profit-taking within technology than by a broad deterioration in market sentiment. While short-term momentum weakened, particularly in growth stocks, the primary technical trends across the major U.S. indexes remain positive.
.
Tuesday’s U.S. Market Statistics
New York Stock Exchange (NYSE): Market breadth on the New York Stock Exchange was negative, reflecting broad-based selling pressure across the market. Declining issues outnumbered advancing issues by 2,838 to 1,732, resulting in a decliner-to-advancer ratio of 1.64:1, or roughly three declining stocks for every two advancing stocks. An additional 449 issues closed unchanged.
The NYSE recorded 272 new 52-week highs and 125 new 52-week lows, compared with 302 new highs and 76 new lows in the previous session. Although new highs continued to exceed new lows by more than two to one, market leadership weakened modestly as new highs declined and new lows increased.
Total trading volume reached 5.17 billion shares, little changed from 5.13 billion shares traded in the previous session. The combination of negative market breadth and steady trading volume suggests that selling pressure was broad-based rather than driven by unusually heavy institutional activity.
Overall, the NYSE statistics indicate that Tuesday’s weakness extended beyond the major indexes, with declining stocks clearly outnumbering advancing issues. However, the relatively healthy margin between new 52-week highs and new lows suggests that the market’s longer-term technical backdrop remains constructive despite the day’s pullback.
Nasdaq Market Statistics: Selling pressure was even more pronounced on the Nasdaq, where declining issues outnumbered advancing issues by 3,326 to 1,606, producing a decliner-to-advancer ratio of 2.07:1. In other words, more than two stocks declined for every advancing stock. An additional 335 issues finished unchanged.
The exchange recorded 207 new 52-week highs and 155 new 52-week lows, compared with 233 new highs and 115 new lows in the previous session. While new highs continued to outnumber new lows, the narrowing spread reflects weakening market leadership, particularly among growth and technology stocks.
Trading volume totaled 8.49 billion shares, approximately 4% higher than the previous session’s 8.16 billion shares. The combination of higher volume and a lower Nasdaq Composite Index suggests that selling conviction strengthened during the session, particularly in semiconductor and other technology-related shares that led the market lower.
Taken together, Tuesday’s Nasdaq statistics point to a broad-based risk-off session. Negative market breadth, rising trading volume, and increased new lows indicate that selling pressure was widespread rather than confined to a handful of large-cap stocks. Even so, new 52-week highs continue to exceed new lows, indicating that the longer-term uptrend has not yet been materially compromised.
Technical Perspective
Both the NYSE and Nasdaq experienced negative market breadth, confirming that Tuesday’s decline was broad-based rather than isolated to a few sectors. However, neither exchange showed a significant deterioration in longer-term market leadership, as new 52-week highs continued to outnumber new lows by a comfortable margin.
For traders and investors, the key development to monitor is whether negative breadth persists over several sessions. If declining issues continue to dominate while new lows expand and trading volume remains elevated, it would suggest that the current pullback is evolving into a broader correction. Conversely, an improvement in market breadth accompanied by renewed leadership in technology and growth stocks would reinforce the view that Tuesday’s weakness was a normal pause within an ongoing bullish trend.
Tuesday’s U.S. Market Wrap-Up Report
U.S. equities retreated on Tuesday as broad-based selling pressure weighed on all four major market indexes, with technology and semiconductor stocks leading the decline. The Dow Jones Industrial Average slipped 0.25%, the S&P 500 fell 0.45%, the Nasdaq Composite dropped 1.16%, and the Russell 2000 declined 0.90%.
The weakness was concentrated in the technology sector, particularly chip and semiconductor stocks, following disappointing guidance from Samsung Electronics, which raised concerns about near-term demand in the memory-chip industry. Investors responded by reducing exposure to semiconductor shares, resulting in another volatile trading session for the group.
Market internals confirmed that the selling extended well beyond the major indexes. On the New York Stock Exchange, declining issues outnumbered advancing issues by 1.64:1, while the Nasdaq recorded an even weaker 2.07:1 decliner-to-advancer ratio. Although both exchanges continued to report substantially more new 52-week highs than new lows, market participation weakened compared with the previous session, suggesting a modest deterioration in short-term market breadth rather than a breakdown in the broader bullish trend.
Sector performance reflected a clear rotation toward defensive and commodity-related areas of the market. Only four of the ten major sectors finished higher, although each posted gains exceeding 1%. Energy led the advance with a 2.96% gain as higher crude oil prices, driven by renewed geopolitical tensions in the Middle East, supported oil and gas producers. Health Care gained 1.39%, while Consumer Durables & Apparel (+1.05%) and Telecommunication Services (+1.04%) also outperformed.
The remaining sectors closed lower. Technology declined 1.34%, pressured by widespread weakness in semiconductor stocks. Basic Materials fell 2.09%, while Industrials led the declines with a 2.75% loss. Financials edged lower by 0.30% as investors rotated away from economically sensitive sectors.
Health care was one of the day’s strongest-performing sectors. AnaptysBio Inc. (NASDAQ: ANAB) climbed 8.04% on trading volume of approximately 947,000 shares, while Kiniksa Pharmaceuticals Ltd. (NASDAQ: KNSA) advanced 7.21%, reflecting continued investor interest in biotechnology stocks.
Semiconductor stocks experienced another sharp reversal after Monday’s strong rebound. Advanced Micro Devices (AMD), which gained 6.61% on Monday, surrendered those gains with a 6.51% decline on Tuesday. Astera Labs (ALAB) followed a similar pattern, reversing Monday’s 6.48% advance with an 11.52% decline while trading volume increased significantly, indicating elevated selling pressure. Other semiconductor names, including Micron Technology and Sandisk, also came under pressure as investors continued to reduce exposure to the group.
From a technical perspective, the Nasdaq Composite closed below its 25-day moving average, signaling weaker near-term momentum. However, the index remains comfortably above both its 50-day and 200-day moving averages, indicating that the intermediate- and long-term uptrend remains intact. The Dow Jones Industrial Average continues to display relative strength following its recent advance, while the S&P 500 successfully held above the psychologically important 7,500 level.
.
Key Takeaways for Traders and Investors
- Technology remains under pressure. Semiconductor stocks continue to experience elevated volatility, and traders should expect larger-than-normal price swings until buying momentum returns and the Nasdaq establishes a confirmed technical reversal.
- Market breadth weakened. Negative breadth on both the NYSE and Nasdaq confirms that Tuesday’s weakness was broad-based. However, new 52-week highs continue to outnumber new lows, indicating that the longer-term bull market remains intact.
- Sector rotation continues. Capital flowed into Energy and Health Care while investors reduced exposure to Technology, Industrials, and Basic Materials. Monitoring sector rotation remains critical in the current environment.
- Watch key technical levels. The Nasdaq’s move below its 25-day moving average weakens short-term momentum, but the primary uptrend remains positive as long as the major indexes continue to hold above their 50-day and 200-day moving averages. A recovery in the semiconductor sector would likely be an important catalyst for renewed market strength.
- Exercise patience with semiconductor stocks. Many leading chip stocks have become increasingly volatile over the past two sessions. Long-term investors may find opportunities if the sector stabilizes, but traders should wait for evidence of institutional buying and a confirmed reversal before increasing exposure.
.
NOTICE TO READERS
The Canadian Vanguard Stock Market is about empowering you to build and manage your wealth by yourself. There is certainly no magic in managing finances or wealth but one needs to know what to do and commit to doing what is needed. When you are ready to start the journey to Take Charge and Put Your Destiny In Your Own Hands, start with reading The Canadian Vanguard every market day. If and when you need more related information or to advertise your business products or services in The Canadian Vanguard, Contact Us
Our readers are strongly advised to conduct their own research into individual stocks before making a purchase decision. In addition, investors are advised that past stock performance is no guarantee of future price appreciation. Any recommendation is not a guarantee of any particular stock’s future prices, and The Canadian Vanguard accepts no responsibility or liability for investors’ or readers’ purchases.
Stocks In The News/ Stocks To Watch and Market Strategy will soon be available only to Paying Subscribers. The dollar sign “$” in the Toronto Market section in the articles only stands for Canadian dollar and in the US market section “$” stands for US dollar.
(c) This article is published by The Canadian Vanguard on July 7, 2026



