







Nasdaq Advances on Chip Rally as Dow Retreats and Small-Caps Remain Under Pressure.
The Canadian Vanguard Stock Market Report Wednesday July 8, 2026 Edition
.
The Toronto Market
Wednesday’s Toronto Market Index
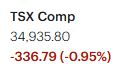
The S&P/TSX Composite Index declined 336.79 points, or 0.95%, on Wednesday to close at 34,935.80, slipping back below the 35,000 mark. Despite the broad-based weakness, the index finished approximately 60 points above its intraday low, indicating some buying interest late in the session.
Trading was relatively subdued, with modest intraday volatility and little evidence of sustained buying momentum. Early recovery attempts faded as investors remained cautious, leaving the index under pressure for most of the day.
From a technical perspective, the TSX remains in a constructive longer-term uptrend, continuing to trade comfortably above both its 50-day and 200-day moving averages. However, Wednesday’s decline leaves the index resting on its 25-day moving average—a level that could provide near-term support. A decisive break below this level would likely increase the probability of additional consolidation in the days ahead, while a successful hold could help restore positive momentum.

Wednesday’s TSX Market Statistics
At the TSX, the declining issues (decliners) outnumbered the advancing issues (advancers). Specifically, there were 1,600 decliners and 642 advancers producing a real decliner-to-advancer ratio of 2.50 to 1, or five decliners for every two advancers, with 127 issues unchanged.
The exchange posted 49 new 52-week highs and 51 new 52-week lows, compared with 171 new 52-week highs and 38 new 52-week lows recorded yesterday.
The total trading volume of shares traded on the TSX reached 437,421,183 shares, or 6% lower than 463,281,931 shares traded yesterday.
The TSX index declined almost 1% and the market remained negative from yesterday. The market breadth was actually more negative today compared to yesterday. The number of 52-week highs decreased substantially from yesterday but the number of the 52-week lows increased. Internally, the market was more negative today but the volume of shares traded was lower today. There was no evidence of panic selling. It looks more like investors, especially the institutions were simply taking advantage of the pullback to take profit. We shall have to wait a few more sessions to confirm.
.
The US Market Markets
Wednesday’s U.S. Market Indexes
U.S. equities delivered a mixed performance on Wednesday. The Dow Jones Industrial Average declined 576.76 points (-1.09%) to 52,348.39, while the S&P 500 lost 21.14 points (-0.28%) to finish at 7,482.71. In contrast, the Nasdaq Composite gained 51.96 points (+0.20%) to close at 25,870.71, snapping a two-session losing streak. The Russell 2000 Index fell 26.10 points (-0.88%) to 2,956.39.

The divergence among the major indexes reflected continued sector rotation, with technology shares—particularly semiconductors—recovering part of their recent losses. The Nasdaq opened lower but attracted steady buying around midday, extending its advance through the closing bell. The rebound suggests investors remained willing to add exposure to growth-oriented stocks following the recent pullback.
Investor sentiment remained cautious, however, amid renewed geopolitical concerns after U.S. officials indicated that the current truce with Iran had come to an end, raising the possibility of renewed tensions in the region. While these developments weighed on the broader market, the technology sector demonstrated relative resilience.
From a technical perspective, the Nasdaq has slipped back below its 25-day moving average, although it continues to trade comfortably above both its 50-day and 200-day moving averages, indicating that its intermediate- and longer-term uptrends remain intact. Meanwhile, the Dow Jones Industrial Average recorded its second consecutive decline but continues to trade well above its 25-day, 50-day, and 200-day moving averages, suggesting that the broader bullish trend remains intact despite the recent pullback.
.
Wednesday’s U.S. Market Statistics
New York Stock Exchange (NYSE): Market internals weakened considerably on Wednesday as declining issues outpaced advancing issues by a wide margin. The NYSE recorded 3,252 decliners versus 1,287 advancers, with 437 issues unchanged, producing a decliner-to-advancer ratio of 2.52:1.
The exchange posted 78 new 52-week highs and 176 new 52-week lows, compared with 272 new highs and 125 new lows in the previous session. This represents a sharp deterioration in market leadership, as the new highs/new lows ratio reversed from 2.17:1 on Tuesday to 0.44:1 on Wednesday.
NYSE trading volume totaled 5.26 billion shares, up 2% from 5.17 billion shares traded in the previous session. The combination of broad-based selling, rising new lows, and slightly higher volume indicates that selling pressure became more widespread during the session. Most of the weakness occurred during the morning hours, although selling moderated later in the day, particularly among large-cap stocks.
NASDAQ: NASDAQ market breadth also remained negative, with 3,279 declining issues compared with 1,640 advancing issues, resulting in a decliner-to-advancer ratio of 2.00:1. An additional 384 issues closed unchanged.
The exchange recorded 71 new 52-week highs and 217 new 52-week lows, compared with 207 new highs and 155 new lows on Tuesday. Consequently, the new highs/new lows ratio deteriorated from 1.33:1 in the previous session to 0.33:1, reflecting a significant weakening in underlying market participation despite the Nasdaq Composite’s gain.
NASDAQ trading volume totaled 8.16 billion shares, down 4% from 8.49 billion shares in the previous session. Although the Nasdaq Composite finished higher, market internals painted a much less constructive picture. Selling pressure was concentrated during the first half of the trading session before buyers returned later in the day, allowing the index to recover and close in positive territory.
Market Perspective
While the major indexes delivered mixed results, underlying market breadth deteriorated across both exchanges. The sharp decline in the number of new 52-week highs, combined with a meaningful increase in new lows, suggests that participation narrowed considerably beneath the surface. Although the Nasdaq Composite managed to post a modest gain, internal market statistics indicate that weakness remained widespread, highlighting a divergence between headline index performance and overall market participation. Traders should continue monitoring market breadth, new highs versus new lows, and trading volume over the coming sessions to determine whether Wednesday’s deterioration proves temporary or signals a broader loss of market momentum.
.
Wednesday’s U.S. Market Wrap-Up Report
U.S. equities delivered a mixed performance on Wednesday as investors balanced renewed geopolitical concerns against continued buying in select technology stocks. While the Dow Jones Industrial Average fell 1.09% and the S&P 500 declined 0.28%, the Nasdaq Composite advanced 0.20%, snapping a two-session losing streak. The Russell 2000 Index lost 0.88%, reflecting continued weakness in the broader market.
Market participation was considerably weaker than the headline indexes suggested. Both the NYSE and NASDAQ recorded roughly two declining stocks for every advancing stock, while the number of new 52-week highs fell sharply and new 52-week lows increased on both exchanges. This deterioration in market breadth indicates that Wednesday’s gains were concentrated in a relatively small group of stocks rather than being broadly based.
Sector Performance
Only two of the eleven S&P sectors finished higher.
- Energy: +1.72%
- Technology: +0.76%
The weakest-performing sectors were:
- Basic Materials: -2.28%
- Financials: -1.69%
The sector performance reflects continued rotation into selected growth and technology stocks while economically sensitive sectors remained under pressure.
.
Technology and Semiconductor Review
Technology stocks outperformed the broader market, led by a recovery in semiconductor and AI-related shares after recent weakness.
Among semiconductor-related stocks:
- Sandisk Corp. gained 6.77% on 12.0 million shares traded.
- Micron Technology advanced 1.11% on 43.0 million shares.
- Intel Corp. slipped 0.14% despite heavy trading volume of 105.5 million shares.
Storage manufacturers also posted solid gains:
- Western Digital Corp. rose 3.42% on 6.9 million shares.
- Seagate Technology gained 3.91% on 4.9 million shares.
Within the AI infrastructure group, server manufacturers continued to attract buying interest:
- Dell Technologies climbed 3.53% on 9.8 million shares traded.
- Celestica Inc. advanced 4.46% on 1.3 million shares.
The steady afternoon recovery in many technology stocks helped lift the Nasdaq Composite into positive territory despite the broadly negative market environment.
.
Market Internals
Although the Nasdaq closed higher, underlying market statistics remained notably weak.
- Declining stocks outnumbered advancing stocks by approximately 2:1 on both the NYSE and NASDAQ.
- New 52-week highs contracted sharply while new lows expanded on both exchanges, reflecting a meaningful deterioration in market leadership.
- NYSE trading volume increased modestly, while NASDAQ volume declined slightly, suggesting that the selling pressure, although widespread, was not accompanied by broad-based panic liquidation.
The divergence between headline index performance and market breadth indicates that institutional investors remained selective, with capital continuing to concentrate in a relatively narrow group of technology and growth stocks.
.
Technical Outlook
From a technical perspective, the Nasdaq Composite has slipped below its 25-day moving average, although it continues to trade comfortably above both its 50-day and 200-day moving averages, preserving its intermediate- and long-term uptrend.
The Dow Jones Industrial Average recorded its second consecutive decline but remains well above its 25-day, 50-day, and 200-day moving averages, suggesting that the broader primary trend remains constructive despite the recent pullback.
.
Key Takeaways for Traders and Investors
- Breadth deteriorated significantly. Market internals were considerably weaker than the major index performance suggests, with broad-based selling beneath the surface.
- Technology continues to lead. Semiconductor, storage, and AI infrastructure stocks attracted buyers following recent weakness, helping the Nasdaq outperform.
- Market leadership narrowed. The sharp decline in new 52-week highs and increase in new lows indicate that fewer stocks are participating in the advance.
- No evidence of panic selling. Trading volumes remained relatively orderly, suggesting the session was characterized more by portfolio rotation and profit-taking than broad liquidation.
- Watch market breadth closely. Sustained improvement in advancing issues and new 52-week highs will be needed to confirm that the broader market is regaining momentum. Conversely, continued deterioration in these internal indicators would increase the risk of a deeper market consolidation.
.
NOTICE TO READERS
The Canadian Vanguard Stock Market is about empowering you to build and manage your wealth by yourself. There is certainly no magic in managing finances or wealth but one needs to know what to do and commit to doing what is needed. When you are ready to start the journey to Take Charge and Put Your Destiny In Your Own Hands, start with reading The Canadian Vanguard every market day. If and when you need more related information or to advertise your business products or services in The Canadian Vanguard, Contact Us
Our readers are strongly advised to conduct their own research into individual stocks before making a purchase decision. In addition, investors are advised that past stock performance is no guarantee of future price appreciation. Any recommendation is not a guarantee of any particular stock’s future prices, and The Canadian Vanguard accepts no responsibility or liability for investors’ or readers’ purchases.
Stocks In The News/ Stocks To Watch and Market Strategy will soon be available only to Paying Subscribers. The dollar sign “$” in the Toronto Market section in the articles only stands for Canadian dollar and in the US market section “$” stands for US dollar.
(c) This article is published by The Canadian Vanguard on July 8, 2026



