




Markets Slide as Rising Bond Yields, Oil Prices and Strait of Hormuz Tensions Weigh on Investors
The Canadian Vanguard Stock Market Report Tuesday September 1, 2026 Edition
.
The Toronto Market
Tuesday Toronto Market Index
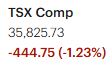
The S&P/TSX Composite Index declined 444.75 points, or 1.23%, on Tuesday to close at 35,825.73. The index has now posted three consecutive declining sessions, with selling pressure evident from the opening bell and persisting throughout the trading day.
Market breadth was notably weak, with only two of the TSX’s ten major sectors advancing. The broad-based selling indicates that Tuesday’s decline was not confined to a handful of heavily weighted stocks and reflects a deterioration in overall market sentiment.
Two important macro factors continued to weigh on the Canadian market: higher U.S. Treasury yields and rising oil prices. Higher U.S. bond yields can place additional pressure on equity valuations and reduce risk appetite, while the recent rise in crude prices has not translated into broader strength across the TSX. Together, these factors represent meaningful near-term headwinds for Canadian equities.
From a technical perspective, the short-term trend has weakened considerably. The TSX has declined in three of the past eight sessions, and the pace of deterioration has increased over the last three trading days. The index is now trading below its 25-day moving average, signaling a loss of short-term momentum.
However, the broader technical structure remains constructive. The TSX continues to hold above its 50-day moving average and remains well above its 200-day moving average. Consequently, while the short-term trend has turned increasingly bearish, the intermediate- and long-term trends have not yet been decisively compromised.
Bottom line: Tuesday’s decline represents a clear deterioration in short-term market momentum and breadth. Traders should monitor whether the TSX can regain its 25-day moving average or whether continued selling pressure pushes the index toward its 50-day moving average. A sustained break below the 50-day average would represent a more significant technical warning and could signal a deeper correction.
Tuesday’s TSX Market Statistics
Market internals deteriorated further on Tuesday, with declining issues substantially outnumbering advancing issues. There were 1,684 decliners versus 527 advancers, producing a decliner-to-advancer ratio of 3.20:1—approximately three declining issues for every advancing issue. A total of 134 issues finished unchanged.
The weakness was also evident in the market’s 52-week statistics. The TSX recorded 41 new 52-week highs and 129 new 52-week lows, compared with 39 new highs and 99 new lows on Monday. While the number of new highs increased only marginally, new 52-week lows rose by approximately 30%. The resulting high-to-low ratio deteriorated to 1:3, compared with 2:5 on Monday and 2:1 on Friday.
This deterioration in new-high/new-low participation is an important warning sign. Market internals began weakening on Monday and deteriorated further on Tuesday, indicating that the selling pressure is becoming broader and that fewer stocks are participating in the market’s advance.
Trading volume also declined. A total of 473.2 million shares changed hands on the TSX, down approximately 9% from the 519.6 million shares traded on Monday. The combination of a declining index, negative market breadth, and lower overall volume does not indicate capitulation, but it does confirm that Tuesday was another weak session for Canadian equities.
Market signal: The deterioration in breadth and 52-week participation warrants increased caution. When declining issues consistently overwhelm advancing issues and new lows expand relative to new highs, it can indicate that the underlying market is weakening before the headline index fully reflects that deterioration. Investors and traders should therefore pay close attention to these internals over the coming sessions. Continued deterioration could be an early indication that it is becoming prudent to reduce portfolio exposure, tighten risk controls, and protect capital.
For now, the message from the TSX internals is clear: the market is losing breadth and momentum, and the deterioration deserves attention even though the longer-term trend remains above its key 50- and 200-day moving averages.
.
Tuesday’s Toronto TSX Market Wrap-Up
The S&P/TSX Composite Index suffered a sharp decline on Tuesday, falling 444.75 points, or 1.23%, to close at 35,825.73. The index broke below the 36,000 level and has now posted three consecutive declining sessions, with selling pressure evident from the opening bell and persisting throughout the day.
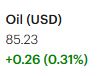
Tuesday’s session reflected a significant deterioration in short-term market sentiment. The TSX was pressured by higher global bond yields and renewed geopolitical tensions, which in turn pushed crude oil prices sharply higher. Oil briefly moved above $90 per barrel, reaching its highest level since late July before giving back some of the advance.
The weakness was broad-based. Only two of the TSX’s ten major sectors finished higher, while several important market sectors sustained substantial losses. Energy was the strongest-performing sector, gaining approximately 2.14%, followed by Consumer Durables & Services, which rose 1.24%. Healthcare declined 0.39%, Financials fell 0.76%, Industrials dropped 2.29%, Basic Materials declined 3.56%, and Technology was the session’s weakest major sector, falling 3.86%.
Market Internals Signal Increasing Weakness
The deterioration beneath the headline index is becoming increasingly important for traders and investors.
Declining issues overwhelmed advancing issues, with 1,684 decliners versus only 527 advancers, producing a decliner-to-advancer ratio of 3.20:1. Only 134 issues finished unchanged.
The 52-week statistics also deteriorated. The TSX recorded 41 new 52-week highs against 129 new 52-week lows, producing a high-to-low ratio of just 1:3. On Monday, the ratio was 2:5, compared with 2:1 on Friday.
The number of new highs changed very little, while new 52-week lows increased by approximately 30% from Monday. This is an important development because it suggests that weakness is spreading beneath the surface of the index.
Market internals began showing signs of weakness on Monday and deteriorated further on Tuesday. If this trend continues, the internals could provide an early warning that the broader market is entering a more meaningful period of correction.
Trading volume, however, did not confirm a capitulation-type selloff. Approximately 473.2 million shares traded on the TSX, down about 9% from Monday’s 519.6 million shares. The combination of a lower index, sharply negative breadth and declining volume points to a weak session, but not yet to evidence of panic selling.
Energy Stocks Provide a Measure of Support
Energy stocks were one of the few areas of strength as crude oil prices surged amid heightened geopolitical tensions.
Canadian Natural Resources (CNQ) benefited from the sharp move higher in oil prices. Other energy-related companies also advanced, including Cenovus Energy, which gained 3.53% to close at $46.09, with approximately 4.6 million shares traded.
The strength in energy was notable because it provided some support to the TSX on a day when most major sectors declined. However, the strength was concentrated largely within the energy complex and was not sufficient to offset the broad-based weakness elsewhere in the market.
For traders, the energy sector will remain particularly sensitive to developments affecting crude oil prices and geopolitical risk. A sustained move higher in oil could continue to support energy producers, while a reversal in crude prices could quickly remove one of the TSX’s few sources of strength.
Gold Stocks Give Back Some Recent Gains
Gold-mining stocks continued to retreat on Tuesday, extending a pullback following their recent strong performance.
Agnico Eagle Mines (AEM) declined 4.43% to close at $268.76, with approximately 970,200 shares traded. Franco-Nevada (FNV) fell 2.69% to $354.77, with approximately 344,000 shares traded.
The weakness in the gold-mining group is worth monitoring. After a strong advance, the sector appears to be undergoing a period of profit-taking and consolidation. Traders should watch whether the selling remains orderly or develops into a broader breakdown in the sector’s technical structure.
Canadian Banks Under Pressure
The financial sector was another source of weakness, with all six of Canada’s major banks closing lower.
National Bank of Canada was the weakest, declining 1.52%, followed by Bank of Montreal, which fell 0.87% to close at $234.19 on approximately 1.4 million shares traded.
Bank of Nova Scotia was the strongest performer among the major banks, although it still finished lower, declining just 0.09% to close at $126.76.
The broad weakness across the major banks is significant because financials carry substantial weight in the TSX. Continued weakness in the banking group could therefore place additional pressure on the index.
Technical Picture: Short-Term Trend Weakens
From a technical perspective, Tuesday’s decline represents a meaningful deterioration in short-term momentum.
The TSX is now trading below its 25-day moving average, indicating that the short-term trend has weakened. The index, however, remains above its 50-day moving average and well above its 200-day moving average.
This distinction is important. The short-term technical picture has become increasingly bearish, but the intermediate- and long-term trend has not yet been decisively broken.
The key level for traders to watch now is the 50-day moving average. A successful recovery above the 25-day average would help stabilize the short-term picture. Conversely, a sustained break below the 50-day average would represent a considerably more serious technical warning and could increase the probability of a deeper market correction.
Key Takeaways for Traders and Investors
- Short-term momentum has clearly deteriorated. Three consecutive declining sessions and a close below the 25-day moving average indicate increasing selling pressure.
- Market breadth is a major warning signal. Tuesday’s 3.20:1 decliner-to-advancer ratio and 129 new 52-week lows versus only 41 new highs show that weakness is broadening beneath the index.
- The deterioration in internals deserves attention. New lows increased approximately 30% from Monday while new highs barely changed. This type of divergence can sometimes precede further weakness in the headline index.
- Energy remains an important area of relative strength. Rising crude prices are supporting energy producers, but the sector’s strength is not broad enough to offset weakness across technology, materials, industrials and financials.
- Technology and Basic Materials were particularly weak. Their declines of 3.86% and 3.56%, respectively, contributed significantly to Tuesday’s broad market selloff.
- The banks require monitoring. All six major Canadian banks declined, adding pressure to one of the TSX’s most important sectors.
- The broader uptrend remains intact—for now. The TSX is still above its 50-day and 200-day moving averages. The current deterioration should therefore be viewed as a significant short-term warning rather than confirmation of a long-term bear market.
- Risk management is becoming increasingly important. Traders may want to tighten stops, reduce excessive leverage and become more selective with new positions until market breadth and short-term momentum begin to improve.
Bottom Line
Tuesday’s market action was clearly bearish, and the message from the internals is becoming harder to ignore. The headline index has weakened, market breadth has deteriorated sharply, new lows are expanding and several major sectors are experiencing significant selling pressure.
At the same time, the TSX remains above its 50-day and 200-day moving averages, meaning the longer-term market structure has not yet been broken. The next several sessions will therefore be important. A stabilization in breadth and a recovery above the 25-day moving average would improve the short-term outlook. Continued deterioration—particularly a sustained break below the 50-day moving average—would significantly increase the risk of a deeper correction.
For investors, this is a time to focus on capital preservation and portfolio quality. For traders, it is a time to respect the weakening trend, manage risk aggressively and wait for evidence that buyers are returning before becoming more aggressive.
.
The US Markets
Monday’s U.S. Market Indexes
All four major U.S. equity indexes finished lower on Monday, with selling pressure broadening across large-cap and small-cap stocks. The Dow Jones Industrial Average declined 419.02 points, or 0.79%, to close at 52,766.88. The S&P 500 fell 54.67 points, or 0.71%, to 7,631.47, while the Nasdaq Composite declined 271.11 points, or 1.03%, to 26,099.77. The Russell 2000 was the session’s weakest major benchmark, falling 36.32 points, or 1.23%, to 2,920.13.

Monday was broadly a risk-off session. The major indexes opened well below their previous closes and remained firmly in negative territory throughout the trading day. There was little evidence of a meaningful recovery attempt, highlighting the lack of buying conviction as the session progressed.
Rising Treasury Yields Remain a Headwind
The continued rise in U.S. Treasury yields remains an important concern for equity investors. Higher yields increase borrowing costs and can place pressure on equity valuations, particularly among companies that depend heavily on financing or future growth expectations.
Small-cap stocks are especially sensitive to changes in financing conditions, making the Russell 2000 an important benchmark to monitor. The index has now declined 1.23% on Monday, 0.54% on the previous session, and 1.39% on Friday, representing a significant three-session deterioration.
For investors with substantial exposure to small-cap stocks, the recent weakness warrants closer portfolio scrutiny. Rather than attempting to predict the next market move, investors may want to reassess position sizes, review individual holdings and consider whether current risk exposure remains appropriate if higher yields continue to pressure the market.
Technical Picture Deteriorates
The technical picture across the major indexes has weakened, although the degree of deterioration varies considerably.
The Nasdaq Composite has fallen below its 25-day moving average and is now trading just above its 50-day moving average. The 50-day average is therefore an important near-term level for technology and growth-oriented stocks. A sustained break below it would represent a further deterioration in short- and intermediate-term momentum.
The S&P 500 is also below its 25-day moving average but remains comfortably above its 50-day and 200-day moving averages. This suggests that the index’s short-term momentum has weakened while its intermediate- and longer-term technical structure remains comparatively healthy.
The Dow Jones is trading below its 25-day moving average and just above its 50-day moving average, while remaining well above its 200-day moving average. Like the S&P 500, the Dow is showing short-term weakness without yet confirming a broader technical breakdown.
The Russell 2000 presents the most concerning technical picture of the four major indexes. After two consecutive sessions of significant weakness, the small-cap benchmark has fallen back below both its 25-day and 50-day moving averages. This puts the Russell 2000 in a vulnerable position heading into the next several sessions.
A sustained move below the 50-day moving average—particularly if accompanied by expanding volume and continued deterioration in market breadth—would be a more significant technical warning. Traders should therefore monitor the Russell closely for either a recovery above the 50-day average or further deterioration below it.
Relative Performance Matters
Monday’s performance also highlights an important theme: market weakness is becoming more pronounced in smaller companies and growth-oriented stocks.
The Russell 2000 declined 1.23%, compared with losses of 1.03% for the Nasdaq, 0.79% for the Dow and 0.71% for the S&P 500. This relative weakness suggests that investors are becoming more selective and potentially more defensive as yields rise.
The behavior of the Russell 2000 over the next few sessions could therefore provide useful information about overall risk appetite. If small caps continue to underperform while Treasury yields remain elevated, investors should be cautious about interpreting any strength in the large-cap indexes as evidence that the broader market has fully stabilized.
Key Takeaways for Traders and Investors
- All four major U.S. indexes declined, making Monday a broad-based risk-off session.
- The Russell 2000 is the primary technical concern. It has fallen below both its 25-day and 50-day moving averages following three consecutive weak sessions.
- Treasury yields remain a key market variable. Continued increases in yields could maintain pressure on equity valuations and borrowing-sensitive companies.
- The Nasdaq is approaching an important technical test. It remains just above its 50-day moving average, while already trading below its 25-day average.
- The S&P 500 and Dow remain technically stronger. Both are below their 25-day averages but remain above their 50-day and 200-day averages.
- Small-cap investors should pay particular attention to risk. Continued weakness in the Russell 2000 could signal deteriorating risk appetite and justify a reassessment of position sizes and portfolio concentration.
- Watch the 50-day moving averages. A decisive break below these levels, particularly when accompanied by increasing volume and worsening breadth, would strengthen the bearish technical signal.
Bottom Line: Monday was a weak session for U.S. equities, and the deterioration is most evident in small-cap stocks. Rising Treasury yields continue to create a challenging environment for risk assets, while the Russell 2000’s move back below its 50-day moving average is a warning sign that traders should not ignore.
The major large-cap indexes have not yet suffered a comparable intermediate-term breakdown. The S&P 500 and Dow remain above their 50-day and 200-day moving averages, while the Nasdaq is testing support near its 50-day average.
For now, the market is signaling increasing short-term risk rather than a confirmed long-term trend reversal. Traders should watch Treasury yields, the Russell 2000, market breadth and the 50-day moving averages closely. A stabilization in yields accompanied by improving breadth and a recovery above key moving averages would improve the outlook; continued deterioration would suggest that a more defensive approach may be warranted
Tuesday’s U.S. Market Statistics
U.S. market internals deteriorated further on Tuesday, with both the NYSE and Nasdaq recording decisively negative breadth and a significant imbalance between new 52-week highs and lows. The deterioration was particularly notable in the Nasdaq, where new lows substantially outnumbered new highs.
New York Stock Exchange (NYSE) : Declining issues substantially outnumbered advancing issues on the New York Stock Exchange. There were 3,389 decliners versus 1,208 advancers, producing a decliner-to-advancer ratio of 2.80:1—approximately three declining stocks for every advancing stock. A further 479 issues finished unchanged.
The 52-week statistics were considerably weaker than Monday’s figures. The NYSE recorded 143 new 52-week highs and 410 new 52-week lows, compared with 112 new highs and 234 new lows on Monday.
While the number of new highs increased by approximately 25%, the number of new lows increased by roughly 75%. As a result, the new-high-to-new-low ratio deteriorated to approximately 1:3, compared with roughly 1:2 on Monday.
This is an important deterioration in market internals. Although more stocks were reaching new highs, the increase in new lows was substantially larger, indicating that weakness is spreading more rapidly than strength.
NYSE trading volume totaled approximately 5.05 billion shares, down 9.5% from Monday’s 5.57 billion shares. The decline in volume occurred alongside a lower market, but the more important signal from Tuesday’s session came from the breadth and new-high/new-low statistics rather than the change in volume.
Overall, NYSE internals were bearish on Tuesday and slightly weaker than Monday, particularly when measured by the ratio of new highs to new lows. The deterioration suggests that investors should remain cautious as volatility increases.
Nasdaq: The Nasdaq showed an even more pronounced deterioration in market breadth and 52-week participation.
There were 3,630 declining issues compared with 1,263 advancing issues, producing a decliner-to-advancer ratio of 2.87:1—again, approximately three decliners for every advancer. Another 424 issues finished unchanged.
This marked the third consecutive session of negative Nasdaq market breadth, reinforcing the indication that selling pressure remains broad-based.
The 52-week statistics were particularly concerning. The Nasdaq recorded only 56 new 52-week highs against 321 new 52-week lows, compared with 62 new highs and 210 new lows on Monday.
New highs declined by approximately 10%, while new lows increased by roughly 50%. The resulting high-to-low ratio deteriorated to approximately 1:5, compared with roughly 1:3 on Monday.
In other words, for every Nasdaq stock reaching a new 52-week high, approximately five were reaching new 52-week lows. That is a distinctly bearish internal signal and represents another step down from an already weak reading on Monday.
Nasdaq trading volume totaled approximately 6.99 billion shares, down about 13% from Monday’s 8.03 billion shares. As with the NYSE, volume declined while the index also moved lower. The more significant development, however, was the continued deterioration in market breadth and the widening gap between new highs and new lows.
Market Internals Are Becoming More Important
Tuesday’s statistics reinforce the message from Monday: the underlying market is weakening even as the major indexes remain relatively close to their recent highs.
The NYSE recorded a 2.80:1 decliner-to-advancer ratio, while the Nasdaq recorded a 2.87:1 ratio. More importantly, new lows expanded considerably faster than new highs on both exchanges.
The Nasdaq’s 1:5 new-high-to-new-low ratio is particularly notable. Three consecutive sessions of negative breadth, combined with a rapidly expanding number of new lows, indicate that weakness is becoming increasingly widespread among individual stocks.
The market is also becoming more volatile, with performance varying significantly among sectors and individual stocks. In this environment, index performance alone may not provide an accurate picture of the underlying risk. Traders and investors should therefore pay close attention to breadth, new-high/new-low data and individual stock price action.
Key Takeaways for Traders and Investors
- Market breadth remains decisively negative. Both the NYSE and Nasdaq had approximately three declining stocks for every advancing stock.
- The Nasdaq’s internal picture is particularly weak. New 52-week lows outnumbered new highs by approximately 5:1, compared with 3:1 on Monday.
- NYSE internals also deteriorated. New lows increased approximately 75% from Monday, substantially outpacing the 25% increase in new highs.
- Negative Nasdaq breadth has now persisted for three consecutive sessions. This is becoming an important short-term warning signal.
- Higher Treasury yields and elevated oil prices remain important macro headwinds. Both factors can contribute to increased pressure on equity valuations and investor risk appetite.
- Falling volume does not negate the bearish breadth signal. The more significant message from Tuesday’s session came from the widening number of new lows and the persistent imbalance between declining and advancing issues.
- Volatility is increasing. Traders should be prepared for larger moves and greater differences in performance between sectors and individual stocks.
- Risk management should take priority over chasing returns. Investors may want to review portfolio concentration, reassess positions that have weakened technically and ensure that risk levels remain appropriate for the current environment.
Bottom Line: Tuesday’s market internals were bearish and, in several respects, weaker than Monday’s. The NYSE and Nasdaq both experienced broad-based selling, while the number of stocks reaching new 52-week lows increased sharply.
The Nasdaq is sending the stronger warning signal, with new lows outnumbering new highs by approximately five to one and negative breadth persisting for a third consecutive session. The NYSE is also showing clear deterioration, with new lows increasing much faster than new highs.
The market has therefore entered a period in which capital preservation and disciplined risk management deserve greater emphasis. Traders should remain nimble, avoid assuming that every market decline represents a buying opportunity, and be prepared to reduce exposure or take profits where the technical evidence warrants it.
For investors, maintaining some cash and limiting excessive portfolio risk can provide flexibility while the market determines whether this deterioration in internals is a temporary correction or the beginning of a more significant change in trend.
.
Tuesday’s U.S. Market Wrap-Up Report
U.S. equities came under renewed pressure Tuesday as escalating hostilities between the United States and Iran intensified geopolitical uncertainty and pushed investors toward a more defensive posture. The Middle East conflict has become an important market-moving factor, and Tuesday’s trading action demonstrated once again how quickly geopolitical headlines can affect risk appetite.
The combination of geopolitical uncertainty, higher oil prices and rising global bond yields is creating a challenging environment for equity investors. With Treasury yields continuing to move higher, valuations—particularly among growth-oriented and financing-sensitive companies—remain under pressure.
Trading conditions have also become increasingly volatile. For traders, the market is currently being influenced heavily by geopolitical developments and interest-rate expectations rather than by company fundamentals alone. This makes short-term positioning more difficult and increases the importance of disciplined risk management.
Sector Performance
Sector performance was mixed, although the overall market remained under pressure. Five of the eleven major S&P 500 sectors finished Tuesday in positive territory.
Energy was the strongest-performing sector, gaining 1.76%, as geopolitical tensions pushed crude oil prices higher. Healthcare also advanced, gaining 0.66%.
On the downside, Financials declined 0.92%, Technology fell 1.19%, and Industrials lost 1.26%. Basic Materials was the weakest major sector, declining 1.65%.
The divergence between Energy and several economically sensitive sectors is notable. Rising oil prices are providing support to energy-related equities, while higher yields and concerns about economic conditions are weighing on other areas of the market.
Market Internals Remain Bearish
The underlying market statistics were weaker than the headline index performance alone might suggest.
On the NYSE, 3,389 stocks declined compared with 1,208 advancers, producing a decliner-to-advancer ratio of 2.80:1. The exchange recorded 143 new 52-week highs versus 410 new 52-week lows.
The Nasdaq showed an even weaker internal picture. There were 3,630 decliners versus 1,263 advancers, producing a 2.87:1 ratio. More concerning, the Nasdaq recorded only 56 new 52-week highs against 321 new 52-week lows, resulting in a new-high-to-new-low ratio of approximately 1:5.
Nasdaq breadth has now been negative for three consecutive sessions.
The deterioration in new-high/new-low participation is particularly important. On the NYSE, new lows increased approximately 75% from Monday, while on the Nasdaq they increased by roughly 50%. This suggests that weakness is broadening across individual stocks rather than being concentrated only in the major indexes.
For traders, this is an important distinction: the market may look less damaged when viewed through the major indexes than it does when viewed through individual-stock participation.
Technical Picture Remains Vulnerable
The technical picture also reflects the deterioration in market conditions.
The Nasdaq has fallen below its 25-day moving average and is now trading just above its 50-day moving average. The S&P 500 is below its 25-day moving average but remains above its 50-day and 200-day averages. The Dow Jones is also below its 25-day average and is trading just above its 50-day average.
The Russell 2000 remains the most vulnerable of the major U.S. benchmarks. After several weak sessions, the small-cap index has fallen back below both its 25-day and 50-day moving averages.
The 50-day moving average is therefore an important technical level to monitor across the major indexes. A sustained break below this level, particularly if accompanied by increasing volume and continued deterioration in market breadth, would represent a more significant technical warning.
At present, the market is showing short-term deterioration without yet confirming a broad long-term breakdown. The S&P 500 and Dow remain well above their 200-day moving averages, which indicates that the longer-term trend has not yet been decisively compromised.
Company News: Dell Technologies
Dell Technologies (DELL) provided an interesting contrast to the broader market weakness after reporting earnings following Tuesday’s regular trading session.
Dell delivered an upbeat earnings report and raised its full-year revenue guidance to approximately $192 billion, reportedly about $18 billion above the analyst consensus referenced in the draft. The stock had declined approximately 6.8% during Tuesday’s regular session, with about 15.8 million shares traded, before gaining approximately 11% in after-hours trading following the earnings announcement.
Dell is an important company to watch because of its exposure to the rapidly expanding data-center and artificial-intelligence infrastructure market. The company manufactures servers and other infrastructure used in data centers, including systems supporting AI workloads.
However, traders should remember that after-hours gains do not necessarily translate into equivalent gains during the next regular trading session. The stock’s reaction after the opening bell, trading volume and ability to hold its initial gains will be more meaningful indicators of whether investors are willing to maintain the post-earnings bid.
DELL may therefore merit a place on traders’ and investors’ watchlists, particularly for those interested in the AI infrastructure and data-center theme. The key question is whether the earnings strength can overcome the broader pressure currently affecting technology stocks.
Key Takeaways for Traders and Investors
- Geopolitical risk is dominating short-term trading. Headlines surrounding the U.S.-Iran conflict can produce rapid changes in oil prices, Treasury yields and equity risk appetite.
- Higher Treasury yields remain a major headwind. Rising yields are particularly important for growth, technology and small-cap stocks.
- Market internals are weaker than the headline indexes suggest. Both the NYSE and Nasdaq recorded approximately three declining stocks for every advancing stock.
- The Nasdaq is showing a particularly bearish internal signal. New 52-week lows outnumbered new highs by approximately 5:1.
- Small caps remain vulnerable. The Russell 2000 has fallen below both its 25-day and 50-day moving averages and continues to underperform the large-cap indexes.
- Energy remains a relative-strength area. Higher crude prices are providing support to energy stocks as geopolitical tensions escalate.
- Technology remains under pressure. The sector declined 1.19% Tuesday, and the Nasdaq is now testing its 50-day moving average.
- Dell is worth watching, but the after-hours move needs confirmation. Traders should focus on regular-session price action, volume and whether the stock can hold its post-earnings gains.
- Risk management is becoming increasingly important. With volatility rising and market internals deteriorating, traders should be prepared to adjust exposure quickly rather than assume that every decline represents a buying opportunity.
Bottom Line
Tuesday’s U.S. market action reinforces the message that short-term risk has increased significantly. Geopolitical tensions, higher oil prices and rising Treasury yields are creating a difficult backdrop, while market internals continue to deteriorate.
The most concerning signal is not simply the decline in the major indexes, but the breadth and new-low data beneath them. The Nasdaq’s 1:5 new-high-to-new-low ratio and three consecutive sessions of negative breadth indicate that selling pressure is becoming increasingly widespread.
At the same time, the longer-term technical picture has not yet broken down. The S&P 500 and Dow remain above their 50-day and 200-day moving averages, while the Nasdaq is testing its 50-day average.
For traders, this is an environment that calls for nimble positioning, tighter risk controls and close attention to technical levels. For investors, maintaining portfolio discipline, reviewing concentrated positions and keeping some capital available may provide greater flexibility while the market works through the current combination of geopolitical and interest-rate uncertainty.
The immediate question is no longer simply whether the indexes decline—it is whether the deterioration in market internals continues. If breadth and new lows improve, the current weakness could prove temporary. If they continue to deteriorate while the major indexes break below their 50-day moving averages, the probability of a deeper correction would increase materially.
.
NOTICE TO READERS
The Canadian Vanguard Stock Market is about empowering you to build and manage your wealth by yourself. There is certainly no magic in managing finances or wealth but one needs to know what to do and commit to doing what is needed. When you are ready to start the journey to Take Charge and Put Your Destiny In Your Own Hands, start with reading The Canadian Vanguard every market day. If and when you need more related information or to advertise your business products or services in The Canadian Vanguard, Contact Us
Our readers are strongly advised to conduct their own research into individual stocks before making a purchase decision. In addition, investors are advised that past stock performance is no guarantee of future price appreciation. Any recommendation is not a guarantee of any particular stock’s future prices, and The Canadian Vanguard accepts no responsibility or liability for investors’ or readers’ purchases.
Stocks In The News/ Stocks To Watch and Market Strategy will soon be available only to Paying Subscribers. The dollar sign “$” in the Toronto Market section in the articles only stands for Canadian dollar and in the US market section “$” stands for US dollar.
(c) This article is published by The Canadian Vanguard on September 1, 2026