Markets Rally as Oil Prices and Long-Term Treasury Yields Decline
The Canadian Vanguard Stock Market Report Tuesday August 25, 2026 Edition
.
The Toronto Market
Tuesday’s Toronto Market Index
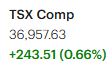
The Toronto S&P/TSX Composite index bolted 243.51 points or 0.66%, and closed at 36,957.63.
The TSX index has of today recorded three consecutive sessions of gains. The rebound today was not broad-based as only four of the ten of the ten major sectors gained. Basic materials sector dominated gain today. The TSX index was the top performer among the major indexes that we regularly track. That instills more confidence in investors about the index.
The TSX internals remain strong and robust. Even more important is that the TSX index, remains high above the 25-day, 50-day and the 200-day moving averages even after closing in the red today.

Tuesday’s TSX Market Statistics
The TSX delivered another strong breadth reading on Tuesday, with advancing issues significantly outnumbering declining issues. There were 1,436 advancers versus 735 decliners, while 143 issues finished unchanged. This produced an advancer-to-decliner ratio of approximately 1.95 to 1, meaning nearly two stocks advanced for every stock that declined.
The market’s 52-week statistics were particularly encouraging. The TSX recorded 100 new 52-week highs and only 18 new 52-week lows, compared with 62 new highs and 33 new lows on Monday. The number of new highs increased substantially, while new lows declined by almost 50%.
The resulting new-high-to-new-low ratio was nearly 5.6 to 1, a significant improvement from approximately 1.9 to 1 on Monday. This is an important breadth signal for traders and investors because it indicates that the market’s strength is extending beyond the index itself and into a much broader group of individual stocks.
Overall, TSX market internals remain firmly bullish, continuing the positive trend that began on Friday. The combination of strong daily breadth, a sharp expansion in new 52-week highs, and a substantial reduction in new lows provides further evidence that underlying market momentum remains healthy.
Trading activity was somewhat lighter, however. Total TSX volume reached 400,453,057 shares, down approximately 7% from the 431,291,884 shares traded on Monday. While the decline in volume is worth monitoring, it does not currently offset the strength evident in the market’s breadth and new-high/new-low statistics.
.
The US Markets
Tuesday’s U.S. Market Indexes
U.S. equities extended their rebound on Tuesday, with all four major indexes closing higher. The advance was broad enough to lift both large-cap and small-cap benchmarks, although the Nasdaq continued to show somewhat greater upside momentum.
The Dow Jones Industrial Average gained 160.24 points, or 0.30%, to close at 53,577.40. The S&P 500 advanced 24.42 points, or 0.32%, finishing at 7,677.28. The Nasdaq Composite rose 171.11 points, or 0.66%, to 26,151.30, while the Russell 2000 climbed 14.94 points, or 0.50%, to close at 3,010.02.

Large-Cap Leadership Remains Notable: The Dow continues to exhibit relative strength compared with the other major U.S. indexes. It has closed higher in four of the last five sessions, making it the most consistently positive of the major benchmarks recently.
The only exception came on Thursday, when the U.S. administration announced a threat of total economic war against Iran. The announcement triggered a sharp rise in long-term Treasury yields, contributing to a significant sell-off across U.S. equity markets.
For investors and traders, the Dow’s recent resilience is worth watching. Continued strength in the large-cap index, particularly if accompanied by improving breadth in the S&P 500 and Nasdaq, would provide a more constructive signal for the broader market.
Technical Picture
From a technical perspective, the major indexes remain in relatively strong positions despite recent volatility.
The Nasdaq Composite is trading slightly below its 25-day moving average, which remains a near-term technical concern. However, it continues to trade comfortably above its 50-day and 200-day moving averages, indicating that its intermediate- and long-term trends remain intact.
The S&P 500 remains well above both its 50-day and 200-day moving averages, preserving its broader bullish trend.
The Russell 2000 has regained its 25-day moving average and remains well above its 50-day and 200-day moving averages. This is an encouraging development because renewed strength in small-cap stocks can signal improving risk appetite and broader participation in the equity market.
Key Takeaway
The technical picture remains constructive, but near-term momentum bears watching. All four major indexes closed higher Tuesday, the Dow continues to demonstrate notable relative strength, and the Russell 2000 has reclaimed its 25-day moving average. The Nasdaq’s position just below its 25-day average is the main near-term weakness.
For traders, the next important signal will be whether the indexes can hold or reclaim their short-term moving averages while maintaining their positions above the 50-day and 200-day averages. For investors, the fact that all four major indexes remain above their longer-term moving averages continues to support the broader bullish trend.
.
Tuesday’s U.S. Market Statistics
U.S. market internals improved noticeably on Tuesday, with both the NYSE and Nasdaq posting positive and broad-based market breadth. The improvement in new 52-week highs and the decline in new lows also point to healthier underlying participation, reinforcing the bullish tone of the session.
New York Stock Exchange (NYSE): The NYSE recorded 2,827 advancing issues versus 1,650 declining issues, with 518 issues unchanged. This produced an advancer-to-decliner ratio of 1.72 to 1, meaning roughly seven stocks advanced for every four that declined.
Market breadth was therefore positive and broad-based, rather than being driven by a relatively small group of large-cap stocks.
The new-high/new-low data provided an additional bullish signal. The NYSE recorded 190 new 52-week highs and 79 new 52-week lows, compared with 158 new highs and 116 new lows on Monday.
That represents a 20% increase in new 52-week highs and a 32% decline in new 52-week lows. The resulting new-high-to-new-low ratio improved to approximately 2.4 to 1, or roughly five new highs for every two new lows. This compares with approximately 1.4 to 1 on Monday and 1.8 to 1 on Friday.
For traders and investors, the improvement in these statistics is significant. A rising number of new highs combined with a declining number of new lows generally indicates that market strength is broadening and that more individual stocks are participating in the advance.
NYSE trading volume reached 4.34 billion shares, down approximately 4% from Monday’s 4.53 billion shares. Although volume was slightly lighter, the decline was relatively modest and did not undermine the positive breadth and improving new-high/new-low readings.
NASDAQ: The Nasdaq also delivered a strong breadth reading. There were 3,170 advancing issues compared with 1,747 declining issues, while 372 issues finished unchanged. The resulting advancer-to-decliner ratio was 1.81 to 1, again representing roughly two advancing stocks for every declining stock.
The Nasdaq recorded 179 new 52-week highs and 106 new 52-week lows, compared with 141 new highs and 139 new lows on Monday.
The improvement was notable. New 52-week highs increased by approximately 27%, while new 52-week lows declined by roughly 24%. The new-high-to-new-low ratio improved to approximately 1.7 to 1, or five new highs for every three new lows, compared with almost a 1-to-1 ratio on Monday.
This represents a meaningful recovery from Monday’s relatively weak internals and suggests that the Nasdaq’s underlying market participation has improved.
Nasdaq trading volume totaled 7.76 billion shares, approximately 3% higher than Monday’s 7.53 billion shares. The combination of a rising Nasdaq, stronger breadth, improving new-high/new-low statistics, and higher trading volume is particularly encouraging for market participants.
Key Takeaway
Tuesday’s market internals were clearly more constructive than Monday’s.
Both the NYSE and Nasdaq showed broad-based advances, with advancing issues substantially outnumbering declining issues. More importantly, new 52-week highs increased while new lows declined on both exchanges. This is one of the more encouraging aspects of today’s market action because it indicates that the improvement is not confined to the major indexes.
The Nasdaq provided an additional positive signal by combining higher prices with higher trading volume, while the NYSE maintained strong breadth despite a modest decline in volume.
For traders, the key question now is whether this improvement in breadth and participation continues over the next several sessions. Sustained increases in new highs, continued declines in new lows, and healthy advance/decline ratios would strengthen the case that the recent market weakness was a correction rather than the beginning of a more significant trend reversal.
Overall, Tuesday’s internals remain bullish and represent a meaningful improvement in the underlying health of the U.S. equity market.
.
Tuesday U.S. Market Wrap-Up Report
U.S. equity markets finished Tuesday with a broad-based advance, but investors and traders should not mistake a relatively quiet session for a low-risk environment. Several potentially market-moving events are concentrated in the next few trading sessions, making this an important week for positioning, risk management, and sector rotation.
Busy Week for Markets
The market faces several important catalysts. The first arrives Wednesday morning with the release of the July Personal Consumption Expenditures (PCE) inflation data, the Federal Reserve’s closely watched inflation gauge. The Bureau of Economic Analysis has scheduled the Personal Income and Outlays report for 8:30 a.m. EDT on Wednesday, August 26.
Later Wednesday, NVIDIA’s second-quarter fiscal 2027 earnings report is scheduled for after the market close. NVIDIA has become one of the most important barometers of AI-related investment, semiconductor demand, and AI infrastructure spending, making the report potentially significant well beyond the stock itself.
The Jackson Hole Economic Policy Symposium follows from August 27–29. Federal Reserve Chair Kevin Warsh’s remarks on Friday will receive particular attention because investors will be looking for clues about the Fed’s policy outlook and the path of interest rates.
In other words, PCE inflation, NVIDIA earnings, and Jackson Hole create a potentially volatile combination for the remainder of the week. Markets generally dislike uncertainty, and traders should be prepared for sharp moves in both directions as new information becomes available.
Tuesday’s Market Action: The major U.S. indexes all closed higher Tuesday. The Dow Jones Industrial Average gained 160.24 points, or 0.30%, to close at 53,577.40. The S&P 500 advanced 24.42 points, or 0.32%, to 7,677.28. The Nasdaq Composite gained 171.11 points, or 0.66%, finishing at 26,151.30, while the Russell 2000 rose 14.94 points, or 0.50%, to 3,010.02.
The Dow continues to demonstrate notable relative strength, having advanced in four of the last five sessions. The Nasdaq, meanwhile, remains slightly below its 25-day moving average but comfortably above its 50-day and 200-day averages. The S&P 500 remains well above its 50-day and 200-day moving averages, while the Russell 2000 has reclaimed its 25-day moving average and remains above its longer-term averages.
For investors, the broader technical picture therefore remains constructive. For traders, however, the next few sessions could produce considerable volatility as the market responds to inflation data, earnings, Treasury yields, and Federal Reserve commentary.
.
Market Breadth Strengthens
Tuesday’s market internals were particularly encouraging.
On the NYSE, 2,827 issues advanced compared with 1,650 decliners, producing an advancer-to-decliner ratio of 1.72 to 1. There were also 190 new 52-week highs versus 79 new lows.
That represents a substantial improvement from Monday. New 52-week highs increased by approximately 20%, while new lows declined by approximately 32%. The new-high-to-new-low ratio improved to roughly 2.4 to 1, compared with approximately 1.4 to 1 on Monday.
The Nasdaq produced an even stronger breadth reading, with 3,170 advancers versus 1,747 decliners, for an advancer-to-decliner ratio of 1.81 to 1. The exchange recorded 179 new 52-week highs and 106 new lows.
Nasdaq new highs increased by approximately 27%, while new lows declined by approximately 24%. The resulting new-high-to-new-low ratio improved to roughly 1.7 to 1, compared with approximately 1 to 1 on Monday.
Taken together, these numbers suggest that Tuesday’s rally was not simply an index-level advance driven by a handful of large-cap stocks. Market participation was broad, and the improvement in new highs and new lows provides an additional bullish signal.
Trading volume was mixed. NYSE volume declined approximately 4% to 4.34 billion shares, while Nasdaq volume increased approximately 3% to 7.76 billion shares. The combination of higher Nasdaq prices, improving breadth, and higher Nasdaq volume is particularly constructive for technology-oriented traders.
Sector Rotation Favors Technology and Basic Materials
Seven of the eleven major market sectors finished higher Tuesday.
Basic Materials led the advance, gaining 1.18%, followed by Technology, which rose 0.95%. Healthcare, Financials, and Industrials also posted gains of 0.62%, 0.47%, and 0.43%, respectively.
The weakness was concentrated in consumer-related and energy stocks. Discretionary Consumer Goods & Services declined 0.35%, while Durable Consumer Goods & Services fell 0.44%. Energy was the weakest sector, dropping 1.66%.
The sector performance is worth monitoring because it suggests that investors were willing to increase exposure to economically sensitive and technology-related areas while reducing exposure to Energy.
.
Treasury Yields and Oil Remain Important Market Drivers
The relationship between Treasury yields, oil prices, and equities remains particularly important.
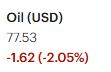
Earlier Tuesday, the 10-year Treasury yield declined while oil prices also moved lower, helping create a more favorable environment for equities. Falling oil prices can reduce inflation concerns, while lower Treasury yields can improve the relative attractiveness of stocks and reduce financing pressure on growth-oriented companies.
The geopolitical situation surrounding the U.S. and Iran remains another major source of market risk. Recent hopes of de-escalation and improved conditions around the Strait of Hormuz have contributed to lower oil prices. Reuters reported Wednesday that declining oil prices, driven partly by hopes surrounding the reopening of the Strait of Hormuz, were supporting global equities ahead of NVIDIA’s results.
For traders, this means that geopolitical headlines can continue to override traditional technical signals. Oil, Treasury yields, and developments involving Iran should remain on the daily watch list.