
Major Market Indexes Retreat as Rising Treasury Yields and Oil Prices Pressure Stocks
The Canadian Vanguard Stock Market Report Monday, September 14, 2026, Edition
.
The Toronto Market
Monday’s Toronto Market Index
The Toronto S&P/TSX Composite Index rose 5.04 points, or 0.01%, to close at 35,702.53. The TSX managed to finish the session slightly higher following a relatively rough trading day. Although the index posted a modest gain, it remains below the psychologically important 36,000 level.


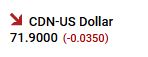
The cost of borrowing continues to rise as government bond yields, along with the U.S. 10-year Treasury yield, move higher. Rising yields could continue to put pressure on equity markets as investors assess the impact of higher borrowing costs on economic growth and corporate earnings.
The TSX declined during the morning session before recovering and moving well above Friday’s closing level. However, the index was unable to hold those gains and eventually pulled back to finish only slightly above the previous session’s close.
From a technical perspective, the TSX remains below both its 25-day and 50-day moving averages. However, it continues to maintain a healthy gap above its 200-day moving average, which remains a more encouraging longer-term signal for now.
Monday’s TSX Market Statistics
At the TSX, declining issues (decliners) outnumbered advancing issues (advancers) by a considerable margin. There were 1,283 decliners and 941 advancers, producing a decliner-to-advancer ratio of 1.36 to 1—approximately seven decliners for every five advancers. A total of 165 issues remained unchanged.
The exchange recorded 42 new 52-week highs and 185 new 52-week lows, compared with 22 new 52-week highs and 121 new 52-week lows on Friday. Market breadth was negative today, and the ratio of new 52-week highs to new 52-week lows remained poor, indicating continued dominance by stocks making new lows.
Compared with Friday, the number of new 52-week highs increased by 100%, while new 52-week lows increased by approximately 53%. The ratio of new highs to new lows was roughly 1:5, which was almost unchanged from Friday. Overall, the Toronto market’s internal indicators did not improve today, but neither did they deteriorate significantly.
Total trading volume on the TSX reached 490,983,842 shares, approximately 33% higher than the 369,593,467 shares traded on Friday. Despite the TSX Composite Index gaining only marginally, trading activity increased substantially. The combination of a nearly flat index and significantly higher volume suggests that market participation was considerably stronger, even though the underlying market breadth remained negative.
.
Monday’s Toronto TSX Market Wrap-Up Report
The Toronto S&P/TSX Composite Index managed to finish marginally higher on Monday, gaining 5.04 points, or 0.01%, to close at 35,702.53. Although the headline gain was negligible, the session was more active and volatile beneath the surface, with trading volume rising substantially and several major sectors posting meaningful gains.
The TSX initially declined during the morning session before recovering and moving well above Friday’s close. However, the index was unable to hold those gains and eventually pulled back to finish only slightly higher. The index remains below the psychologically important 36,000 level, as well as its 25-day and 50-day moving averages. On the positive side, it continues to maintain a healthy gap above its 200-day moving average, keeping the longer-term technical picture more constructive for now.
Sector Performance
Despite the nearly flat performance of the overall index, seven of the ten major sectors finished higher, indicating that there was considerably more strength beneath the surface than the TSX’s 0.01% gain might suggest.
Technology was the session’s strongest major sector, gaining 3.99%, followed by Consumer Durables & Services, which advanced 2.61%. Healthcare, Telecommunications Services and Energy also posted gains of 1.48%, 1.22% and 0.86%, respectively.
Financials, which carry significant weight in the TSX, gained only 0.07%, limiting their contribution to the broader index. Utilities slipped 0.16%, while Basic Materials was the session’s weakest major sector, declining 2.28%.
The sector performance suggests that Monday’s market strength was concentrated rather than broad-based across all areas of the TSX.
Market Breadth Remains Weak
The market internals provide a more cautious message.
Declining issues significantly outnumbered advancing issues, with 1,283 decliners versus 941 advancers. This produced a decliner-to-advancer ratio of approximately 1.36 to 1, or roughly seven declining stocks for every five advancing stocks. Another 165 issues finished unchanged.
The new-high/new-low figures were also unfavorable. The TSX recorded 42 new 52-week highs and 185 new 52-week lows, compared with 22 new highs and 121 new lows on Friday.
While the number of new 52-week highs doubled from Friday, the number of new 52-week lows also increased substantially. More importantly, new lows continued to overwhelm new highs by roughly 5 to 1.
This means that Monday’s modest index gain should not be interpreted as a broad improvement in market health. The market’s internal indicators remained negative, although they did not deteriorate dramatically from Friday’s already weak levels.
Trading Volume Jumps
Trading activity increased significantly on Monday.
Total TSX volume reached 490,983,842 shares, compared with 369,593,467 shares on Friday—an increase of approximately 33%.
The combination of substantially higher volume and an almost unchanged index is worth watching. It indicates that there was considerably more market participation despite the lack of meaningful movement in the benchmark index.
For traders, this creates an interesting divergence: the headline index remained almost flat, but the market experienced considerably heavier trading activity and significant movement among individual sectors and stocks.
The Big Six Banks: The major Canadian banks were relatively subdued. Toronto-Dominion Bank (TD) gained 0.32%, while Bank of Nova Scotia (BNS)
.
The US Markets
Monday’s U.S. Market Indexes
All four major U.S. stock indexes declined on Monday, giving back some of the strength seen during Friday’s buoyant session. The Dow Jones Industrial Average fell 152.09 points, or 0.29%, to close at 52,421.20. The S&P 500 declined 37.00 points, or 0.48%, to 7,619.98, while the Nasdaq Composite dropped 146.62 points, or 0.56%, to 26,186.41. The Russell 2000 slipped 11.71 points, or 0.40%, to close at 2,892.24.

Monday’s decline was broad-based, with all four major indexes finishing lower. This suggests that Friday’s strong advance was, at least for now, more of a one-session rebound than the beginning of a sustained upward move.
Rising Bond Yields and Oil Prices Remain the Main Concerns
The two major issues confronting investors remain rising long-term bond yields and higher oil prices.
The continued increase in long-term Treasury yields is particularly important because higher yields raise borrowing costs and can place pressure on equity valuations. This is especially significant for companies whose valuations depend heavily on future earnings and for businesses that rely more heavily on borrowing to finance operations and growth.
The rise in oil prices adds another layer of concern. Higher energy costs can increase inflationary pressure and potentially complicate expectations for interest rates. Investors therefore have two important market forces to monitor: the direction of Treasury yields and the trajectory of crude oil prices.
Small-Cap Stocks Under Pressure
Small-cap stocks had another difficult session, with the Russell 2000 declining 0.40%.
The small-cap index remains particularly sensitive to rising borrowing costs because smaller companies generally have less access to inexpensive financing and can be more dependent on credit markets to fund operations and expansion.
Monday’s weakness in the Russell 2000 therefore provides another indication that higher long-term yields are becoming a meaningful headwind for smaller companies.
Technical Picture
The technical picture across the major indexes has weakened following Monday’s decline.
The Nasdaq Composite remains below its 25-day moving average and is now testing its 50-day moving average. This is an important level for traders because a decisive break below the 50-day average could signal additional short-term weakness.
The S&P 500 remains below its 25-day moving average but is still slightly above its 50-day moving average. The index is therefore sitting near an important technical decision point.
The Dow Jones and Russell 2000 are both below their 25-day and 50-day moving averages, indicating greater short-term technical weakness. However, both indexes remain clearly above their 200-day moving averages, meaning their longer-term technical structures have not yet been seriously damaged.
Key Takeaways for Traders and Investors
-
All four major U.S. indexes declined, indicating that Friday’s strong advance did not immediately translate into sustained momentum.
-
Bond yields remain the elephant in the room. Further increases in long-term Treasury yields could continue to pressure stock valuations.
-
Oil prices are another important risk factor. Rising energy prices could add to inflationary pressure and complicate the interest-rate outlook.
-
Small caps remain vulnerable. The Russell 2000’s 0.40% decline highlights the pressure that higher borrowing costs can place on smaller companies.
-
The 50-day moving averages are becoming increasingly important. The Nasdaq is testing its 50-day average, while the S&P 500 remains only slightly above its 50-day average.
-
The longer-term trend has not broken down yet. Despite short-term weakness, the Dow Jones and Russell 2000 remain comfortably above their 200-day moving averages.
Bottom Line
Monday’s session delivered a broad-based pullback across the U.S. equity market and effectively erased much of the optimism generated by Friday’s advance. The immediate concern for traders is whether the S&P 500 and Nasdaq can defend their 50-day moving averages.
For investors, the bigger picture remains mixed. The major indexes are showing short-term technical weakness, but most remain above their longer-term 200-day moving averages. Until Treasury yields stabilize and market indexes regain their shorter-term moving averages, a cautious approach appears warranted.
.
Monday’s U.S. Market Statistics
New York Stock Exchange (NYSE): Market breadth on the New York Stock Exchange was clearly negative on Monday, with declining issues substantially outnumbering advancing issues. There were 2,925 decliners, 1,625 advancers and 450 unchanged issues, producing a decliner-to-advancer ratio of approximately 1.80 to 1. In other words, there were roughly 18 declining stocks for every 10 advancing stocks.
The NYSE recorded 106 new 52-week highs and 541 new 52-week lows, compared with 90 new highs and 395 new lows on Friday. The number of new 52-week highs increased by approximately 18%, while new 52-week lows increased by approximately 37%. The ratio of new highs to new lows remained heavily skewed toward new lows, at roughly 1 new high for every 5 new lows.
The combination of negative breadth and a large number of stocks making new 52-week lows continues to signal weakness beneath the headline market indexes.
Total NYSE trading volume reached 5,108,150,028 shares, approximately 5.7% higher than the 4,830,935,176 shares traded on Friday. The increase in volume, combined with negative breadth, is another reason for traders to remain cautious.
The NYSE market internals remain weak. Although Friday brought some improvement following four consecutive sessions of weakness earlier last week, Monday did not produce the sustained positive breadth needed to reverse that deterioration. A single positive session is not enough to repair weakening market internals; traders should look for a streak of sessions with improving breadth before becoming more confident in the market’s underlying strength.
For traders, this environment calls for greater attention to position size, trade frequency and risk management. When market breadth is persistently negative, protecting trading capital becomes more important than forcing trades in unfavorable conditions.
NASDAQ: Market breadth was also negative on the NASDAQ. There were 2,783 decliners and 2,108 advancers, along with 397 unchanged issues, producing a decliner-to-advancer ratio of approximately 1.32 to 1. That translates to roughly six declining stocks for every five advancing stocks.
The NASDAQ recorded 63 new 52-week highs and 402 new 52-week lows, compared with 72 new highs and 327 new lows on Friday. The number of new highs declined by approximately 13%, while new 52-week lows increased by approximately 23%.
The imbalance between new highs and new lows remains particularly concerning. New 52-week highs represented only about 16% of the number of new 52-week lows, meaning that for every new high, there were more than six new lows.
This is a weak reading and reinforces the message coming from the broader market: the underlying condition of the NASDAQ remains fragile despite the fact that the headline index itself may not appear to be in a severe decline.
NASDAQ trading volume totaled 7,519,681,773 shares, approximately 10.7% higher than Friday’s 6,789,980,242 shares.
The combination of a declining NASDAQ, negative breadth and higher trading volume is worth noting. Essentially, Monday’s trading activity reversed much of the favorable volume pattern seen on Friday, bringing the market back toward the weaker condition observed following Thursday’s close.
Key Takeaways for Traders and Investors
- Market breadth was negative on both exchanges. Declining stocks substantially outnumbered advancing stocks on the NYSE and NASDAQ.
- New 52-week lows continue to dominate new highs. The NYSE recorded approximately five new lows for every new high, while the NASDAQ recorded more than six new lows for every new high.
- The deterioration in market internals remains a concern. Friday’s improvement was not followed by another strong breadth session on Monday.
- Higher volume accompanied Monday’s weakness. NYSE volume increased approximately 6%, while NASDAQ volume rose about 11%.
- The market needs a sustained improvement in breadth. Traders should look for several consecutive sessions of stronger advancer/decliner ratios and a narrowing gap between new highs and new lows before concluding that market internals are recovering.
- Risk management should take priority. In a market characterized by weak breadth and an expanding number of new lows, reducing position size, limiting trade frequency and being selective about entries may be preferable to aggressively pursuing marginal opportunities.
Bottom Line
Monday’s market statistics provide a cautionary message for traders and investors. Both the NYSE and NASDAQ experienced negative breadth, while new 52-week lows continued to overwhelm new highs. Trading volume also increased as the major indexes moved lower.
The most important issue is not Monday’s decline by itself, but the lack of sustained improvement in the market internals. Friday offered some encouragement after several weak sessions, but Monday failed to build on that improvement.
For now, the data suggest that traders should remain defensive and selective. The market needs a sustained streak of positive breadth, fewer new lows and stronger participation from advancing stocks before the underlying condition can be considered meaningfully improved.
Protecting capital should remain a priority while the market internals are sending a cautionary signal.
.
Monday’s U.S. Market Wrap-Up Report
The major U.S. stock indexes moved lower on Monday, but the declines were relatively modest, with none of the four major indexes falling more than 0.56%. The Dow Jones Industrial Average declined 0.29%, the S&P 500 fell 0.48%, the Nasdaq Composite dropped 0.56%, and the Russell 2000 slipped 0.40%.
While the headline declines were not severe, the underlying market statistics were considerably less encouraging. Market breadth was negative on both the NYSE and NASDAQ, and new 52-week lows continued to significantly outnumber new highs. This suggests that the market’s internal condition remains weaker than the relatively modest index declines might indicate.
The Fed and Bond Yields Remain the Market’s Biggest Drivers
The Federal Reserve’s upcoming meeting remains the most important potential market catalyst this week. While investors have developed expectations regarding the Fed’s next interest-rate decision, the actual decision will not be known until the announcement, followed by the Fed Chair’s press conference at approximately 2:00 p.m. on Wednesday.
For traders, the rate decision itself may be less important than the Fed’s guidance on the future path of interest rates. Any indication that rates could remain higher for longer may put additional pressure on equity valuations, particularly growth and technology stocks.
The bond market is already sending an important signal. The 10-year U.S. Treasury yield was around 5.031% at the time this report was prepared, according to the figures being monitored. Yields at these levels are significant because higher long-term rates increase borrowing costs and can make fixed-income investments more attractive relative to stocks.
The 10-year yield has not traded at these levels since the period around 2007, making the current interest-rate environment particularly important for investors.
The key question is whether stocks can continue to advance while long-term Treasury yields remain elevated. Market participants remain divided on that issue. For traders, the practical message is straightforward: keep a close eye on Treasury yields and be prepared to reduce exposure quickly if rising rates begin to accelerate selling pressure in equities.
Sector Performance Remains Weak
Monday was generally a difficult session across the major sectors. Only three of the eleven major sectors finished higher, indicating that the weakness was relatively broad.
Consumer Durables & Services was the strongest sector, gaining 1.46%, followed by Healthcare, which rose 1.28%, and Telecommunications Services, which advanced 0.83%.
Several important sectors moved sharply lower. Financials declined 0.83%, while Technology fell 0.93%. Basic Materials dropped 2.03%, and Utilities was the session’s weakest major sector, declining 2.43%.
The weakness in Technology is particularly noteworthy given the sector’s importance to the recent market rally.
Market Internals Send a Cautionary Signal
The market internals were not supportive of the major indexes on Monday.
On the NYSE, 2,925 stocks declined compared with 1,625 advancing stocks, producing a decliner-to-advancer ratio of approximately 1.80 to 1.
The NYSE also recorded 106 new 52-week highs versus 541 new 52-week lows. On the NASDAQ, there were 63 new highs and 402 new lows.
The imbalance between new highs and new lows is particularly concerning. New lows outnumbered new highs by approximately 5 to 1 on the NYSE and more than 6 to 1 on the NASDAQ.
Trading volume also increased. NYSE volume was approximately 6% higher, while NASDAQ volume increased by approximately 11% compared with Friday.
Taken together, the data indicate that Monday’s relatively small index declines do not tell the entire story. The underlying market remained under pressure, with negative breadth, a large number of new lows and higher trading activity.
For traders, this is a reason to remain selective rather than interpret the relatively modest index declines as evidence that the market is healthy.
Cybersecurity Stocks Stand Out
One of the more interesting pockets of strength on Monday was cybersecurity.
While much of the technology complex struggled, several cybersecurity stocks posted substantial gains amid renewed investor interest in the sector and concerns surrounding the pace and direction of further AI development.
Fortinet (FTNT) gained 9.04%, while Rubrik (RBRK) surged 15.64% and SentinelOne (S) advanced 14.48%.
These moves demonstrate an important feature of the current market: even when the broader technology sector is weak, individual groups and stocks can attract significant buying interest.
For short-term traders, cybersecurity is therefore a group worth monitoring for continued relative strength, particularly if these stocks can maintain their gains in subsequent sessions.
Semiconductors Remain Under Pressure
Semiconductor stocks continued to struggle on Monday, extending their weakness into a second consecutive session.
Micron Technology (MU) declined 5.25%, closing at $924.03, with approximately 27.1 million shares changing hands. SanDisk (SNDK) fell 4.98%, closing at $1,551.99, with approximately 9.6 million shares traded.
Weakness in semiconductor stocks deserves attention because the group is an important component of the technology and AI investment story. Continued selling across semiconductor stocks could become a broader concern for technology investors if the weakness spreads to other AI-related companies.
At the same time, the strong performance of selected cybersecurity names demonstrates that money is still rotating within technology rather than simply leaving the entire sector.
Individual Stock Moves
Microsoft (MSFT) was a notable exception within the technology space, gaining approximately 2% on Monday.
By contrast, Hewlett Packard Enterprise (HPE), which had performed strongly on Friday, suffered a sharp reversal, falling 10.8% on Monday.
The contrasting performances reinforce the importance of stock selection in the current environment. Strong performance in one session does not necessarily guarantee follow-through in the next, particularly when the broader market is dealing with elevated interest rates and weak internal indicators.
Key Takeaways for Traders and Investors
-
The major indexes declined modestly, but the underlying market was considerably weaker. Negative breadth and the dominance of new lows point to continued internal weakness.
-
The Fed is the week’s biggest potential market catalyst. Wednesday’s rate decision and the Fed Chair’s subsequent comments could produce significant volatility.
-
Watch the 10-year Treasury yield closely. A continued move higher could put additional pressure on equity valuations, especially growth-oriented stocks.
-
The market needs sustained improvement in breadth. One or two positive sessions are unlikely to repair the recent deterioration. Traders should look for a sustained increase in advancing stocks and a reduction in the number of new 52-week lows.
-
Technology remains vulnerable. The sector declined 0.93%, while semiconductor stocks experienced another weak session.
-
Cybersecurity is showing relative strength. Fortinet, Rubrik and SentinelOne all posted substantial gains and are worth monitoring for continued momentum.
-
Small caps remain sensitive to higher rates. The Russell 2000 fell 0.40% and remains below both its 25-day and 50-day moving averages.
-
The technical picture remains mixed. The Nasdaq is below its 25-day average and testing its 50-day average, while the S&P 500 remains below its 25-day average but slightly above its 50-day average. The Dow and Russell 2000 remain below both their 25-day and 50-day averages but are still clearly above their 200-day averages.
Bottom Line
Monday’s session was not a disaster for the major indexes, but the market internals remain concerning. The relatively small index declines could easily give investors a false sense of stability, while the large number of new 52-week lows and negative breadth indicate that significant weakness continues beneath the surface.
The market now enters an important part of the week with the Federal Reserve’s decision and press conference ahead. At the same time, the 10-year Treasury yield remains elevated and oil prices are adding another potential source of inflationary pressure.
For traders, capital preservation and selectivity remain important. Rather than assuming that Friday’s rebound has established a new upward trend, traders should watch the 50-day moving averages, Treasury yields, market breadth and the new-high/new-low figures for confirmation.
Until those indicators begin to improve consistently, the market environment remains better suited to disciplined, selective trading than aggressive positioning.
.
NOTICE TO READERS
The Canadian Vanguard Stock Market is about empowering you to build and manage your wealth by yourself. There is certainly no magic in managing finances or wealth but one needs to know what to do and commit to doing what is needed. When you are ready to start the journey to Take Charge and Put Your Destiny In Your Own Hands, start with reading The Canadian Vanguard every market day. If and when you need more related information or to advertise your business products or services in The Canadian Vanguard, Contact Us
Our readers are strongly advised to conduct their own research into individual stocks before making a purchase decision. In addition, investors are advised that past stock performance is no guarantee of future price appreciation. Any recommendation is not a guarantee of any particular stock’s future prices, and The Canadian Vanguard accepts no responsibility or liability for investors’ or readers’ purchases.
Stocks In The News/ Stocks To Watch and Market Strategy will soon be available only to Paying Subscribers. The dollar sign “$” in the Toronto Market section in the articles only stands for Canadian dollar and in the US market section “$” stands for US dollar.
(c) This article is published by The Canadian Vanguard on September 14, 2026