







Markets Rebound as Semiconductor Stocks Lead Technology Rally
The Canadian Vanguard Stock Market Report Thursday July 9, 2026 Edition
.
The Toronto Market
.
Thursday’s Toronto Market Index Commentary
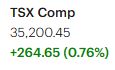
The S&P/TSX Composite Index advanced 264.65 points, or 0.76%, and closed at 35,200.45, delivering a strong technical performance and extending the market’s recent upward momentum.
The index opened modestly above Wednesday’s close and traded firmly in positive territory throughout the session. Price action was characterized by a steady, low-volatility advance, with buyers maintaining control from the opening bell. Aside from a modest pullback during the final hour of trading, the TSX posted consistent gains throughout the day, reflecting broad-based buying interest and improving investor sentiment.
From a technical perspective, Thursday’s rally pushed the TSX back above the psychologically important 35,000 level while also reclaiming its 25-day, 50-day, and 200-day moving averages. Regaining these key technical levels strengthens the market’s intermediate-term outlook and suggests that bullish momentum continues to build. Traders will now be watching to see whether the index can hold above these moving averages and build on today’s breakout in the sessions ahead.
Thursday’s TSX Market Statistics
Market breadth on the TSX was decisively positive, with advancing issues outpacing declining issues by a wide margin. A total of 1,568 stocks advanced, compared with 578 decliners and 122 unchanged issues, producing an advancer-to-decliner ratio of 2.50:1—equivalent to approximately five advancing stocks for every two declining stocks.
Market internals also improved significantly. The TSX recorded 62 new 52-week highs versus just 13 new 52-week lows, a notable improvement from Wednesday’s session, when 49 stocks posted new highs and 51 registered new lows. The widening spread between new highs and new lows reinforces the strength of Thursday’s advance and suggests that buying interest was broadly distributed across the market.
Total trading volume reached 387.6 million shares, down 12% from the 437.4 million shares traded in the previous session. While stronger advances are generally accompanied by rising volume, Thursday’s lower turnover does not materially detract from the quality of the rally. The TSX gained nearly 0.80% on broad-based participation, reversing the negative market breadth recorded over the previous two sessions.
Taken together, the positive breadth, the strong ratio of new highs to new lows, and the index’s recovery above key technical levels suggest that the weakness seen over the past two sessions was more consistent with a normal pullback than the beginning of a broader market reversal. Although higher trading volume would have provided additional confirmation of the move, the market’s internal strength remains constructive.
As always, investors should resist the temptation to predict short-term market direction. A more disciplined approach is to identify emerging trends early, confirm them with market internals and technical indicators, and position portfolios accordingly.
.
The US Markets
Thursday’s U.S. Market Commentary
U.S. equities staged a broad-based rebound on Thursday following Wednesday’s sharp selloff, with all four major equity indexes closing higher. The Dow Jones Industrial Average gained 139.02 points, or 0.27%, to finish at 52,487.41. The S&P 500 advanced 60.93 points, or 0.81%, closing at 7,543.64, while the Nasdaq Composite led the major indexes with a gain of 336.24 points, or 1.30%, to end the session at 26,206.89. The Russell 2000 Index also posted a strong performance, rising 36.15 points, or 1.22%, to close at 2,956.39.

Investor sentiment improved markedly throughout the session as buyers returned following the previous day’s profit-taking. Technology shares led the advance, with semiconductor stocks providing much of the market’s leadership. The strength in the semiconductor sector helped propel the Nasdaq Composite sharply higher, reflecting renewed demand for growth-oriented equities and continued investor confidence in the technology sector.
The Dow Jones Industrial Average traded with solid gains early in the session before surrendering part of its advance during afternoon trading. Nevertheless, the blue-chip index maintained positive momentum and closed comfortably in positive territory, indicating continued resilience among large-cap stocks.
From a technical perspective, the rebound reinforces the constructive intermediate-term outlook for U.S. equities. The Nasdaq Composite has reclaimed its 25-day moving average and continues to trade comfortably above both its 50-day and 200-day moving averages, signaling that the prevailing upward trend remains intact. Meanwhile, the Dow Jones Industrial Average also remains above its key 25-day, 50-day, and 200-day moving averages, confirming that the broader technical backdrop continues to favor the bulls despite recent market volatility.
Thursday’s recovery suggests that Wednesday’s decline was more consistent with a healthy pause within an ongoing uptrend than the beginning of a sustained correction. Market participants will now look for follow-through buying in the coming sessions to confirm that bullish momentum has reasserted itself.
Thursday’s U.S. Market Statistics
New York Stock Exchange (NYSE): Market breadth on the NYSE turned decisively positive on Thursday, reflecting broad participation in the market’s rebound. Advancing issues totaled 3,028, compared with 1,433 declining issues and 426 unchanged stocks, producing an advancer-to-decliner ratio of 2.11:1, or approximately two advancing stocks for every decliner.
The exchange recorded 167 new 52-week highs and 51 new 52-week lows, a significant improvement from Wednesday’s session, when only 78 stocks reached new highs while 176 registered new lows. The sharp reversal in these market internals indicates that buying interest returned across a wide range of sectors following the previous day’s broad-based selling.
NYSE trading volume totaled 4.65 billion shares, down 12% from Wednesday’s 5.26 billion shares. Although turnover declined, the strength of market breadth and the substantial improvement in the ratio of new highs to new lows suggest that Thursday’s advance was supported by healthy underlying participation. The number of new 52-week highs returned to a level more consistent with recent trading activity, while new lows retreated to a more typical range, reinforcing the view that Wednesday’s deterioration in market internals was largely a function of that session’s heavy selling pressure rather than the start of a sustained weakening trend.
NASDAQ: Market internals also strengthened on the NASDAQ, where advancing issues comfortably outnumbered declining issues. A total of 3,348 stocks advanced, while 1,537 declined and 371 were unchanged, resulting in an advancer-to-decliner ratio of 2.18:1—again, approximately two advancing stocks for every declining stock.
The exchange recorded 124 new 52-week highs and 105 new 52-week lows, compared with 71 new highs and 217 new lows in the previous session. Although the number of new highs remains below the levels typically seen during periods of strong market leadership, Thursday’s improvement represents a meaningful recovery from Wednesday’s unusually weak readings. At the same time, the sharp decline in new 52-week lows signals a broad improvement in underlying market strength.
NASDAQ trading volume totaled 7.52 billion shares, representing an 8% decline from Wednesday’s 8.16 billion shares. While trading activity was lighter despite the index’s strong advance, lower volume following a volatile session is not uncommon as investors reassess market conditions. Daily NASDAQ volume has recently averaged between approximately 9.5 and 10.5 billion shares, suggesting that participation remains somewhat below normal levels. This may indicate that some investors are waiting for recent market volatility to subside before committing additional capital.
Overall, Thursday’s market statistics paint a constructive picture. Both the NYSE and NASDAQ recorded strong positive market breadth, a substantial improvement in the balance of new highs versus new lows, and broad participation across advancing issues. Although trading volume eased on both exchanges, the improvement in market internals supports the view that Thursday’s rally was broad-based and that the weakness experienced during the previous session was more likely a normal corrective pullback than the beginning of a sustained downtrend. Continued strength in breadth and improving trading volume over the coming sessions would provide additional confirmation that the broader uptrend remains intact.
.
NOTICE TO READERS
The Canadian Vanguard Stock Market is about empowering you to build and manage your wealth by yourself. There is certainly no magic in managing finances or wealth but one needs to know what to do and commit to doing what is needed. When you are ready to start the journey to Take Charge and Put Your Destiny In Your Own Hands, start with reading The Canadian Vanguard every market day. If and when you need more related information or to advertise your business products or services in The Canadian Vanguard, Contact Us
Our readers are strongly advised to conduct their own research into individual stocks before making a purchase decision. In addition, investors are advised that past stock performance is no guarantee of future price appreciation. Any recommendation is not a guarantee of any particular stock’s future prices, and The Canadian Vanguard accepts no responsibility or liability for investors’ or readers’ purchases.
Stocks In The News/ Stocks To Watch and Market Strategy will soon be available only to Paying Subscribers. The dollar sign “$” in the Toronto Market section in the articles only stands for Canadian dollar and in the US market section “$” stands for US dollar.
(c) This article is published by The Canadian Vanguard on July 9, 2026



