




The Canadian Vanguard Stock Market Report, Weekend July 17 – 19, 2026 Edition
Technology Selloff and Geopolitical Tensions Keep Markets Under Pressure
.
The Canadian Vanguard Stock Market Report is updated regularly during the weekend.
.
Sunday Evening News Update! – Futures are little changed but up Sunday evening. – Sunday 11:30 pm ET.
.
The Toronto Market (as at Friday Market Close)
Friday’s Toronto Market Index
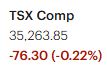
The S&P/TSX Composite Index declined 76.30 points (-0.22%) on Friday to close at 35,263.85.
The index opened sharply lower, down nearly 200 points, as technology stocks—particularly semiconductor names—extended their recent selloff. Selling pressure eased as the session progressed, allowing the TSX to recover much of its early losses. The index briefly tested the previous day’s closing level but was unable to break above it, ultimately finishing well above the session low. The price action closely mirrored Thursday’s trading pattern.
From a technical perspective, the TSX continues to hold above the key psychological support level of 35,000. More importantly, the index remains above its 25-day, 50-day, and 200-day moving averages, indicating that the intermediate- and long-term uptrend remains intact despite the recent pullback.

Friday’s TSX Market Statistics
Market breadth remained negative on Friday, with declining issues continuing to outpace advancing issues. The TSX recorded 1,405 decliners versus 740 advancers, resulting in a decliner-to-advancer ratio of 1.90:1, while 147 issues finished unchanged.
The exchange also recorded 155 new 52-week highs and 61 new 52-week lows, compared with 160 new highs and 56 new lows on Thursday. Although market internals remained weak, they showed little deterioration from the previous session, suggesting that selling pressure may be stabilizing rather than accelerating.
Total trading volume reached 401.1 million shares, up about 4% from Thursday’s 386.1 million shares. While the increase in volume accompanied a negative breadth reading, it was not significant enough to indicate broad institutional selling or a meaningful shift in market sentiment.
Overall, Friday’s market statistics closely resembled Thursday’s, pointing to a market that remains under modest pressure but is beginning to consolidate rather than weaken further.
.
Friday’s Toronto TSX Market Wrap-Up Report
The S&P/TSX Composite Index declined 76.30 points (-0.22%) on Friday to close at 35,263.85. After opening nearly 200 points lower on continued weakness in technology shares—particularly semiconductor stocks—the market recovered much of its early losses before finishing well above the session low. The trading pattern closely resembled Thursday’s session, suggesting that while sellers remain active, downside momentum is beginning to moderate.
From a technical standpoint, the TSX continues to hold above the important psychological support level of 35,000. More significantly, the index remains above its 25-day, 50-day, and 200-day moving averages, indicating that the intermediate- and long-term bullish trend remains intact despite the recent pullback.
Market internals were also largely unchanged from Thursday. Declining issues outnumbered advancing issues by 1.90 to 1 (1,405 decliners versus 740 advancers), while total trading volume increased modestly to 401.1 million shares. Although market breadth remained negative, the absence of further deterioration in breadth or a significant increase in volume suggests that selling pressure is stabilizing rather than accelerating.
Sector Performance
Four of the ten major TSX sectors finished higher on Friday.
- Energy: +1.13%
- Healthcare: +0.75%
- Utilities: +0.52%
- Consumer Staples: +0.26%
Among the weaker sectors:
- Consumer Discretionary: -0.17%
- Financials: -0.42%
- Basic Materials: -0.45%
- Technology: -1.32%
Technology remained the market’s weakest-performing sector for a third consecutive session as investors continued reducing exposure to growth-oriented stocks.
On a weekly basis, seven of the ten major sectors posted gains. Energy led with a 3.09% advance, followed by Telecommunications Services (+2.57%), Consumer Staples (+1.91%), and Financials (+0.97%). Basic Materials was the weakest sector, falling 6.15%, while Technology declined 0.64%.
Rotation Continues Beneath the Surface
Sector rotation remains one of the market’s defining themes. Investors continue shifting capital away from higher-valuation technology stocks and into more defensive and value-oriented sectors, particularly Financials and Energy.
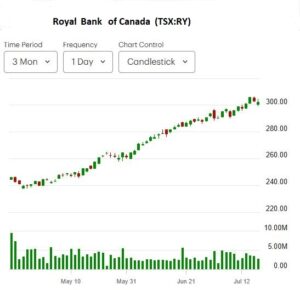
Canadian banks have been notable beneficiaries of this rotation. The strong advance in several large-cap financial stocks over the past three months has produced price charts that resemble those of traditional growth stocks. Royal Bank of Canada is a prime example, reflecting sustained institutional demand despite the broader weakness in technology.
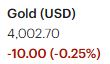
Meanwhile, higher crude oil prices continue to provide an important tailwind for the TSX. Rising oil prices generally support both upstream producers and downstream energy companies, helping offset weakness in other sectors and contributing to the Canadian market’s relative resilience compared with many global equity markets.
Stocks to Watch
Construction and energy-related companies continue to outperform.
Notable movers on Friday included:
- Aecon Group Inc. (+2.70%) on approximately 352,000 shares traded.
- Methanex Corp. (+2.70%) on roughly 170,000 shares traded.
- Suncor Energy Inc. (+2.60%) on approximately 3.7 million shares traded.
By contrast, Basic Materials stocks—which were among the market’s strongest performers earlier this year—have lost momentum amid changing commodity trends and geopolitical developments. Companies such as Agnico Eagle Mines are now underperforming after leading the market for several months.
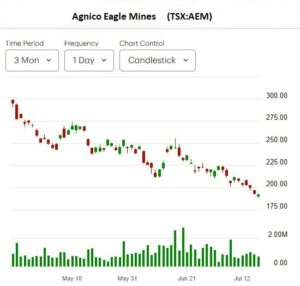
Market leadership is constantly evolving. Sectors and stocks that lag today often become tomorrow’s leaders as capital rotates across the market. Maintaining a well-prepared watchlist of quality companies can help traders and investors identify emerging leadership before a new trend becomes widely recognized.
.
Key Takeaways for Traders and Investors
- The TSX continues to demonstrate resilience despite three consecutive sessions of technology-led weakness.
- Holding above the 35,000 level and all major moving averages keeps the broader technical outlook constructive.
- Negative market breadth remains a cautionary signal, but the lack of further deterioration suggests the market may be entering a period of consolidation rather than the start of a deeper correction.
- Energy remains the market’s leadership sector, supported by higher crude oil prices.
- Financials continue attracting capital as investors rotate away from technology, making Canada’s large-cap banks an important group to monitor.
- Traders should continue focusing on relative strength, sector rotation, and improving market breadth for confirmation of the next directional move.
.
The US Markets (as at Friday Market Close)
.
Friday’s U.S. Market Indexes
U.S. equities closed broadly lower on Friday as heavy selling in semiconductor stocks extended into a second consecutive session, weighing on the broader technology sector.
- Dow Jones Industrial Average: -406.55 points (-0.77%) to 52,146.42
- S&P 500: -76.08 points (-1.01%) to 7,457.69
- Nasdaq Composite: -361.70 points (-1.40%) to 25,520.24
- Russell 2000: -12.35 points (-0.42%) to 2,962.22

The Dow Jones Industrial Average opened sharply lower and spent most of the session in negative territory. Although it briefly moved into positive territory around midday, the rebound quickly faded, and the index finished near the lower end of its intraday trading range.
Technology remained the market’s weakest area. Semiconductor stocks experienced another round of aggressive selling following Thursday’s decline, while companies tied to AI infrastructure—including the optoelectronics industry—also came under significant pressure. The continued weakness suggests that investors remain cautious toward some of the market’s highest-valued technology names.
.
Technical Outlook
Despite Friday’s decline, the Dow Jones Industrial Average remains technically constructive, holding above its 25-day, 50-day, and 200-day moving averages.
The Russell 2000 slipped on Friday but continues to trade slightly above its 25-day moving average and comfortably above its 50-day and 200-day moving averages, indicating that the broader uptrend in small-cap stocks remains intact.
The S&P 500 has now fallen below its 25-day moving average but remains above both its 50-day and 200-day moving averages. This points to weakening short-term momentum while leaving the intermediate- and long-term uptrend intact.
The Nasdaq Composite presents the weakest technical picture among the major indexes. Following two consecutive sessions of technology-led selling, the index has fallen below both its 25-day and 50-day moving averages while continuing to hold above its 200-day moving average. A break below the 50-day moving average often signals that institutional investors are becoming more defensive, increasing the risk of additional volatility in growth-oriented sectors.
.
Market Rotation
Recent price action suggests that institutional investors continue rotating capital away from higher-valuation technology stocks, particularly semiconductor companies, and into more defensive and value-oriented sectors. While this does not necessarily signal the end of the broader bull market, it indicates that market leadership is shifting.
For traders, relative strength has become increasingly important. Sectors attracting institutional buying are generally offering stronger risk-adjusted opportunities than those experiencing persistent distribution.
.
Key Takeaways for Traders and Investors
- Friday’s decline was driven primarily by continued weakness in semiconductor and AI-related technology stocks.
- The Nasdaq has weakened the most technically after falling below both its 25-day and 50-day moving averages, warranting increased caution in technology-focused trading.
- The Dow Jones remains the strongest of the major indexes from a technical perspective, while the S&P 500 and Russell 2000 continue to maintain constructive intermediate-term trends.
- Current market action points to ongoing sector rotation rather than broad-based market liquidation.
- Until technology stocks begin reclaiming key moving averages and market leadership stabilizes, traders may benefit from focusing on sectors demonstrating relative strength while maintaining disciplined risk management.
.
Friday’s U.S. Market Statistics
New York Stock Exchange (NYSE): Market breadth remained negative for a second consecutive session as declining issues continued to outnumber advancing issues. The NYSE recorded 2,919 decliners versus 1,505 advancers, with 443 issues unchanged, producing a decliner-to-advancer ratio of approximately 1.94:1.
The exchange posted 258 new 52-week highs and 180 new 52-week lows, compared with 351 new highs and 170 new lows on Thursday. Although new highs continued to exceed new lows, the margin narrowed noticeably, reflecting weaker underlying market participation.
Total NYSE trading volume was 5.39 billion shares, modestly lower than 5.47 billion shares traded on Thursday. The slight decline in volume suggests that Friday’s weakness was not accompanied by a significant increase in institutional selling pressure.
Overall, market internals weakened modestly from the previous session. While breadth remained negative and the number of new highs declined, new highs still outnumbered new lows, indicating that longer-term market leadership has not yet been broadly disrupted.
NASDAQ: NASDAQ market internals deteriorated further as weakness in technology and semiconductor stocks weighed heavily on market breadth.
Declining issues totaled 3,121, compared with 1,760 advancing issues, with 193 stocks unchanged, resulting in a decliner-to-advancer ratio of approximately 1.77:1. Friday marked a return to negative market breadth following two consecutive positive sessions. Over the past six trading days, the NASDAQ has recorded four sessions of negative breadth and two positive sessions, reflecting increasingly mixed internal market conditions.
The exchange recorded 139 new 52-week highs and 278 new 52-week lows, compared with 249 new highs and 235 new lows on Thursday. The sharp decline in new highs, combined with an increase in new lows, points to weakening momentum across the technology sector. However, one trading session alone does not establish a new trend, and additional confirmation will be needed over the coming days.
NASDAQ trading volume totaled 8.07 billion shares, down approximately 6% from 8.57 billion shares on Thursday. The lighter volume suggests that, despite continued selling pressure, Friday did not exhibit the characteristics of widespread institutional liquidation.
Key Takeaways for Traders and Investors
- Market breadth remained negative on both the NYSE and NASDAQ, confirming that Friday’s weakness extended beyond the major indexes.
- The deterioration in NASDAQ internals was more pronounced, reflecting continued selling in semiconductor and AI-related technology stocks.
- Although the number of new 52-week highs declined on both exchanges, the NYSE still recorded more new highs than new lows, indicating that leadership remains intact in parts of the broader market.
- Trading volume was generally lighter or little changed, suggesting that institutional selling has not yet intensified into broad market distribution.
- Traders should continue monitoring market breadth, new highs versus new lows, and sector rotation. A sustained improvement in these indicators would provide stronger confirmation that the current pullback is stabilizing, while further deterioration would increase the probability of a deeper correction.
Friday’s U.S. Market Wrap-Up Report
U.S. equities closed broadly lower on Friday as another wave of selling in semiconductor and AI-related technology stocks weighed on the major indexes. The Dow Jones Industrial Average fell 0.77%, the S&P 500 declined 1.01%, the Nasdaq Composite dropped 1.40%, and the Russell 2000 lost 0.42%.
Although the selling was concentrated in technology, market weakness broadened during the session. Both the NYSE and NASDAQ recorded a second consecutive day of negative market breadth, confirming that Friday’s decline extended beyond a handful of large-cap technology stocks. Nevertheless, trading volume remained relatively subdued, suggesting the selling has not yet developed into broad institutional distribution.
Sector Performance
Energy was the only major sector to finish higher on Friday, continuing to benefit from firm crude oil prices.
Friday’s sector performance:
- Energy: Positive
- Utilities: -0.21%
- Basic Materials: -0.71%
- Financials: -0.81%
- Technology: -1.37%
- Consumer Discretionary: -1.42% (weakest sector)
Nine of the eleven major sectors closed lower, underscoring the broad-based nature of Friday’s pullback.
For the week, however, market leadership remained relatively concentrated.
- Energy: +4.61%
- Consumer Staples: +1.38%
- Communication Services: +0.79%
- Financials: +0.47%
The weakest weekly performers were:
- Industrials: -3.03%
- Technology: -3.50%
Technology has now become the market’s weakest area as institutional investors continue rotating away from many of the sector’s highest-valued names.
Technical Outlook
The technical picture has become increasingly mixed.
The Dow Jones Industrial Average remains above its 25-day, 50-day, and 200-day moving averages, preserving its intermediate- and long-term uptrend.
The S&P 500 has slipped below its 25-day moving average but continues to hold above its 50-day and 200-day moving averages, suggesting that short-term momentum has weakened while the broader trend remains constructive.
The Nasdaq Composite has deteriorated the most technically. Following two consecutive sessions of heavy selling, it has fallen below both its 25-day and 50-day moving averages while remaining above the 200-day moving average. This shift increases short-term risk for growth-oriented technology stocks and suggests that traders should remain selective until technical conditions improve.
Market Internals
NYSE market breadth remained negative, with decliners outnumbering advancers by nearly 2-to-1. Although new 52-week highs continued to exceed new lows, the gap narrowed from Thursday, indicating some loss of upside momentum.
NASDAQ internals weakened more noticeably. New 52-week lows exceeded new highs, reflecting continued deterioration across semiconductor, AI infrastructure, and growth-oriented technology stocks.
Importantly, neither exchange experienced a meaningful increase in trading volume, suggesting that institutional selling, while evident, has not yet intensified into widespread liquidation.
Rotation into Financials Shows Signs of Pausing
One of this year’s strongest market themes has been the rotation out of high-growth technology stocks and into Financials and other value-oriented sectors. Friday’s session showed that even this leadership group was not immune to profit-taking.
Among the major banks:
- Goldman Sachs Group declined 2.70%.
- Wells Fargo fell 0.62%.
- JPMorgan Chase slipped 0.57%.
- Citigroup lost 1.78%.
Despite Friday’s pullback, several large U.S. banks recently reached fresh 52-week highs, highlighting that the longer-term trend for the sector remains constructive. At this stage, the weakness appears more consistent with normal profit-taking after a strong advance than with a deterioration in the sector’s overall technical outlook.
AI Infrastructure Remains Under Pressure
The market’s weakest area continues to be semiconductor, AI infrastructure, and optical networking stocks.
Representative moves on Friday included:
- Fabrinet (FN): +4.00%
- Lumentum Holdings (LITE): +3.76%
- Ciena (CIEN): -3.74%
- Corning (GLW): -2.40%
Although individual stocks posted mixed performances, many companies across the AI infrastructure and optical networking industries continue to trade below their key moving averages. Weak technical structures often indicate that institutional demand has diminished, increasing the likelihood of higher volatility until buyers regain control.
This does not necessarily diminish the long-term investment case for artificial intelligence. Rather, it reflects a period of consolidation following a prolonged advance. Market leadership frequently rotates, and today’s laggards can become tomorrow’s leaders once technical conditions begin to improve.
Key Takeaways for Traders and Investors
- Friday’s weakness was driven primarily by continued selling in semiconductor and AI-related technology stocks, but negative market breadth showed that the decline broadened across the market.
- The Nasdaq remains the weakest major index technically after falling below both its 25-day and 50-day moving averages.
- The Dow Jones continues to display the strongest technical profile, while the S&P 500 maintains a constructive intermediate-term trend despite weakening short-term momentum.
- Energy remains the market’s leadership sector, supported by higher oil prices, while Financials continue to outperform on a relative basis despite Friday’s profit-taking.
- Market breadth has weakened over the past two sessions, but relatively stable trading volume suggests the market is experiencing sector rotation and consolidation rather than broad institutional liquidation.
- Traders should remain disciplined, focus on sectors exhibiting relative strength, and monitor market breadth and trading volume closely for confirmation that technology stocks are beginning to stabilize before increasing exposure to higher-risk growth names.
NOTICE TO READERS
The Canadian Vanguard Stock Market is about empowering you to build and manage your wealth by yourself. There is certainly no magic in managing finances or wealth but one needs to know what to do and commit to doing what is needed. When you are ready to start the journey to Take Charge and Put Your Destiny In Your Own Hands, start with reading The Canadian Vanguard every market day. If and when you need more related information or to advertise your business products or services in The Canadian Vanguard, Contact Us
Our readers are strongly advised to conduct their own research into individual stocks before making a purchase decision. In addition, investors are advised that past stock performance is no guarantee of future price appreciation. Any recommendation is not a guarantee of any particular stock’s future prices, and The Canadian Vanguard accepts no responsibility or liability for investors’ or readers’ purchases.
Stocks In The News/ Stocks To Watch and Market Strategy will soon be available only to Paying Subscribers. The dollar sign “$” in the Toronto Market section in the articles only stands for Canadian dollar and in the US market section “$” stands for US dollar.
(c) This article is published by The Canadian Vanguard on July 19, 2026