







Major Indexes Retreat as Semiconductor Stocks Extend Selloff
The Canadian Vanguard Stock Market Report Thursday July 16, 2026 Edition
.
The Toronto Market
Thursday’s Toronto Market Index
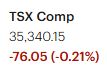
The S&P/TSX Composite Index slipped 76.05 points, or 0.21%, to close at 35,340.15.
The TSX produced an interesting trading pattern during Thursday’s session as it encountered resistance near the 35,473 level. The index opened lower, extended its losses by nearly 200 points, and then staged a strong rebound to briefly retest the previous session’s closing level before pulling back once again. Despite remaining in negative territory throughout the day, the index finished well above its session low.
Buying interest strengthened during the final half hour of trading, lifting the TSX sharply from its intraday lows. While the late-session rally was not enough to push the index into positive territory, it demonstrated continued investor support.
From a technical perspective, the TSX remains in a constructive position. The index continues to trade comfortably above the key psychological 35,000 level, as well as above its 25-day, 50-day, and 200-day moving averages, suggesting that the broader uptrend remains intact despite the day’s modest decline.

Thursday’s TSX Market Statistics
Market breadth weakened on Thursday as declining issues outpaced advancing issues on the Toronto Stock Exchange. There were 1,320 declining issues compared with 852 advancing issues, while 159 issues closed unchanged. This produced a decliner-to-advancer ratio of 1.55:1, meaning that for approximately every two stocks that advanced, three stocks declined. The negative market breadth reflected the TSX’s modest pullback during the session.
Despite the weaker breadth, the market continued to generate a healthy number of stocks reaching new highs. The TSX recorded 160 new 52-week highs and 56 new 52-week lows, compared with 179 new highs and 34 new lows in the previous session. Although the ratio of new highs to new lows narrowed from yesterday, new highs still outnumbered new lows by nearly 3-to-1. This suggests that, while short-term profit-taking emerged across the broader market, leadership among stronger stocks remains intact.
It is important not to place too much emphasis on a single day’s market statistics. Breadth indicators and new high/new low data are most meaningful when monitored over several trading sessions or weeks. At present, the underlying market continues to display resilience despite Thursday’s modest decline.
Trading activity remained steady throughout the session. Total TSX share volume reached 386.1 million shares, approximately 4% higher than the 372.0 million shares traded in the previous session. The increase in volume was relatively modest and remained well within normal daily trading ranges. Combined with the TSX’s relatively small decline and late-session buying interest, the volume profile does not indicate widespread institutional selling or panic liquidation.
From a technical perspective, the TSX remains in a constructive position. Although the index closed modestly lower, it continues to trade comfortably above the important 35,000 psychological level and remains above its 25-day, 50-day, and 200-day moving averages, indicating that the intermediate- and longer-term uptrend remains intact.
Key Takeaways for Traders and Investors
- Short-term market breadth weakened, as declining stocks outnumbered advancing stocks, suggesting some near-term consolidation following the market’s recent gains.
- Market leadership remains healthy, with new 52-week highs continuing to significantly exceed new lows, indicating that many leading stocks remain in established uptrends.
- Trading volume was normal, providing little evidence of aggressive institutional distribution despite the negative session.
- Late-session buying interest demonstrated that buyers remain willing to step in on intraday weakness, a constructive sign for overall market sentiment.
- The primary trend remains bullish. As long as the TSX continues to hold above key moving averages and the 35,000 level, the broader technical outlook remains favourable. Traders should continue monitoring market breadth, volume, and the new highs/new lows relationship for early signs of either strengthening momentum or a more meaningful deterioration in market internals.
.
The US Markets
.
Thursday’s U.S. Market Indexes
U.S. equity markets closed broadly lower on Thursday, with technology stocks leading the decline. The Dow Jones Industrial Average fell 105.67 points (0.20%) to 52,552.97. The S&P 500 declined 38.63 points (0.51%) to 7,533.77, while the Nasdaq Composite slumped 387.28 points (1.47%) to 25,881.95, making it the weakest of the major indexes. The Russell 2000 Index slipped 1.69 points (0.06%) to finish at 2,976.26.

Technology stocks, particularly semiconductor companies, came under heavy selling pressure throughout the session. The Dow Jones Industrial Average opened higher but gradually lost momentum, turning negative by midday before closing well below its intraday high. The Nasdaq Composite significantly underperformed the broader market as investors aggressively reduced exposure to semiconductor and AI-related technology stocks. AI infrastructure companies, including many firms in the optoelectronics industry, also experienced broad-based selling.
From a technical perspective, the broader market remains in a constructive position despite Thursday’s weakness. The Dow Jones Industrial Average and the S&P 500 continue to trade comfortably above their 21-day, 50-day, and 200-day moving averages, indicating that their primary uptrends remain intact. The Russell 2000 also remains technically healthy, trading slightly above its 21-day moving average and well above its 50-day and 200-day moving averages.
The Nasdaq Composite experienced the sharpest decline among the major indexes. Although it remains above its 50-day and 200-day moving averages, the index is now testing, or straddling, its 25-day moving average, making this an important level to monitor in the coming sessions. A decisive break below this level could signal additional short-term weakness in growth-oriented technology stocks.
Thursday’s trading reflected a noticeable sector rotation away from high-growth technology shares. Many AI infrastructure and semiconductor stocks posted sizeable losses as investors locked in profits following their recent strong advances. Performance among large-cap technology companies was mixed. Apple Inc. gained 1.76% on trading volume of approximately 63 million shares, while IBM advanced 3.72% on 22.5 million shares. In contrast, Dell Technologies declined 5.16% on volume of approximately 6.4 million shares, reflecting the broader weakness in AI-related hardware stocks.
Key Takeaways for Traders and Investors
- Technology stocks led the market lower, with semiconductor and AI infrastructure companies experiencing broad-based profit-taking.
- The Nasdaq Composite remains the index to watch. Its position near the 25-day moving average makes this an important technical support level for growth stocks.
- The broader market trend remains positive. Despite Thursday’s decline, the Dow Jones, S&P 500, and Russell 2000 continue to trade above key moving averages, suggesting that the longer-term uptrend remains intact.
- Sector rotation continues. Investors appear to be reallocating capital from high-momentum technology stocks into other areas of the market rather than exiting equities altogether.
- Unless selling pressure expands beyond the technology sector or is accompanied by significantly higher trading volume, Thursday’s decline appears more consistent with normal profit-taking than the beginning of a broader market correction.
Thursday’s U.S. Market Statistics
New York Stock Exchange (NYSE): Market breadth on the New York Stock Exchange (NYSE) was modestly negative on Thursday, with declining issues narrowly outnumbering advancing issues. There were 2,318 declining stocks, 2,153 advancing stocks, and 447 issues closing unchanged, resulting in a decliner-to-advancer ratio of 1.07:1. While the breadth was negative, the margin was relatively narrow, indicating that selling pressure was not broad-based.
The NYSE recorded 351 new 52-week highs and 170 new 52-week lows, compared with 269 new highs and 124 new lows in the previous session. Although both new highs and new lows increased, stocks reaching new highs continued to outnumber those posting new lows by approximately 2-to-1. This remains a constructive sign, suggesting that underlying market leadership continues to broaden despite Thursday’s modest pullback.
Total NYSE trading volume reached 5.47 billion shares, approximately 3% higher than the 5.32 billion shares traded in the previous session. The increase in volume was relatively modest and remained within normal daily trading ranges. Combined with the relatively balanced market breadth, Thursday’s activity does not suggest significant institutional distribution or widespread selling pressure.
Overall, the NYSE statistics indicate that although the market experienced a modestly negative session, the underlying internal strength remains favourable. The continued dominance of new 52-week highs over new lows suggests that the broader market uptrend remains intact.
NASDAQ: The NASDAQ experienced noticeably weaker market breadth than the NYSE, reflecting the broad-based selling pressure in technology and growth-oriented stocks. There were 3,076 declining issues compared with 1,844 advancing issues, while 370 issues closed unchanged. This produced a decliner-to-advancer ratio of 1.67:1, or approximately five declining stocks for every three advancing stocks.
Thursday marked the first negative breadth session following two consecutive days of positive market breadth. Over the past six trading sessions, the NASDAQ has recorded four negative and two positive breadth readings, indicating that market participation has become more mixed as investors reassess positions in high-growth sectors.
The exchange recorded 249 new 52-week highs and 235 new 52-week lows, compared with 142 new highs and 158 new lows in the previous session. Both figures increased significantly, but it was encouraging to see new highs narrowly exceed new lows for the first time this week. This suggests that, despite the broad weakness in technology shares, pockets of market leadership continue to emerge.
Total NASDAQ trading volume reached 8.57 billion shares, representing a 13% increase from the 7.60 billion shares traded in the previous session. The higher trading volume, combined with the negative breadth, reflects increased trading activity as investors rotated within the technology sector and adjusted positions following recent gains.
Key Takeaways for Traders and Investors
- NYSE market internals remain constructive. Although market breadth was slightly negative, new 52-week highs continued to outnumber new lows by roughly 2-to-1, supporting the view that the broader market remains healthy.
- NASDAQ experienced a weaker session, with negative breadth and heavier trading volume reflecting increased selling pressure in technology and AI-related stocks.
- New highs continued to hold up well across both exchanges, suggesting that leadership remains intact even as investors become more selective.
- Trading volume increased but did not indicate widespread panic selling. The modest increase on the NYSE and the stronger increase on the NASDAQ appear more consistent with portfolio repositioning and profit-taking than broad market liquidation.
- The overall market remains resilient. While Thursday’s statistics point to short-term consolidation and sector rotation, they do not yet signal a deterioration in the primary bullish trend. Continued monitoring of market breadth, trading volume, and the new highs/new lows relationship over the coming sessions will provide a clearer indication of whether the current weakness develops into a broader correction or remains a healthy pause within the ongoing uptrend.
Market Internals Scorecard
| Indicator | NYSE | NASDAQ | Interpretation |
| Market Breadth | Slightly Negative | Negative | Cautious |
| New Highs vs. New Lows | Bullish | Neutral to Bullish | Positive |
| Volume | Neutral | Moderately Elevated | Watch |
| Overall Market Internals | Constructive | Mixed | Bullish Bias |
NOTICE TO READERS
The Canadian Vanguard Stock Market is about empowering you to build and manage your wealth by yourself. There is certainly no magic in managing finances or wealth but one needs to know what to do and commit to doing what is needed. When you are ready to start the journey to Take Charge and Put Your Destiny In Your Own Hands, start with reading The Canadian Vanguard every market day. If and when you need more related information or to advertise your business products or services in The Canadian Vanguard, Contact Us
Our readers are strongly advised to conduct their own research into individual stocks before making a purchase decision. In addition, investors are advised that past stock performance is no guarantee of future price appreciation. Any recommendation is not a guarantee of any particular stock’s future prices, and The Canadian Vanguard accepts no responsibility or liability for investors’ or readers’ purchases.
Stocks In The News/ Stocks To Watch and Market Strategy will soon be available only to Paying Subscribers. The dollar sign “$” in the Toronto Market section in the articles only stands for Canadian dollar and in the US market section “$” stands for US dollar.
(c) This article is published by The Canadian Vanguard on July 16, 2026



