

Stocks Slip as U.S.–Iran Tensions Weigh on Sentiment
The Canadian Vanguard Stock Market Report Monday May 4, 2026 Edition
.
The Toronto Market
Today’s Toronto Market Index
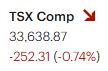
The S&P/TSX Composite Index fell 252.31 points, or 0.74%, to close at 33,638.87. The index opened lower and remained in negative territory for most of Friday’s session, reversing Thursday’s steady upward momentum.
Trading volume on Friday was below the 50-day average, though overall volume trends have recently been higher. The recent increase in activity is largely attributed to escalating geopolitical tensions between the U.S. and Iran.
The TSX has declined in eight of the past ten sessions, reflecting sustained market weakness. While the index briefly rose above Friday’s close within the first hour of trading, it subsequently trended downward for the remainder of the session.
Overall, it was a notably negative day for the market.
TSX Market Internals
Breadth was firmly negative, with decliners (1,495) outpacing advancers (678) by a 2.2:1 margin; 115 names finished unchanged.
New highs vs. lows showed some narrowing at the extremes, with 162 stocks printing fresh 52-week highs against 59 new lows, versus 241 highs and 35 lows in the prior session.
Total volume came in at 497.3M shares, up 36% from Friday’s 365.7M, indicating a pickup in activity alongside the downside move.
TSX Market Wrap-Up
Risk-off tone dominated again, with the S&P/TSX Composite extending its losing streak (down 8 of the last 10), as rallies continue to be sold. Only 3 of 10 sectors finished green, underscoring weak breadth and lack of upside conviction.
Energy led (+0.71%), supported by strength in the underlying commodity, while Technology (+0.25%) and Utilities (+0.07%) posted modest gains. The rest of the tape was broadly lower: Financials fell -0.93%, Basic Materials dropped -1.61%, and Consumer segments lagged, with Discretionary down -2.50% and Staples (Durable Consumer Goods & Services) off -1.11%.
Under the hood, market internals remained bearish. Breadth came in weak (decliners leading ~2.2:1), confirming the downside move. Despite the selloff, new 52-week highs (162) continued to outpace lows (59), suggesting some underlying resilience in select names, though momentum is clearly fading from prior sessions. Volume picked up ~36% day-over-day to ~497M shares, pointing to increased participation on the downside — not an encouraging signal in the near term.
From a price-action perspective, the index showed an early failed bounce, briefly reclaiming the prior close before rolling over and trending lower throughout the session — a classic intraday rejection pattern. The structure of lower highs and persistent selling pressure reinforces the current bearish bias.
Notable Movers
Canadian Natural Resources rose +1.38% on 8.8M shares, while Suncor Energy gained +1.60%, both benefiting from strength in energy. Shopify was flat to slightly negative (-0.06%), reflecting continued hesitation in tech leadership. Nutrien added +0.94% (1.5M shares), maintaining its tendency to catch bids amid geopolitical tension.
Financials were broadly weak, with all Big Six banks in the red; CIBC lagged the group, down -1.86%. Cameco declined -1.40% on lighter volume (817K shares), tracking weakness in uranium names.
Takeaway
The tape remains fragile. Weak breadth, rising volume on down days, and failed intraday rallies all point to continued near-term downside risk. Until participation improves and buyers show conviction, the path of least resistance remains lower.
.
The US Markets
U.S. Market Indexes
U.S. equities closed lower across the board, led by heavier selling in large caps. The Dow Jones Industrial Average dropped 557.37 pts (-1.13%) to 48,941.90. The S&P 500 fell 29.37 pts (-0.41%) to 7,200.75, while the Nasdaq Composite slipped 46.64 pts (-0.19%) to 25,067.80. The Russell 2000 declined 16.83 pts (-0.60%) to 2,796.00.
Price action reflected a risk-off bias, with large caps taking the brunt of the selling as geopolitical tensions (U.S.–Iran) continue to weigh on sentiment. The Dow’s relative underperformance highlights pressure in industrials and cyclicals, while tech held up comparatively well, limiting downside in the Nasdaq and S&P 500.
Small caps (Russell 2000) also lagged, extending recent choppiness, though the move was not disorderly. Broadly, the market continues to struggle for direction, with headline-driven volatility disrupting trend formation.
From a trading perspective, this remains a headline-sensitive tape. Geopolitical developments are driving short-term flows, making sustained trends harder to establish. Until volatility subsides and macro clarity improves, expect continued rotation, uneven sector performance, and reduced conviction in directional trades.

U.S. Market Internals
NYSE: Breadth skewed negative, with decliners (3,139) outpacing advancers (1,370) by a ~2.3:1 margin; 381 names were unchanged — a clear risk-off signal.
New highs vs. lows remained constructive at the margin, with 337 stocks printing fresh 52-week highs versus 90 new lows, improving from 187 highs and 84 lows in the prior midweek session. This suggests underlying leadership persists despite broader selling pressure.
Volume rose to 5.29B shares (+8% vs. Friday), pointing to increased participation on the downside — typically a bearish near-term read.
NASDAQ: Breadth also favored sellers, though less decisively, with a 1.53:1 decliner-to-advancer ratio (2,927 vs. 1,914; 357 unchanged).
High/low data showed continued improvement, with 288 new highs against 107 new lows, a notable shift from 127 highs vs. 155 lows in the prior midweek comparison — reinforcing selective strength in growth/tech despite index-level weakness.
Volume came in at 8.03B shares, up ~5% day-over-day, indicating modestly higher activity as the market digests ongoing volatility.
Takeaway
Internals confirm a negative session, with weak breadth and rising volume supporting the downside move. However, resilience in new highs suggests leadership hasn’t fully broken down — pointing to a market that’s under pressure, but not yet in broad capitulation.
U.S. Market Wrap-Up
Geopolitical tensions (U.S.–Iran) remained the primary driver, with headline risk dictating flows and reinforcing a risk-off tone. Equities closed lower across the board, led by large caps, as sellers maintained control into the close.
The Dow Jones Industrial Average fell -1.13%, while the S&P 500 declined -0.41% and the Nasdaq Composite slipped -0.19%. The Russell 2000 underperformed modestly (-0.60%), reflecting continued pressure on small caps.
Sector Performance
Defensive and commodity-linked names offered limited shelter. Energy (+0.94%) was the lone gainer, benefiting from geopolitical support. Technology (-0.08%) was relatively resilient, while cyclicals took the brunt of the selling: Industrials (-1.02%), Financials (-1.17%), and Basic Materials (-1.62%) lagged. The narrow leadership highlights weak participation and limited conviction on the buy side.
Market Internals
Under the surface, breadth confirmed the negative tone. On the NYSE, decliners led advancers by ~2.3:1, while the NASDAQ printed a weaker 1.5:1 ratio — both consistent with a risk-off session.
That said, new highs continued to outpace new lows on both exchanges, signaling that leadership pockets remain intact despite index-level weakness. Volume increased on both NYSE (+8%) and NASDAQ (+5%), pointing to higher participation on the downside — typically a bearish near-term signal.
Industry / Stock Highlights
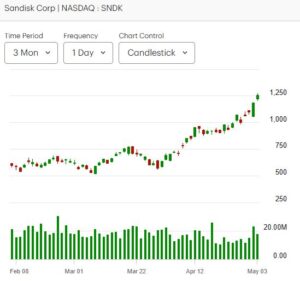
Strength remained concentrated in memory and storage:
- Memory names outperformed, with Sandisk (+5.8%) and Micron (+6.13%) seeing strong volume and momentum.
- Disk drive manufacturers also caught bids: Western Digital (+2.51%) and Seagate (+1.62%).
Semiconductors were mixed to weaker overall:
- Advanced Micro Devices (-5.27%), Intel (-3.85%), and Arm Holdings (-3.75%) saw notable selling pressure.
- Taiwan Semiconductor (+0.99%) and Nvidia (+0.05%) showed relative resilience, helping stabilize the broader tech complex.
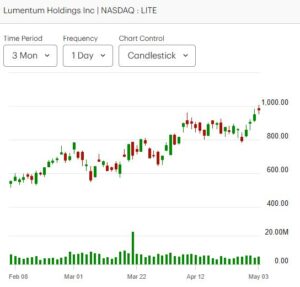
In optical networking, performance was mixed:
- Lumentum (+2.76%) and Corning (+1.23%) posted gains.
- Applied Optoelectronics was volatile — strong earlier momentum contrasted with a later pullback (-5.74%), highlighting the choppy, momentum-driven tape.
Technical Takeaway
The session reinforces a fragile market structure: weak breadth, rising volume on down moves, and continued sensitivity to geopolitical headlines. While pockets of leadership (notably in memory/AI-adjacent names) remain intact, the broader tape lacks cohesion.
Bottom Line
This is a headline-driven, low-conviction environment. Until volatility subsides and breadth improves, expect continued rotation, failed rallies, and a bias toward capital preservation over aggressive positioning.
.
Forward-Looking Trade Setup (For Tuesday’s Market Session)
Base Case (Bearish Bias / Continuation)
Trend remains fragile with weak breadth and rising volume on down moves. Expect rallies to be sold unless there’s a clear shift in headlines.
- Setup: Fade early strength into resistance (prior day close / intraday highs).
- Confirmation: Failure to hold opening range highs + deteriorating breadth.
- Targets: Retest of recent lows; extension if volume expands on the downside.
- Invalidation: Strong breadth reversal (>1.5:1 advancers) with sustained bid.
Alternative Case (Relief Bounce / Short Covering)
Given stretched short-term conditions, a bounce is possible, especially if geopolitical tone softens overnight.
- Setup: Break and hold above opening range with strong volume.
- Leadership to watch: Mega-cap tech and resilient semis (names like Nvidia / TSM).
- Targets: Prior session highs, then gap-fill zones.
- Risk: Bounce likely to be tactical unless supported by improving internals.
Rotation Watch
- Energy: Still headline-supported, but crowded — vulnerable to sharp reversals.
- Tech: Holding up relatively well; key for any upside follow-through.
- Financials/Cyclicals: Remain weak; avoid unless clear reversal signals emerge.
Execution Notes
- Stay nimble — this is a headline-driven tape.
- Prioritize risk management over conviction trades.
- Focus on intraday confirmation (breadth, volume, opening range behavior) rather than pre-market bias.
.
NOTICE TO READERS
The Canadian Vanguard Stock Market is about empowering you to build and manage your wealth by yourself. There is certainly no magic in managing finances or wealth but one needs to know what to do and commit to doing what is needed. When you are ready to start the journey to Take Charge and Put Your Destiny In Your Own Hands, read The Canadian Vanguard every market day. If you need more related information, Contact Us
Our readers are strongly advised to conduct their own research into individual stocks before making a purchase decision. In addition, investors are advised that past stock performance is no guarantee of future price appreciation. Any recommendation is not a guarantee of any particular stock’s future prices, and The Canadian Vanguard accepts no responsibility or liability for investors’ or readers’ purchases.
Stocks In The News/ Stocks To Watch and Market Strategy will soon be available but only to Paying Subscribers. The dollar sign “$” in the Toronto Market section in the articles only stands for Canadian dollar and in the US market section “$” stands for US dollar.
(c) This article is published by The Canadian Vanguard on May 4, 2026