

The Canadian Vanguard Stock Market Report Weekend May 1-3, 2026 Edition
Nasdaq & S&P 500 Hit Record High as Markets Advance on Strong Earnings
The Canadian Vanguard Stock Market Report is updated regularly during the weekend
.
The Toronto Market
Friday’s Toronto Market Index
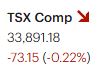
The Toronto S&P/TSX Composite Index fell 73.15 points (-0.22%) on Friday, closing at 33,891.18. The index opened lower and remained in negative territory for most of the session, unable to recover. This marked a reversal from Thursday’s performance, when the index climbed steadily throughout the day. Trading volume increased on Thursday but declined on Friday.
The TSX has now closed lower in seven of the past nine sessions. After a steady upward trend earlier in the year, the index began to decline following the onset of the U.S.–Iran conflict on February 28. It dropped over the next two weeks (ten trading sessions) before finding support at 31,317.
The index then rebounded over four weeks, reaching resistance at 34,346, before pulling back again and finding support at 33,318. Currently, the 34,540 level remains a key resistance point for the TSX.
Friday’s TSX Market Statistics
On the TSX, advancing issues outnumbered declining issues, with 1,285 advancers versus 872 decliners. This resulted in an advancer-to-decliner ratio of 1.47:1—approximately three advancing stocks for every two declining stocks. A total of 131 issues were unchanged.
The exchange recorded 241 new 52-week highs and 35 new 52-week lows, compared with 85 new highs and 46 new lows on Wednesday.
Total trading volume on the TSX reached 365,725,433 shares, representing a 25% decline from the 488,685,758 shares traded on Wednesday.
Friday’s Toronto Market Wrap-Up Report
The TSX Composite has now closed lower in seven of the past nine sessions, confirming near-term downside pressure and a loss of upward momentum. Despite the index-level weakness, internal breadth was constructive, with an advancer/decliner ratio of approximately 1.47:1, indicating selective accumulation beneath the surface.
Sector participation was narrow, with only three of ten sectors closing higher. Technology led decisively, advancing 3.51%, supported by strength in large-cap components. Telecommunications Services (+0.43%) and Utilities (+0.11%) also posted modest gains, suggesting a partial rotation into defensive and yield-sensitive segments.
On the downside, Basic Materials underperformed, declining 0.93%, followed by Energy (-0.88%) and Consumer Discretionary (-0.39%). Weakness in cyclicals points to some risk-off positioning and sensitivity to macro drivers, particularly commodities.
Within Technology, Shopify Inc. (SHOP), a high-weight index constituent, gained 5.22% to $173.48 on volume of 1.3M shares, acting as a primary driver of sector outperformance. Celestica Inc. (CLS) added 2.12% to close at $569.51 on lighter volume (347.5K), reinforcing the sector’s strength but with less broad participation.
On a weekly basis, sector breadth was strong, with nine of ten sectors advancing. Energy led with a 5.97% gain, reflecting strength in underlying commodity prices, followed by Healthcare (+2.14%) and Consumer Discretionary (+1.11%). Basic Materials lagged significantly, declining 5.65%, highlighting divergence within commodity-linked sectors.
Overall, the market is exhibiting mixed signals: weakening index structure alongside improving internal breadth and selective sector rotation. Key resistance remains overhead, and sustained upside will likely require broader sector participation and confirmation from cyclical groups.
.
The US Markets
U.S. Market Technical Summary
The Dow Jones Industrial Average declined 152.87 points (-0.31%) to close at 49,499.27, underperforming its peers and continuing to lag on a relative strength basis.
The S&P 500 gained 21.11 points (+0.29%) to finish at 7,230.12, while the Nasdaq Composite advanced 222.13 points (+0.89%) to 25,114.44. The Russell 2000 added 12.92 points (+0.46%), closing at 2,812.82.
Both the Nasdaq Composite and S&P 500 registered fresh record closing highs, confirming continued upside momentum and trend persistence in large-cap growth and tech. Friday’s gains also extended improving midweek price action, contrasting with the Dow’s relative weakness after its brief rebound on Thursday.

U.S. Friday Market Statistics (Internals & Breadth)
NYSE Breadth and Volume
On the New York Stock Exchange, market breadth was marginally negative, with declining issues slightly outpacing advancers. Decliners totaled 1,381 versus 1,334 advancers, producing a near-neutral but negative decliner/advancer ratio of 1.03:1. An additional 113 issues closed unchanged, reflecting a lack of strong directional conviction at the index level.
New 52-week highs and lows both came in at 4, a sharp contraction from Wednesday’s 187 highs and 84 lows. This collapse in expansion signals a significant drop in momentum and participation, suggesting limited breakout activity and reduced trend confirmation.
Total NYSE volume declined to 4.91B shares, down approximately 6% from the prior session’s 5.22B. The lighter volume, combined with flat breadth, points to consolidation rather than active distribution.
NASDAQ Breadth and Volume
On the NASDAQ, breadth was constructive, with advancers outnumbering decliners by a ratio of 1.62:1 (3,003 vs. 1,844), indicating continued internal strength within growth and tech-heavy segments. A total of 177 issues were unchanged.
Despite strong breadth, new 52-week highs were limited to just 3, with zero new lows. This represents a sharp decline from Wednesday’s 127 highs and 155 lows, suggesting that while buying interest remains, it is not translating into broad-based breakout activity.
NASDAQ volume totaled 7.64B shares, down 9% from the previous session’s 8.44B. The decline in volume alongside positive breadth may indicate selective accumulation rather than aggressive institutional participation.
U.S. Equities Market Wrap: Price Action & Internals
Index Performance and Trend Structure
The Dow Jones Industrial Average declined 152.87 points (-0.31%) to close at 49,499.27, continuing its relative underperformance versus other major benchmarks.
In contrast, the S&P 500 gained 21.11 points (+0.29%) to 7,230.12, and the Nasdaq Composite advanced 222.13 points (+0.89%) to 25,114.44. Both indices registered fresh record closing highs, confirming sustained upside momentum and trend continuation, particularly within large-cap growth. The Russell 2000 also added 0.46% to close at 2,812.82, signaling some participation from small caps, albeit less pronounced.
The Nasdaq remains the clear relative strength leader, extending its winning streak to five consecutive weeks. From its March 30 close (~20,795) to the end of April (~24,892), the index rallied approximately 20%, with additional upside in the latest session. Year-to-date performance stands near +8%, driven by persistent flows into growth and AI-linked equities.
From a technical standpoint, both the Nasdaq and S&P 500 have completed V-shaped recoveries following their March drawdowns tied to geopolitical risk. The S&P 500 declined roughly 10% in March before rebounding a comparable magnitude in April, fully retracing losses and pushing into new highs. Price action across both indices remains firmly above prior resistance, indicating strong trend persistence, though increasingly extended conditions may elevate the risk of consolidation.
The Dow continues to lag, reflecting relative weakness in industrials and value-oriented sectors. This divergence underscores ongoing market concentration and a preference for growth over cyclicals.
Market Internals and Breadth
NYSE
On the New York Stock Exchange, breadth was slightly negative, with 1,381 decliners versus 1,334 advancers (decliner/advancer ratio: 1.03:1). A total of 113 issues were unchanged, reinforcing the view of a market lacking strong directional conviction at the aggregate level.
New 52-week highs and lows both registered at 4, a sharp contraction from Wednesday’s 187 highs and 84 lows. This collapse in expansion indicates a significant loss of momentum and limited breakout activity.
Total volume declined to 4.91B shares, down 6% session-over-session, suggesting reduced institutional urgency and a shift toward consolidation.
NASDAQ
On the NASDAQ, breadth remained constructive, with 3,003 advancers and 1,844 decliners (advancer/decliner ratio: 1.62:1), alongside 177 unchanged issues. This supports continued internal strength within growth-oriented sectors.
However, new 52-week highs totaled just 3, with zero new lows—down sharply from Wednesday’s 127 highs and 155 lows. Despite positive breadth, the lack of expansion reflects narrowing leadership and limited participation in new breakouts.
Volume declined to 7.64B shares, down 9% from the prior session, indicating that buying activity is becoming more selective rather than broad-based.
Cross-Market Interpretation
The current market environment reflects divergent but still constructive conditions:
- Price Action: Bullish, with the S&P 500 and Nasdaq at record highs and strong multi-week momentum.
- Breadth: Mixed—constructive on the NASDAQ, slightly negative on the NYSE.
- Momentum (Highs/Lows): Weakening, with a sharp contraction in new highs across both exchanges.
- Volume: Declining, suggesting reduced conviction and potential near-term consolidation.
The combination of record index levels and deteriorating internal expansion points to a maturing rally phase. Leadership remains concentrated in large-cap growth, while broader participation is narrowing.
Bottom Line:
Trend conditions remain positive, but internal metrics are no longer confirming the strength of headline indices. This divergence increases the probability of near-term consolidation or rotational activity, rather than immediate trend continuation, unless supported by renewed expansion in breadth and volume.
.
NOTICE TO READERS
The Canadian Vanguard Stock Market is about empowering you to build and manage your wealth by yourself. There is certainly no magic in managing finances or wealth but one needs to know what to do and commit to doing what is needed. When you are ready to start the journey to Take Charge and Put Your Destiny In Your Own Hands, read The Canadian Vanguard every market day. If you need more related information, Contact Us
Our readers are strongly advised to conduct their own research into individual stocks before making a purchase decision. In addition, investors are advised that past stock performance is no guarantee of future price appreciation. Any recommendation is not a guarantee of any particular stock’s future prices, and The Canadian Vanguard accepts no responsibility or liability for investors’ or readers’ purchases.
Stocks In The News/ Stocks To Watch and Market Strategy will soon be available but only to Paying Subscribers. The dollar sign “$” in the Toronto Market section in the articles only stands for Canadian dollar and in the US market section “$” stands for US dollar.
(c) This article is published by The Canadian Vanguard on May 2, 2026