U.S. Markets Mixed as Dow Jones and Small Caps Advance While NASDAQ Extends Technology-Led Pullback
The Canadian Vanguard Stock Market Report Monday July 27, 2026 Edition
.
The Toronto Market
Monday’s Toronto Market Index
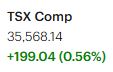
The S&P/TSX Composite Index advanced 199.04 points, or 0.56%, to close at 35,568.14, marking its second consecutive higher close following last week’s alternating pattern of gains and losses.
Intraday price action was characterized by moderate volatility; however, buyers regained control into the close, allowing the index to finish near its session high. This type of closing pattern reflects positive buying interest and suggests that bullish momentum remains intact despite intraday fluctuations.
From a technical standpoint, the intermediate- and long-term trend continues to strengthen. The TSX remains decisively above its 25-day moving average and is trading comfortably above both its 50-day and 200-day moving averages. The positive alignment of these key moving averages continues to support the prevailing uptrend, while the index’s ability to hold above short-term support levels reinforces the constructive technical outlook.
Overall, the current technical structure remains favorable, with momentum continuing to support the potential for additional upside, provided the index maintains support above its shorter-term moving averages.

Monday’s TSX Market Statistics
Market breadth on the TSX remained firmly positive, with advancing issues significantly outnumbering declining issues. A total of 1,497 stocks advanced, while 705 stocks declined, resulting in an advancer-to-decliner ratio of 2.13:1, or approximately two advancing stocks for every declining stock. An additional 117 issues closed unchanged, reflecting broad-based participation in Monday’s rally.
The number of stocks reaching new 52-week highs continued to outpace those posting new 52-week lows. The TSX recorded 99 new 52-week highs and 44 new 52-week lows, compared with 77 new highs and 45 new lows on Friday. Consequently, the new highs-to-new lows ratio improved to 2.25:1, up from 1.71:1 in the previous session. This continued expansion in positive market breadth suggests that buying interest remains well distributed across sectors and reinforces the constructive technical outlook. The TSX continues to rank among the top-performing major equity indices year to date.
Trading activity also strengthened. Total TSX share volume reached 389,051,091 shares, an increase of approximately 17.6% from 330,783,960 shares traded on Friday. While Friday’s volume was below the 50-day average daily trading volume, Monday’s meaningful increase indicates stronger market participation, with investors returning in greater numbers following the quieter end to last week. Rising volume accompanying a higher close is generally viewed as a constructive technical signal, as it suggests institutional buying interest is supporting the advance.
This version adopts the tone and style commonly found in institutional technical market reports, emphasizing market breadth, participation, and volume confirmation while avoiding repetition
.
Monday’s Toronto TSX Market Wrap-Up Report
The S&P/TSX Composite Index advanced 199.04 points, or 0.56%, to close at 35,568.14, extending its winning streak to two consecutive trading sessions. Although the index experienced moderate intraday volatility, buyers stepped in throughout the afternoon, allowing the TSX to finish near its session high. The strong close suggests that bullish sentiment remains intact and that investors continue to view market pullbacks as buying opportunities.
Market participation remained healthy throughout the session. Advancing issues outnumbered declining issues by 1,497 to 705, producing a robust 2.13:1 advancer-to-decliner ratio, while 117 issues finished unchanged. The number of stocks registering new 52-week highs also exceeded those recording new lows by 99 to 44, improving the new highs-to-new lows ratio to 2.25:1, compared with 1.71:1 on Friday. These market breadth indicators continue to point toward broad-based participation in the current advance rather than gains being concentrated in only a handful of large-cap stocks.
From a technical perspective, the TSX remains in a favorable position. The index continues to trade comfortably above its 25-day moving average and remains well above both its 50-day and 200-day moving averages. The positive alignment of these key moving averages supports the prevailing intermediate- and long-term uptrend and suggests the underlying market structure remains constructive.
Trading activity also strengthened. Total TSX volume reached 389.1 million shares, approximately 17.6% above Friday’s total of 330.8 million shares. While Friday’s volume was below the 50-day average, Monday’s increase in trading activity accompanying a higher close represents constructive volume confirmation and suggests stronger institutional participation.
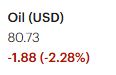
Sector performance was once again broadly positive, with eight of the TSX’s ten primary sectors posting gains. Technology led the market with a strong 9.18% advance, while Consumer Discretionary gained 1.87% and Consumer Durables & Apparel added 1.21%. Other notable contributors included Health Care (+0.61%), Financials (+0.57%), and Materials (+0.61%). Energy was the lone significant weak spot, declining 2.55%, largely reflecting continued softness in energy prices. Overall, sector performance closely mirrored Friday’s leadership pattern, indicating continued investor preference for growth-oriented and cyclical sectors.
In company news, Celestica Inc. (TSX: CLS) delivered another exceptionally strong quarterly earnings report. The company increased its full-year adjusted earnings per share guidance to $11.30, up from its previous forecast of $10.15, following robust second-quarter results driven by continued strength in its Connectivity & Cloud Solutions and Hardware Platform Solutions businesses.
Second-quarter net earnings rose to $368.8 million ($3.17 per share), compared with $211.0 million ($1.82 per share) during the same quarter last year. Adjusted earnings came in at $2.54 per share, comfortably exceeding the consensus analyst estimate of $2.27 per share. The results reinforce Celestica’s position as one of the TSX’s strongest technology growth stories, and the stock continues to warrant close attention from growth-oriented investors.
Key Takeaways for Traders and Investors
- The TSX extended its advance with a second consecutive higher close while finishing near the session high—a constructive sign that buyers remain in control.
- Market breadth remained strong, with advancers outpacing decliners by more than two-to-one and new 52-week highs continuing to outnumber new lows, indicating broad participation across the market.
- Higher trading volume accompanying Monday’s advance provides positive confirmation that institutional investors are continuing to support the current rally.
- The index remains comfortably above its 25-day, 50-day, and 200-day moving averages, preserving a favorable intermediate- and long-term technical outlook.
- Technology continues to provide market leadership, while weakness remains concentrated in the Energy sector. Traders should continue to monitor sector rotation, particularly whether leadership broadens beyond technology and consumer-oriented sectors.
- Celestica’s earnings beat and higher forward guidance further reinforce the strength of Canada’s technology sector and may continue to attract momentum investors.
Overall, Monday’s session was another constructive day for Canadian equities. The combination of a higher close, improving market breadth, stronger trading volume, and continued technical strength suggests that the bulls remain in control. While short-term volatility should be expected following the market’s recent advance, the underlying technical and participation indicators continue to favor the continuation of the prevailing uptrend.
.
The US Markets
.
Monday’s U.S. Market Indexes
U.S. equities delivered a mixed performance on Monday as investors continued to rotate capital away from technology and semiconductor stocks into more cyclical and value-oriented sectors. The Dow Jones Industrial Average rebounded 262.83 points (0.51%) to close at 52,210.08, while the Russell 2000 gained 18.04 points (0.62%) to finish at 2,948.03, reflecting renewed buying interest in smaller-cap companies.

The broader market, however, remained subdued. The S&P 500 edged higher by just 1.20 points (0.02%) to close at 7,413.18, narrowly extending its advance after spending much of the session under pressure. The NASDAQ Composite declined 43.74 points (0.18%) to 24,932.08, marking another session of relative weakness as technology shares continued to underperform.
The divergence among the major indexes continues to reflect an ongoing sector rotation. Investors have been reducing exposure to semiconductor and artificial intelligence-related stocks following their strong multi-month advances and reallocating capital into sectors perceived to offer better relative value. Since technology companies represent a significant weighting in both the NASDAQ Composite and the S&P 500, continued weakness in this group has weighed disproportionately on those indexes.
Technology sentiment was further pressured by reports that a Chinese manufacturer intends to begin large-scale production of semiconductor manufacturing equipment. If successfully commercialized, increased competition in the global chip equipment industry could eventually alter the competitive landscape for established equipment manufacturers. Although the long-term implications remain uncertain, the announcement contributed to cautious sentiment across the semiconductor sector during Monday’s session.
From a technical perspective, the major U.S. indexes are beginning to show greater divergence.
The Dow Jones Industrial Average continues to exhibit relative strength and remains in a constructive technical position. The Russell 2000, while having fallen below its 25-day moving average, continues to trade comfortably above both its 50-day and 200-day moving averages, indicating that its intermediate- and long-term uptrend remains intact despite recent consolidation.
The S&P 500 has slipped below its 25-day moving average and is now testing support at its 50-day moving average. Although the index remains above its 200-day moving average, sustained weakness in large-cap technology stocks could place additional pressure on this important intermediate-term support level.
The NASDAQ Composite continues to display the weakest technical profile among the major U.S. indexes. Following another decline on Monday, the index remains below both its 25-day and 50-day moving averages while continuing to hold above its 200-day moving average. Unless buying momentum returns to the technology sector, the NASDAQ may require a sustained rally to reclaim these important short- and intermediate-term technical levels. Until then, relative weakness in growth and semiconductor stocks is likely to continue acting as a headwind for the index.
Overall, Monday’s trading reinforced the theme that has emerged over recent weeks: leadership within the U.S. equity market continues to broaden beyond large-cap technology. While the long-term bull market remains intact, sector rotation rather than broad market liquidation appears to be driving current price action. Traders should continue monitoring whether money flowing out of technology is absorbed by financials, industrials, healthcare, and small-cap stocks, as that would indicate a healthy rotation rather than a deterioration in overall market sentiment.