
The Canadian Vanguard Stock Market Report, Weekend July 24 – 26, 2026 Edition
Dow Jones Rallies While Nasdaq Extends Decline as Investors Rotate Out of Semiconductor Stocks
.
The Canadian Vanguard Stock Market Report is updated regularly during the weekend.
.
Sunday Evening News Update! – Oil price slips 5% and Futures are up Sunday evening as Iran reportedly agreed to suspend attacks as long as a U.S. pause in hostilities remains in place . – Sunday 9:30 pm EDT
.
The Toronto Market (as at Friday Market Close)
Friday’s Toronto Market Index
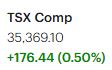
The S&P/TSX Composite Index advanced 176.44 points (0.50%) on Friday to close at 35,192.66.
The TSX appears to have resumed its recent pattern of alternating between gains and losses. While the index posted a solid advance on Friday, recent market action suggests that upside sessions have generally been more modest, whereas pullbacks have tended to be larger. This reflects a market that remains resilient but is also experiencing increased volatility.
Market breadth was positive on Friday, indicating that buying interest was broadly distributed across sectors rather than concentrated in a small number of large-cap stocks. This is a constructive technical signal and suggests that the underlying strength of the market remains intact.
From a technical perspective, the TSX continues to trade comfortably above its 25-day moving average and remains well above both its 50-day and 200-day moving averages, reinforcing the prevailing intermediate- and long-term uptrends. As long as the index holds above these key support levels, the broader bullish trend remains in place.
The 50-day moving average remains an especially important technical reference point. A decisive break below this level would represent a meaningful deterioration in market momentum, elevate downside risk, and serve as a major caution—or potential sell—signal for investors.
Friday’s TSX Market Statistics
Market internals strengthened on Friday as advancing issues outpaced declining issues by a wide margin. The TSX recorded 1,380 advancing issues versus 742 declining issues, producing an advance-decline ratio of 1.86:1—nearly two advancing stocks for every decliner. An additional 133 issues finished unchanged, reflecting broadly positive participation across the market.
The exchange also reported 77 new 52-week highs and 45 new 52-week lows, a notable improvement from Thursday’s 61 new highs and 78 new lows. This shift indicates improving underlying momentum and confirms positive market breadth. Over the final three trading sessions of the week, the ratio of new highs to new lows measured 2.94, 0.78, and 1.71, respectively. Friday’s rebound in this indicator suggests that buying interest regained strength following Thursday’s temporary deterioration in market leadership.
The TSX has remained one of the stronger-performing major equity indices this year and reached a new all-time high of 35,485 earlier this week, underscoring the market’s longer-term upward trend.
Total trading volume on the TSX was 330.8 million shares, down approximately 21% from 420.1 million shares traded on Thursday. Although volume was lighter, the combination of positive advance-decline statistics and the improvement in the new highs-to-new lows ratio suggests that the market’s underlying technical condition remains constructive. While lower trading volume warrants some caution, Friday’s session reflected broad-based participation and continued resilience in the Canadian equity market.
.
Friday’s Toronto TSX Market Wrap-Up Report
The S&P/TSX Composite Index gained 176.44 points (0.50%) on Friday to close at 35,192.66, rebounding after the previous session’s decline. The TSX continues to demonstrate resilience, trading comfortably above its 25-day, 50-day, and 200-day moving averages, which confirms that the intermediate- and long-term uptrends remain intact.
Although the index has recently alternated between gains and losses, Friday’s advance was supported by positive market breadth, suggesting that buying interest was broadly distributed rather than concentrated in a handful of large-cap stocks. The TSX recorded 1,380 advancing issues compared with 742 declining issues, producing an advance-decline ratio of 1.86:1, while the number of new 52-week highs (77) exceeded new 52-week lows (45). These internal market indicators point to continued underlying strength despite recent day-to-day volatility.
One of the defining influences on North American equity markets since early this year has been heightened geopolitical uncertainty in the Middle East, particularly tensions involving the United States and Iran. Financial markets have remained highly sensitive to movements in crude oil prices because sustained increases in energy costs tend to fuel inflation, raising the possibility of tighter monetary policy and higher interest rates. Higher borrowing costs generally weigh on corporate profitability and equity valuations.
The Canadian market, however, has been relatively more resilient than several major U.S. indices. As a significant energy-producing nation, Canada benefits from stronger oil prices through improved earnings prospects for many energy companies, partially offsetting the inflationary headwinds that typically pressure broader equity markets. This has been one reason the TSX has outperformed many global equity benchmarks this year.
Sector performance reflected broad-based strength, with nine of the ten major sectors finishing higher. Technology led the advance with a 2.19% gain, followed by Consumer Discretionary (+1.22%), Consumer Durables & Apparel (+0.91%), Financials (+0.86%), and Healthcare (+0.81%). Basic Materials posted a modest gain of 0.03%, while Energy was the only sector to finish lower, slipping 0.07% despite continued attention on global oil markets.
Among individual companies, Canada’s Big Six banks all closed higher, reflecting renewed investor confidence in the financial sector after a brief period of profit-taking earlier in the week. Canadian Imperial Bank of Commerce (TSX: CM) led the group with a 0.94% gain. The recent pullback in the banking sector appears, for now, to have been a normal consolidation within a broader uptrend, although investors should continue monitoring interest rate expectations and economic data for signs of changing fundamentals.
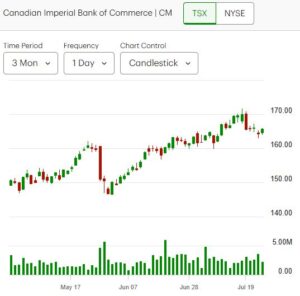
Outside the banking sector, Manulife Financial Corp. (TSX: MFC) remains a financial stock worth monitoring, particularly if market sentiment toward insurers continues to improve. For income-oriented investors, Enbridge Inc. (TSX: ENB) continues to stand out as a high-quality utility and energy infrastructure company with an established dividend history and defensive characteristics.
Key Takeaways for Traders and Investors
- The primary trend remains bullish. The TSX continues to trade well above its key moving averages, indicating that the longer-term technical picture remains constructive.
- Market breadth improved significantly. Strong advance-decline statistics and an increase in new 52-week highs suggest that Friday’s rally was supported by broad participation rather than a narrow group of stocks.
- Oil prices remain the key macroeconomic variable. Sustained increases in crude oil prices could rekindle inflation concerns, potentially delaying future interest rate cuts and increasing market volatility. Conversely, stable or moderating oil prices would likely provide a more supportive backdrop for equities.
- Financials remain an important leadership group. Friday’s rebound among Canada’s major banks is encouraging, but continued leadership from the financial sector will be important if the TSX is to challenge its recent record high of 35,485.
- Risk management remains essential. While the market’s technical condition remains healthy, a decisive break below the 50-day moving average would represent a meaningful deterioration in momentum and warrant increased caution. Until then, the evidence continues to favor maintaining a constructive outlook while monitoring geopolitical developments, corporate earnings, and inflation data closely.
.
The US Markets (as at Friday Market Close)
Friday’s U.S. Market Indexes
U.S. equity markets finished the week with mixed results as investors weighed corporate earnings against ongoing geopolitical risks and their potential impact on inflation and interest rates.
The Dow Jones Industrial Average rebounded 235.60 points (0.46%) to close at 51,947.25. The S&P 500 edged higher by 3.68 points (0.05%) to finish at 7,411.98, while the Nasdaq Composite declined 161.87 points (0.64%) to 24,975.82, falling back below the psychologically important 25,000 level. The Russell 2000 Index also weakened, losing 10.16 points (0.35%) to close at 2,930.00.

Friday’s trading reflected a divergence in market leadership. The Dow and S&P 500 posted modest gains, supported by strength in more defensive and value-oriented sectors, while the technology-heavy Nasdaq continued to experience profit-taking following its exceptional rally during April and May. The Nasdaq’s close below the 25,000 level represents a technical setback and suggests that near-term selling pressure has yet to fully subside.
Geopolitical developments in the Middle East remain an important macroeconomic risk for global financial markets. Persistent tensions involving the United States and Iran have contributed to higher crude oil prices, increasing concerns that rising energy costs could reignite inflation. Higher inflation typically reduces the likelihood of near-term interest rate cuts and, if sustained, could result in a more restrictive monetary policy environment. Technology and other growth-oriented sectors are generally more sensitive to higher interest rates because their valuations depend more heavily on future earnings growth.
From a technical perspective, the market picture remains mixed.
The S&P 500 continues to trade above its 25-day, 50-day, and 200-day moving averages, indicating that both the intermediate- and long-term uptrends remain firmly intact despite recent market volatility.
The Russell 2000 has slipped below its 25-day moving average, reflecting a modest loss of short-term momentum. However, the index remains comfortably above its 50-day and 200-day moving averages, suggesting that the broader trend for small-cap stocks remains constructive.
The Nasdaq Composite presents the weakest technical profile among the major U.S. indexes. Following Friday’s decline, the index is trading below its 25-day, 50-day, and 200-day moving averages, indicating that both short- and longer-term momentum have deteriorated. A sustained move below the 50-day moving average is generally viewed as a signal of elevated downside risk, while trading below the 200-day moving average reflects a significant weakening of the longer-term trend. The Nasdaq’s technical condition suggests that additional base-building or consolidation may be required before a more durable recovery can develop.
Key Takeaways for Traders and Investors
- Market leadership is rotating. Defensive and value-oriented stocks are outperforming, while technology shares continue to consolidate after an extended advance.
- The S&P 500 remains the strongest major U.S. index from a technical standpoint, continuing to trade above all key moving averages.
- The Nasdaq warrants caution. Its break below the 25,000 level and its position beneath the 25-day, 50-day, and 200-day moving averages suggest that downside risk remains elevated until technical support is re-established.
- Oil prices remain the market’s key macroeconomic variable. Sustained increases in crude oil prices could intensify inflation pressures, delay monetary easing by the Federal Reserve, and weigh on equity valuations—particularly in growth sectors.
- Earnings season remains a near-term catalyst. Strong corporate results may help offset macroeconomic concerns, while disappointing earnings or cautious guidance could amplify existing market volatility.
.
Friday’s U.S. Market Statistics
New York Stock Exchange (NYSE): Market breadth on the New York Stock Exchange (NYSE) improved on Friday, ending a three-session streak of negative internal market readings. Advancing issues outnumbered declining issues, with 2,490 advancers versus 1,887 decliners, while 464 stocks finished unchanged. This produced an advance-decline ratio of 1.32:1, or approximately six advancing stocks for every five declining stocks, indicating that buying interest was more broadly distributed across the market.
Despite the improvement in overall breadth, the exchange recorded 161 new 52-week highs and 198 new 52-week lows, compared with 142 new highs and 161 new lows on Thursday. Although the number of new highs increased, new lows continued to exceed new highs, resulting in a new highs-to-new lows ratio of 0.81, down slightly from 0.88 in the previous session. This suggests that while market participation improved, underlying leadership remains somewhat mixed and broad-based strength has yet to fully re-emerge.
Total NYSE trading volume reached 4.97 billion shares, approximately 11% lower than Thursday’s 5.59 billion shares. The lighter trading volume indicates that Friday’s improvement in market breadth was not accompanied by particularly strong conviction. Even so, the return to positive breadth following three consecutive negative sessions is an encouraging sign that selling pressure may be beginning to moderate.
NASDAQ: Market internals remained weaker on the NASDAQ, where declining stocks outnumbered advancing stocks for the third consecutive trading session. The exchange recorded 2,718 declining issues versus 2,174 advancing issues, with 409 issues unchanged, producing a decline-to-advance ratio of 1.25:1, or roughly six declining stocks for every five advancing stocks. This continued negative breadth reflects persistent weakness within the technology and growth sectors.
The NASDAQ reported 108 new 52-week highs and 264 new 52-week lows, compared with 64 new highs and 346 new lows on Thursday. While new lows still substantially outnumbered new highs, the reduction in new lows and the increase in new highs represent a modest improvement in market internals. Heavy concentrations of new 52-week lows are typically associated with sustained institutional selling, so Friday’s data suggest that downside pressure eased somewhat even though it remains elevated.
From a technical perspective, the NASDAQ continues to exhibit the weakest profile among the major U.S. equity indexes. After a strong advance during April and May, the index has spent roughly the past three weeks in a corrective phase characterized by alternating sessions of gains and losses. Following Thursday’s sharp decline and Friday’s additional weakness, the index has now fallen below its 50-day moving average, an important technical benchmark that signals elevated downside risk and a deterioration in intermediate-term momentum. A recovery above this level would improve the technical outlook, while continued trading below it would suggest that further consolidation—or additional downside—remains possible.
Total NASDAQ trading volume amounted to 7.55 billion shares, approximately 4% lower than Thursday’s 7.89 billion shares. The modest decline in volume, combined with the improvement in new highs and new lows, indicates that although sellers maintained control, the intensity of the recent selling pressure may be beginning to ease.
Key Takeaways for Traders and Investors
- NYSE market breadth improved, ending a three-session stretch of negative internals and suggesting that buying interest broadened across the market.
- NASDAQ market breadth remains weak. Declining stocks continued to outnumber advancing stocks, reflecting ongoing pressure in technology and growth-oriented sectors.
- Leadership remains mixed. While NYSE breadth turned positive, new 52-week lows still exceeded new highs on both exchanges, indicating that the broader market has not yet returned to a uniformly strong technical position.
- Trading volumes declined on both exchanges, implying lighter participation and somewhat lower conviction behind Friday’s market action.
- Watch the NASDAQ closely. Its position below the 50-day moving average, together with three consecutive sessions of negative market breadth, suggests that investors should remain cautious until technical indicators show sustained improvement.
Friday’s U.S. Market Wrap-Up Report
U.S. equity markets finished the week with mixed performance as investors continued to navigate corporate earnings, sector rotation, and heightened geopolitical uncertainty. While the Dow Jones Industrial Average and S&P 500 posted modest gains, the technology-heavy Nasdaq Composite remained under pressure, extending its recent pullback and closing below the psychologically important 25,000 level.
The Nasdaq has undergone a significant change in character over the past several weeks. Following a powerful advance that carried the index from 20,795 on March 30 to 27,094 on June 2, technology shares entered a corrective phase marked by alternating sessions of gains and losses. The recent weakness has shifted the Nasdaq below its 25-day, 50-day, and 200-day moving averages, indicating that both intermediate- and longer-term momentum have deteriorated. From a technical perspective, the index now appears to be in a repair phase that may require additional time before a sustained recovery can develop.
Market internals reflected this divergence. On the New York Stock Exchange (NYSE), market breadth turned positive after three consecutive sessions of negative readings, with advancing stocks outnumbering declining stocks by 1.32 to 1. In contrast, the NASDAQ recorded its third consecutive session of negative market breadth, with decliners exceeding advancers by 1.25 to 1. Although new 52-week lows remained elevated on both exchanges, Friday’s improvement in the ratio of new highs to new lows suggests that selling pressure may be beginning to moderate, even if investor sentiment toward growth stocks remains cautious.
Geopolitical developments in the Middle East continue to represent one of the market’s principal macroeconomic risks. Rising tensions involving the United States and Iran have supported higher crude oil prices, increasing concerns that inflation could remain elevated. Persistent inflation would reduce the likelihood of near-term interest rate cuts by the Federal Reserve, creating a more challenging environment for growth-oriented sectors whose valuations are particularly sensitive to higher discount rates. While geopolitical events are unlikely to determine the long-term direction of the market on their own, they have become an important driver of short-term volatility and sector rotation.
Sector performance reflected investors’ preference for more defensive and value-oriented areas of the market. Six of the eleven major sectors finished higher. Communication Services led the advance with a 3.45% gain, followed by Financials (+0.90%) and Basic Materials (+0.51%). Technology was the weakest-performing sector, declining 1.04%, while Industrials, Utilities, and Energy also finished modestly lower. The continued underperformance of technology suggests that investors remain cautious toward high-growth stocks until technical conditions improve.
Company-specific trading was particularly challenging across semiconductors, data storage, and AI infrastructure companies. SanDisk Corp. (NASDAQ: SNDK) declined 10.79%, while Micron Technology Inc. (NASDAQ: MU), Western Digital Corp. (NASDAQ: WDC), Seagate Technology Holdings plc (NASDAQ: STX), and Tower Semiconductor Ltd. (NASDAQ: TSEM) all posted substantial losses. Weakness also extended across AI infrastructure, where Bloom Energy Corp. (NYSE: BE) fell 14.8%, Applied Optoelectronics Inc. (NASDAQ: AAOI) declined 10.60%, Coherent Corp. (NYSE: COHR) lost 9.79%, and Corning Inc. (NYSE: GLW) dropped 6.07%. Many AI-related stocks have experienced significant technical deterioration over recent weeks, and several may require an extended period of consolidation before regaining leadership.
Cybersecurity stocks also remained under pressure. Palo Alto Networks Inc. (NASDAQ: PANW) fell 2.88%, while investors continue to monitor Fortinet Inc. (NASDAQ: FTNT) and CrowdStrike Holdings Inc. (NASDAQ: CRWD) for signs of renewed institutional buying. Despite recent weakness, cybersecurity remains one of the strongest long-term structural growth themes within the technology sector.
With technology leadership fading, investors have increasingly rotated toward sectors with stronger earnings visibility and more attractive relative valuations. Financials have begun to regain momentum following recent profit-taking, while energy, aerospace and defense, biotechnology, and selected pharmaceutical companies continue to attract investor interest. Whether this rotation develops into a longer-lasting market leadership change will depend largely on earnings results, inflation data, Federal Reserve policy expectations, and geopolitical developments.
Key Takeaways for Traders and Investors
- Technology remains under pressure. The Nasdaq’s position below its 25-day, 50-day, and 200-day moving averages indicates that downside risk remains elevated until the index can reclaim these important technical levels.
- Sector rotation continues. Investors are shifting capital away from richly valued technology stocks toward financials and other sectors with stronger relative strength and more defensive characteristics.
- Market internals are mixed. The NYSE recorded improving breadth, while the NASDAQ posted a third consecutive session of negative breadth, highlighting the divergence between value-oriented and growth-oriented stocks.
- Oil prices remain a key macroeconomic variable. Sustained increases in crude oil prices could prolong inflationary pressures, delay Federal Reserve easing, and continue to weigh on growth-stock valuations.
- Focus on relative strength. Until technology begins to rebuild its technical foundation, traders may find better opportunities in sectors demonstrating improving momentum and stronger institutional sponsorship, while longer-term investors should continue emphasizing disciplined risk management and portfolio diversification.
NOTICE TO READERS
The Canadian Vanguard Stock Market is about empowering you to build and manage your wealth by yourself. There is certainly no magic in managing finances or wealth but one needs to know what to do and commit to doing what is needed. When you are ready to start the journey to Take Charge and Put Your Destiny In Your Own Hands, start with reading The Canadian Vanguard every market day. If and when you need more related information or to advertise your business products or services in The Canadian Vanguard, Contact Us
Our readers are strongly advised to conduct their own research into individual stocks before making a purchase decision. In addition, investors are advised that past stock performance is no guarantee of future price appreciation. Any recommendation is not a guarantee of any particular stock’s future prices, and The Canadian Vanguard accepts no responsibility or liability for investors’ or readers’ purchases.
Stocks In The News/ Stocks To Watch and Market Strategy will soon be available only to Paying Subscribers. The dollar sign “$” in the Toronto Market section in the articles only stands for Canadian dollar and in the US market section “$” stands for US dollar.
(c) This article is published by The Canadian Vanguard on July 24, 2026