
Dow Leads Mixed U.S. Market as Nasdaq Slips into Correction; TSX Extends Winning Streak
The Canadian Vanguard Stock Market Report Tuesday July 28, 2026 Edition
.
The Toronto Market
Tuesday’s Toronto Market Technical Analysis
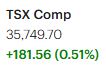
The S&P/TSX Composite Index advanced 181.56 points (0.51%) on Tuesday to close at 35,749.70, extending its winning streak to three consecutive trading sessions and reinforcing the market’s positive intermediate-term trend.
The index opened modestly lower but quickly attracted buyers, establishing a steady upward trajectory shortly after the opening bell. By midday, the TSX had decisively recovered from its early weakness and maintained its advance throughout the afternoon, finishing near the session high. The absence of meaningful intraday volatility suggests institutional buying remained consistent while selling pressure was limited.
From a technical perspective, the TSX continues to exhibit constructive price action. The index remains firmly above its 25-day moving average, while maintaining a substantial margin above both its 50-day and 200-day moving averages. This alignment confirms that the short-, intermediate-, and long-term trends remain firmly bullish.
Market breadth also appeared supportive of the advance, with buyers maintaining control for most of the session. The ability of the index to sustain gains without significant pullbacks indicates improving market momentum and suggests that recent resistance levels have transitioned into areas of underlying support.
Provided the TSX continues to hold above its key moving averages, the technical outlook remains favorable. Momentum continues to build, and a sustained move above recent highs would strengthen the case for a continuation of the current uptrend over the coming sessions.
Tuesday’s TSX Market Statistics
Market internals were constructive on Tuesday, although breadth was only modestly positive. Advancing issues outnumbered declining issues by 1,120 to 1,081, producing an advance-decline ratio of 1.03:1, with 108 issues unchanged. While the positive breadth confirms buyers maintained the upper hand, the narrow margin suggests leadership remained selective rather than broad-based.
Internal momentum strengthened considerably as 161 stocks recorded new 52-week highs, compared with 53 new 52-week lows, resulting in a new highs-to-new lows ratio of 3.03:1. This represents a meaningful improvement from Monday’s 1.71:1 ratio, when 99 stocks reached new highs versus 44 new lows. The sharp expansion in new annual highs is an encouraging sign that market leadership continues to broaden and that underlying momentum remains firmly positive.
The continued expansion in new highs reinforces the TSX’s position as one of the strongest-performing major equity indices this year. Although the advance-decline line was only marginally positive, the substantial increase in stocks registering fresh 52-week highs suggests institutional money continues to rotate into leadership stocks, a characteristic typically associated with healthy bull markets.
Trading activity also improved during the session. Total volume reached 409,796,787 shares, approximately 5% higher than Monday’s 389,051,091 shares. More importantly, total trading volume returned to its 50-day average daily volume, indicating that Tuesday’s advance was supported by improving market participation. Rising prices accompanied by average-to-above-average volume generally strengthen the technical significance of an advance and suggest the current upward trend remains well supported.
.
Tuesday’s Toronto TSX Market Wrap-Up Report
The S&P/TSX Composite Index gained 181.56 points (0.51%) to close at 35,749.70, extending its winning streak to three consecutive trading sessions. While only six of the TSX’s ten major sectors finished higher, the strength of the advancing sectors more than offset weakness elsewhere, allowing the index to close near its session high.
The TSX opened modestly lower before buyers stepped in shortly after the opening bell. The index recovered steadily throughout the morning and maintained its upward momentum into the close with very little intraday volatility. The orderly advance suggests institutional buying remained in control while selling pressure was limited.
From a technical perspective, the market continues to strengthen. The TSX remains comfortably above its 25-day moving average and well above both its 50-day and 200-day moving averages, confirming that the short-, intermediate-, and long-term trends remain firmly bullish.
Sector Performance
Technology was the clear market leader, advancing 3.13%, followed closely by Telecommunications, which also gained 3.13%. Durable Consumer Goods & Services rose 1.85%, while Discretionary Consumer Goods & Services added 1.49%. The Financials sector gained 1.02%, providing meaningful support to the broader index.
On the downside, Energy slipped 0.54% as commodity-related stocks paused following recent strength. Basic Materials was the weakest-performing sector, declining 1.78%, reflecting continued profit-taking across several mining companies.
Market Leadership
Rotation into Financials was one of the day’s notable developments. All of Canada’s Big Six banks closed higher despite the absence of any significant sector-specific news, suggesting investors continue to accumulate high-quality financial stocks. Bank of Nova Scotia led the group, rising 1.65% on approximately 3.1 million shares traded.
Technology leadership remained intact following strong corporate earnings. Celestica Inc. (CLS) was the TSX’s top-performing large-cap stock, surging 9.49% after delivering better-than-expected quarterly earnings following Monday’s market close. Shopify Inc. (SHOP) also attracted buyers, gaining 2.67%, reinforcing the sector’s continued leadership. Mining shares, however, remained under pressure and weighed on the Basic Materials sector.
Market Internals
Although the advance-decline statistics were only modestly positive, market internals continued to improve. Advancing issues outnumbered declining issues 1,120 to 1,081, while 161 stocks registered new 52-week highs compared with just 53 new lows, producing a robust 3.03:1 new highs-to-new lows ratio. This marks a significant improvement from Monday and suggests that market leadership continues to broaden.
Trading activity also strengthened, with 409.8 million shares changing hands, approximately 5% higher than the previous session. Volume returned to its 50-day average, adding credibility to Tuesday’s advance and indicating improving institutional participation.
Technical Outlook
The TSX continues to exhibit constructive technical characteristics. Price action remains firmly within an established uptrend, momentum continues to improve, and the expanding number of new 52-week highs indicates that buying interest is broadening beyond a handful of large-cap stocks. As long as the index remains above its key moving averages, the intermediate-term technical outlook remains positive.
Key Takeaways for Traders and Investors
- The TSX extended its winning streak to three consecutive sessions while closing near the day’s high, confirming that buyers remain in control.
- Technology continues to lead the market, but Tuesday’s strength in Financials suggests sector rotation is broadening—a healthy sign for a sustainable advance.
- The sharp increase in new 52-week highs and the improvement in the new highs-to-new lows ratio signal strengthening internal market momentum.
- Average trading volume accompanying higher prices provides additional confirmation that institutional investors are supporting the current rally.
- While weakness in Basic Materials and Energy warrants monitoring, it has not materially weakened the broader market’s bullish technical structure.
- Unless the TSX falls back below its key moving averages, the path of least resistance continues to favor higher prices, with traders likely to focus on earnings-driven leadership in Technology and renewed strength in Financials.
.
The US Markets
Tuesday’s U.S. Market Indexes
The Dow Jones Industrial Average rallied 537.24 points (1.03%) to close at 52,747.32, leading the major U.S. equity indexes. The S&P 500 advanced 15.60 points (0.21%) to finish at 7,428.78, while the Nasdaq Composite declined 55.17 points (-0.22%) to close at 24,876.91. The Russell 2000 gained 5.77 points (0.20%), ending the session at 2,953.80.
Three of the four major indexes finished higher, with the Nasdaq once again lagging the broader market. The divergence continues to reflect sector rotation away from portions of the technology sector, particularly semiconductor and chip-equipment stocks, even as other areas of technology continue to demonstrate relative strength.

Pressure on semiconductor shares intensified following reports that a Chinese company plans to begin large-scale production of chip-making equipment, raising concerns about increased global competition within the semiconductor equipment industry. The weakness was further highlighted by Sandisk Corp., which declined approximately 11%, weighing on technology sentiment during the session.
The Nasdaq continues to face headwinds as investors reduce exposure to chipmakers and semiconductor-related companies while reallocating capital toward Financials, Industrials, and other cyclical sectors. Until semiconductor stocks stabilize, the Nasdaq may continue to underperform the broader market despite strength in selected technology names.
Technical Outlook
From a technical perspective, the market remains mixed across the major indexes.
The Dow Jones Industrial Average continues to display the strongest relative strength, supported by steady buying in industrial and financial stocks.
The Russell 2000 has slipped below its 25-day moving average, but it remains comfortably above both its 50-day and 200-day moving averages, indicating that its intermediate- and long-term uptrend remains intact despite recent consolidation.
The S&P 500 has also fallen below its 25-day moving average and is currently testing support near its 50-day moving average. While the longer-term trend remains positive with the index still above its 200-day moving average, traders should closely monitor the 50-day average, as a decisive break below that level could trigger additional short-term selling pressure.
The Nasdaq Composite remains the weakest of the four major indexes from a technical standpoint. Following Tuesday’s decline, the index is now trading below both its 25-day and 50-day moving averages, while continuing to hold above its 200-day moving average. This deterioration in the intermediate-term trend suggests momentum has weakened considerably. The Nasdaq will likely require a sustained recovery in semiconductor leadership, accompanied by stronger overall buying pressure, before it can reclaim these important technical levels and re-establish a more constructive technical outlook.
Key Takeaways for Traders and Investors
- Market leadership continues to broaden beyond large-cap technology, with the Dow significantly outperforming the Nasdaq.
- Sector rotation remains a dominant theme, as investors continue shifting capital toward Financials, Industrials, and other economically sensitive sectors while reducing exposure to semiconductor stocks.
- The S&P 500 is approaching an important technical test at its 50-day moving average. How the index behaves around this level could influence market direction over the coming weeks.
- The Nasdaq remains the weakest major index, with its position below both the 25-day and 50-day moving averages reflecting deteriorating intermediate-term momentum.
- Despite recent weakness in technology, all four major indexes continue to trade above their respective 200-day moving averages, indicating that the longer-term bullish trend remains intact. Traders should continue monitoring sector rotation, earnings results, and price action around key technical support levels for confirmation of the market’s next directional move.
Tuesday’s U.S. Market Statistics
New York Stock Exchange (NYSE): Market internals on the New York Stock Exchange (NYSE) were constructive on Tuesday, with advancing issues comfortably outpacing declining issues. The exchange recorded 2,627 advancing stocks, 1,799 declining stocks, and 442 unchanged issues, producing an advance-decline ratio of 1.46:1, or approximately three advancing stocks for every two declining stocks.
Internal momentum also improved. The NYSE recorded 341 new 52-week highs compared with 183 new 52-week lows, resulting in a new highs-to-new lows ratio of 1.86:1, an improvement from 1.42:1 on Monday. The increase in both the number of new highs and the improving ratio suggests that buying interest broadened across the market and that more stocks are participating in the current advance.
Trading activity strengthened as well. Total NYSE volume reached 5.72 billion shares, approximately 12% higher than Monday’s 5.12 billion shares. Rising prices accompanied by stronger trading volume provide constructive technical confirmation, indicating increased investor participation and reinforcing the positive tone of the session.
Overall, NYSE market internals remain supportive of the broader uptrend. Positive market breadth, expanding new 52-week highs, and higher trading volume continue to reflect healthy institutional participation.
Nasdaq Market Internals: Market breadth on the Nasdaq was essentially neutral despite another decline in the Nasdaq Composite Index. Advancing issues narrowly exceeded declining issues, with 2,445 advancing stocks and 2,444 declining stocks, while 408 issues finished unchanged. The resulting advance-decline ratio of 1.00:1 indicates a virtually balanced market beneath the surface, suggesting that weakness was concentrated in a relatively small group of heavily weighted stocks rather than across the entire exchange.
Market internals nevertheless showed modest improvement. The Nasdaq recorded 267 new 52-week highs and 293 new 52-week lows, improving the new highs-to-new lows ratio from 0.63:1 on Monday to 0.91:1 on Tuesday. Although new lows continued to outnumber new highs, the improvement indicates that internal weakness is becoming less pronounced.
Trading activity also increased. Total Nasdaq volume reached 8.87 billion shares, approximately 10% higher than the previous session. The heavier volume reflects elevated investor activity, largely driven by continued repositioning within the technology sector.
The Nasdaq’s weakness remained concentrated in semiconductor and chip-equipment stocks, which continued to experience selling pressure. Because these companies carry significant weight within the Nasdaq Composite, declines in this group continued to weigh disproportionately on the index even as market breadth across the broader exchange remained relatively balanced.
Technical Outlook
From a technical perspective, the Nasdaq remains the weakest of the major U.S. equity indexes. The index is currently trading below both its 25-day and 50-day exponential moving averages, although it continues to hold above its 200-day moving average, preserving its longer-term uptrend.
The recent deterioration in intermediate-term momentum suggests traders should remain selective when initiating new positions in semiconductor stocks. Until the sector establishes a clear base and begins to reclaim key moving averages, volatility is likely to remain elevated. Investors may wish to monitor for signs of improving relative strength, increasing institutional accumulation, and sustained price stabilization before aggressively adding exposure to semiconductor-related names.
Key Takeaways for Traders and Investors
- NYSE internals remain healthy. Positive breadth, expanding new 52-week highs, and stronger trading volume continue to support the broader market’s bullish technical structure.
- Nasdaq weakness remains concentrated rather than broad-based. Market breadth was essentially neutral, indicating that selling pressure continues to be focused primarily in large-cap semiconductor and chip-equipment stocks.
- Internal momentum on the Nasdaq is improving. While new lows still exceeded new highs, Tuesday’s improvement in the new highs-to-new lows ratio suggests selling pressure may be beginning to moderate.
- Sector rotation remains the dominant market theme. Capital continues to rotate away from portions of the semiconductor industry while Financials, Industrials, and other cyclical sectors attract increasing investor interest.
- The longer-term technical outlook remains constructive. Both the NYSE and Nasdaq continue to exhibit characteristics of an ongoing bull market, although traders should continue monitoring the Nasdaq’s key moving averages for signs of renewed technical strength before increasing exposure to semiconductor stocks.
- Given the current state of the market, investors may wish to consider reduced exposure and holding more cash and reduced stocks holding in the portfolio in the short term.
.
NOTICE TO READERS
The Canadian Vanguard Stock Market is about empowering you to build and manage your wealth by yourself. There is certainly no magic in managing finances or wealth but one needs to know what to do and commit to doing what is needed. When you are ready to start the journey to Take Charge and Put Your Destiny In Your Own Hands, start with reading The Canadian Vanguard every market day. If and when you need more related information or to advertise your business products or services in The Canadian Vanguard, Contact Us
Our readers are strongly advised to conduct their own research into individual stocks before making a purchase decision. In addition, investors are advised that past stock performance is no guarantee of future price appreciation. Any recommendation is not a guarantee of any particular stock’s future prices, and The Canadian Vanguard accepts no responsibility or liability for investors’ or readers’ purchases.
Stocks In The News/ Stocks To Watch and Market Strategy will soon be available only to Paying Subscribers. The dollar sign “$” in the Toronto Market section in the articles only stands for Canadian dollar and in the US market section “$” stands for US dollar.
(c) This article is published by The Canadian Vanguard on July 281, 2026