
Indexes Plunge as Fed Holds Rates Steady Amid Persistent Geopolitical Tensions
The Canadian Vanguard Stock Market Report Wednesday July 29, 2026 Edition
.
The Toronto Market
Wednesday’s Toronto Market Index
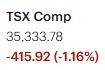
The S&P/TSX Composite Index fell 415.92 points (-1.16%) on Wednesday to close at 35,333.78.
The TSX posted a sharp decline, giving back nearly all of the gains accumulated over the previous three trading sessions. Despite today’s setback, the index has been one of the stronger-performing major equity benchmarks and continues to exhibit relative strength.

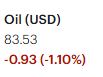
Today’s weakness was likely driven by profit-taking, along with investor concerns over escalating geopolitical tensions abroad. Although the conflict is occurring far from Canada, developments affecting global energy markets can have a meaningful impact on investor sentiment, as oil remains a critical commodity and the global economy is highly interconnected, particularly with respect to energy supplies.
The TSX declined shortly after the market opened but recovered steadily throughout most of the session, nearly returning to the previous day’s closing level. However, a broad-based selloff emerged during the final hour of trading, sending the index down roughly 400 points before the close.
From a technical perspective, the TSX continues to display underlying strength. The index remains above its 25-day moving average and is trading well above both its 50-day and 200-day moving averages, suggesting that the longer-term upward trend remains intact despite today’s sharp pullback.
Wednesday’s TSX Market Statistics
Market breadth was negative on Wednesday as declining issues significantly outnumbered advancing issues on the Toronto Stock Exchange. There were 1,618 declining issues compared with 626 advancing issues, resulting in a decliner-to-advancer ratio of 2.58:1, or approximately five declining stocks for every two advancing stocks. An additional 122 issues closed unchanged.
Despite the negative market breadth, the ratio of new 52-week highs to new 52-week lows remained positive at 3.03:1, an improvement from 1.71:1 in the previous session. This indicates that, although selling pressure was broad-based during the day, a greater number of stocks continued to reach new highs than new lows.
Total trading volume on the TSX was 467,283,673 shares, approximately 14% higher than the 409,796,787 shares traded in the previous session, reflecting increased market activity.
.
Wednesday’s Toronto TSX Market Wrap-Up Report
The S&P/TSX Composite Index fell 415.92 points (-1.16%) to close at 35,333.78, giving back nearly all of the gains recorded over the previous three trading sessions. After opening lower, the index recovered through much of the day and nearly reached the previous session’s closing level before broad-based selling pressure emerged during the final hour of trading. The late-session selloff erased approximately 400 points from the index before the closing bell.
Market breadth was decisively negative. Declining issues outnumbered advancing issues by 1,618 to 626, a decliner-to-advancer ratio of 2.58:1, while 122 issues closed unchanged. Despite the broad weakness, the ratio of new 52-week highs to new lows improved to 3.03:1, compared with 1.71:1 in the previous session, indicating that many stocks continue to participate in the longer-term uptrend despite today’s selling pressure.
Trading activity increased as 467.3 million shares changed hands on the TSX, approximately 14% above the previous session’s volume, reflecting heavier institutional participation during the day’s decline.
Sector Performance
Only three of the ten major TSX sectors finished higher.
The Energy sector led the market with a 1.53% gain, benefiting from higher crude oil prices and continued strength in energy-related shares. Telecommunication Services advanced 0.56%, while Technology edged higher by 0.17%.
The remaining sectors finished lower. Consumer Durables & Services slipped 0.10%, Consumer Discretionary declined 0.54%, Basic Materials fell 0.96%, Industrials lost 1.19%, and Financials led the decline with a 2.71% drop.
The weakness in Financials weighed heavily on the overall index. Canada’s six largest banks all declined by roughly 3%, reflecting broad-based selling across the sector.
Among the major banks:
- Canadian Imperial Bank of Commerce (CM) declined 3.22% on volume of 2.27 million shares.
- Toronto-Dominion Bank (TD) fell 3.20% on 4.86 million shares traded.
- Bank of Montreal (BMO) lost 3.16% on volume of 4.98 million shares.
Market Highlights
Energy stocks were among the strongest performers as investors responded to ongoing geopolitical tensions that supported crude oil prices. Strength in the energy sector helped offset some of the broader market weakness.
The sharp decline in Financials appeared consistent with profit-taking following the sector’s recent advance. Banking stocks had been trading near recent highs and had become extended after several weeks of strong performance, making the group vulnerable to a round of selling as investors repositioned their portfolios.
Energy and resource companies dominated the list of top-performing TSX stocks. Strathcona Resources Ltd. gained 5.37%, while Canadian Natural Resources Ltd. advanced 4.61%.
Technology also produced several notable winners. CGI Inc. (GIB) rose 4.27%, and Open Text Corp. (OTEX) gained 4.03%.
Among other notable performers, Thomson Reuters Corp. (TRI) advanced 2.61%, while Suncor Energy Inc. (SU) added 2.57%.
Technical Outlook
Despite Wednesday’s sharp decline, the broader technical picture remains constructive. The TSX continues to trade above its 25-day moving average and remains comfortably above both its 50-day and 200-day moving averages, indicating that the intermediate- and long-term uptrends remain intact. While the market experienced a broad-based pullback, the underlying trend has not yet been compromised.
.
Key Takeaways for Traders and Investors
- The late-session selloff suggests that investors became more risk-averse into the close, resulting in broad-based profit-taking across the market.
- Financial stocks were the primary drag on the TSX, while Energy provided leadership as higher oil prices supported the sector.
- Although market breadth was weak, the improving ratio of new highs to new lows suggests that the longer-term health of the market remains better than the one-day decline would indicate.
- Higher trading volume points to increased institutional activity, making the coming trading sessions important in determining whether Wednesday’s decline was a normal correction or the beginning of a deeper pullback.
- From a technical standpoint, the TSX remains in an established uptrend while trading above its key moving averages. Investors should monitor whether the index can hold these support levels during the next several sessions.
.
The US Markets
.
Wednesday’s U.S. Market Indexes
U.S. equities experienced a broad-based selloff on Wednesday, with all four major indexes closing sharply lower as selling pressure accelerated into the final hour of trading.
The Dow Jones Industrial Average fell 1,153.18 points (-2.19%) to close at 51,594.14. The S&P 500 declined 112.63 points (-1.52%) to 7,316.15, marking one of its largest single-day declines in recent weeks. The Nasdaq Composite dropped 433.97 points (-1.74%) to 24,442.94, while the Russell 2000 lost 47.49 points (-1.61%) to finish at 2,906.31.

Selling pressure intensified during the final half hour of trading, suggesting increased institutional activity as investors reduced equity exposure ahead of the market close. The broad nature of the decline indicates that investors were actively rotating capital across multiple sectors rather than responding to company-specific developments.
Technology stocks, particularly the semiconductor and chip sectors, remained under significant pressure. Several high-profile semiconductor companies have experienced substantial declines over the past week as investors continued to reduce exposure to the group following its extended rally earlier in the year. The weakness in semiconductor stocks remained a major headwind for the Nasdaq Composite, which continues to underperform the broader market.
From a technical perspective, the Russell 2000 has weakened below its 25-day moving average and closed near its 50-day moving average, although it remains comfortably above its 200-day moving average, indicating that its longer-term trend has not yet been broken.
The S&P 500 also closed below its 25-day moving average and is now testing support near its 50-day moving average. The index continues to trade above its 200-day moving average, leaving its longer-term uptrend intact despite the recent deterioration in short-term momentum.
The Nasdaq Composite experienced the greatest technical damage among the major indexes. Following Wednesday’s decline, the index has fallen below both its 25-day and 50-day moving averages. While it remains above its 200-day moving average, the recent loss of short- and intermediate-term support suggests that the technology sector remains vulnerable if selling pressure persists.
Overall, Wednesday’s session represented a meaningful deterioration in market sentiment. Although the primary long-term trends remain positive, the breakdown below key short-term moving averages in several major indexes suggests that market volatility may remain elevated until buyers regain control and the indexes establish new areas of technical support.
.
Wednesday’s U.S. Market Statistics
New York Stock Exchange (NYSE): Market breadth on the New York Stock Exchange was decisively negative as declining issues significantly outnumbered advancing issues. There were 3,174 declining issues, 1,342 advancing issues, and 456 unchanged issues, producing a decliner-to-advancer ratio of 2.36:1, or approximately five declining stocks for every two advancing stocks.
The NYSE recorded 221 new 52-week highs and 243 new 52-week lows, compared with 341 new highs and 183 new lows in the previous session. As a result, the ratio of new highs to new lows declined to 0.91, down from 1.86 yesterday, indicating a noticeable deterioration in underlying market strength.
Total NYSE trading volume reached 5.95 billion shares, approximately 4% higher than the 5.72 billion shares traded in the previous session. Although market breadth was broadly negative, the relatively modest increase in trading volume suggests that selling pressure intensified without the characteristics of widespread panic liquidation.
NASDAQ: Market breadth on the NASDAQ was also strongly negative. Declining issues totaled 3,532, while 1,378 issues advanced and 380 issues closed unchanged, resulting in a decliner-to-advancer ratio of 2.56:1, or approximately five declining stocks for every two advancing stocks.
The exchange recorded 164 new 52-week highs and 351 new 52-week lows, compared with 267 new highs and 293 new lows in the previous session. Consequently, the ratio of new highs to new lows declined to 0.47 from 0.91 the previous day, reflecting a further weakening in market internals as new lows continued to expand while new highs contracted.
Total NASDAQ trading volume was 8.62 billion shares, approximately 3% lower than the 8.87 billion shares traded in the previous session. The combination of weaker volume and broad market declines suggests that, while selling pressure remained significant, the session did not exhibit the characteristics typically associated with indiscriminate panic selling.
Technology stocks, particularly semiconductor and chip manufacturers, continued to be the primary source of weakness. Profit-taking in this group has persisted for approximately two weeks following an extended rally earlier in the year, contributing to the NASDAQ’s recent underperformance.
From a technical perspective, the NASDAQ Composite remains below both its 25-day and 50-day exponential moving averages while continuing to trade above its 200-day moving average. This indicates that the short- and intermediate-term trends have weakened, although the longer-term uptrend remains intact.
Key Takeaways for Traders and Investors
- Market breadth was decisively negative on both the NYSE and NASDAQ, with decliners outnumbering advancers by more than two to one.
- Internal market strength weakened as the number of new 52-week highs declined and new lows increased on both exchanges.
- Trading volume changed only modestly, suggesting that institutional selling and profit-taking, rather than broad panic liquidation, dominated Wednesday’s session.
- The semiconductor sector remains the weakest area of the market and continues to weigh heavily on the NASDAQ Composite.
- Traders should exercise caution when initiating new positions in semiconductor stocks until technical conditions improve and buying momentum returns. Longer-term investors may prefer to wait for signs of stabilization before increasing exposure to the sector.
.
Wednesday’s U.S. Market Wrap-Up Report
U.S. equities experienced a broad-based selloff on Wednesday as all four major market indexes closed sharply lower. Selling pressure intensified during the final hour of trading, resulting in one of the weakest sessions in recent weeks. The Dow Jones Industrial Average led the decline, falling 2.19%, while the S&P 500 lost 1.52%, the Nasdaq Composite declined 1.74%, and the Russell 2000 retreated 1.61%.
The day’s market action reflected a combination of profit-taking, sector rotation, and investor reaction to the latest Federal Reserve policy announcement. Although the Federal Reserve left interest rates unchanged as expected, the decision was not unanimous, with three voting members favoring an interest rate increase. Initially, equity markets responded positively following the announcement, but sentiment deteriorated as the session progressed. Selling accelerated into the close, suggesting increased institutional activity as investors reduced equity exposure.
Rising geopolitical tensions also contributed to a more cautious market environment. Higher crude oil prices supported energy shares but weighed on broader market sentiment as investors assessed the potential impact of higher energy costs on inflation and economic growth.
Market internals confirmed the broad-based weakness. On the New York Stock Exchange, declining issues outnumbered advancing issues by 2.36 to 1, while the NASDAQ recorded a 2.56-to-1 decliner-to-advancer ratio. New 52-week highs declined on both exchanges, while new lows increased, indicating that market participation weakened during the session. Trading volume increased modestly on the NYSE and declined slightly on the NASDAQ, suggesting that the selloff was driven primarily by institutional portfolio repositioning and profit-taking rather than widespread panic liquidation.
Sector Performance
Only two of the eleven major S&P sectors finished higher.
The Energy sector led the market with a 2.12% gain, benefiting from stronger crude oil prices amid geopolitical uncertainty. Consumer Durables & Services was the only other positive sector, advancing 0.36%.
The remaining sectors finished lower. Health Care declined 0.54%, Basic Materials lost 1.24%, Utilities fell 1.55%, Financials dropped 1.88%, Technology declined 1.94%, while Industrials was the weakest-performing sector with a 2.73% loss.
Company Highlights
Technology, particularly semiconductor and chip manufacturers, remained the primary source of market weakness.
SanDisk Corp. (SNDK) fell another 7.32%, extending Tuesday’s sharp decline. The stock has now lost approximately 50% over the past four weeks, placing it well below both its 25-day and 50-day moving averages, although it continues to trade above its 200-day moving average.
The semiconductor industry has remained under sustained selling pressure over the past two weeks as investors continued to rotate capital away from one of the market’s strongest-performing groups earlier in the year. The weakness across chip stocks remained a significant drag on the NASDAQ Composite throughout Wednesday’s session.
Technical Outlook
The technical picture deteriorated across the major indexes.
The S&P 500 has fallen below its 25-day moving average and is now testing support near its 50-day moving average, while remaining comfortably above its 200-day moving average.
The Russell 2000 also closed below its 25-day moving average and finished near its 50-day moving average, although its longer-term trend remains positive above the 200-day moving average.
The NASDAQ Composite experienced the greatest technical deterioration. The index is now trading below both its 25-day and 50-day moving averages, reflecting continued weakness in large-cap technology and semiconductor shares. Although the NASDAQ remains above its 200-day moving average, the loss of key short- and intermediate-term support suggests that additional volatility may persist until buyers return to the technology sector.
Key Takeaways for Traders and Investors
- Wednesday’s decline was broad-based and intensified late in the session, indicating increased institutional selling and portfolio repositioning.
- The Federal Reserve’s policy statement and the split vote on interest rates contributed to a more cautious market tone despite no change in the benchmark interest rate.
- Energy was the market’s clear leader as higher oil prices supported the sector, while Technology and Industrials experienced the heaviest selling.
- Market breadth weakened significantly on both the NYSE and NASDAQ, confirming that selling pressure extended well beyond a handful of large-cap stocks.
- Semiconductor stocks continue to exhibit relative weakness and remain in corrective territory. Traders should monitor the group for signs of stabilization before establishing new positions.
- Despite the recent pullback, all major U.S. indexes continue to trade above their respective 200-day moving averages, indicating that the longer-term bull market remains intact. However, the deterioration in short-term technical indicators suggests that investors should expect elevated volatility and remain selective when initiating new positions.
.
NOTICE TO READERS
The Canadian Vanguard Stock Market is about empowering you to build and manage your wealth by yourself. There is certainly no magic in managing finances or wealth but one needs to know what to do and commit to doing what is needed. When you are ready to start the journey to Take Charge and Put Your Destiny In Your Own Hands, start with reading The Canadian Vanguard every market day. If and when you need more related information or to advertise your business products or services in The Canadian Vanguard, Contact Us
Our readers are strongly advised to conduct their own research into individual stocks before making a purchase decision. In addition, investors are advised that past stock performance is no guarantee of future price appreciation. Any recommendation is not a guarantee of any particular stock’s future prices, and The Canadian Vanguard accepts no responsibility or liability for investors’ or readers’ purchases.
Stocks In The News/ Stocks To Watch and Market Strategy will soon be available only to Paying Subscribers. The dollar sign “$” in the Toronto Market section in the articles only stands for Canadian dollar and in the US market section “$” stands for US dollar.
(c) This article is published by The Canadian Vanguard on July 29, 2026