
Nasdaq Leads Broad U.S. Market Rally, but Semiconductor Stocks Continue to Lag
The Canadian Vanguard Stock Market Report Weekend August 7 – 9, 2026 Edition
.
The Toronto Market
Friday’s Toronto Market Index: Bulls Regain Control
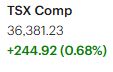
The S&P/TSX Composite Index finished Friday’s session on a strong note, advancing 244.92 points, or 0.68%, to close at 36,381.23. The gain marked a decisive reversal from Thursday’s weakness and returned the index to a more constructive short-term trading posture.
The TSX opened significantly above Thursday’s close of 36,136 and spent much of the session consolidating around the 36,300 level. Although intraday trading was somewhat volatile, sellers were unable to sustain downside pressure. Buying interest strengthened during the final hour, pushing the index higher into the close and providing an encouraging indication that buyers remain willing to defend the market on weakness.

Technical and Market Strategy
From a trend perspective, the technical picture remains favourable. The TSX is trading comfortably above its 25-day, 50-day, and 200-day moving averages. The alignment of price above these key averages continues to support the view that the primary trend remains bullish.
For traders, Friday’s price action is particularly noteworthy because the index not only recovered from the previous session’s weakness but also strengthened into the close. A strong close following intraday consolidation can signal that buyers are gaining control of near-term momentum.
The 36,300 area is now an important short-term reference point. Holding above this level on subsequent sessions would strengthen the case that Friday’s advance represents a continuation of the prevailing uptrend rather than simply a one-day rebound. A sustained move above Friday’s closing level of 36,381 would provide additional confirmation of upward momentum and could bring fresh buying interest into the market.
Conversely, a failure to hold the 36,300 area would suggest that Friday’s strength is losing momentum. Traders should then watch for a deeper retracement toward the next levels of technical support, particularly around the recent consolidation areas and the short-term moving averages.
For investors, the broader trend remains the more important consideration. The TSX’s position above its 25-day, 50-day, and 200-day moving averages indicates that the longer-term market structure remains constructive. Until that structure deteriorates, periods of weakness may continue to be viewed as potential opportunities to accumulate quality positions rather than as evidence of a confirmed trend reversal.
Trading Outlook
The immediate bias remains bullish, but traders should look for confirmation rather than chase Friday’s advance. The preferred strategy is to monitor whether the index can maintain its position above the 36,300 area and subsequently establish a higher high above 36,381.
A sustained move higher, accompanied by improving breadth and volume, would strengthen the bullish case. On the other hand, a decisive break below near-term support, particularly if accompanied by expanding selling volume, would warrant greater caution and could signal that the recent consolidation is developing into a broader correction.
Bottom line: Friday’s session restored bullish momentum to the TSX. The index remains in a favourable technical position, with price comfortably above its key moving averages. For now, the strategy remains to favour the prevailing trend while closely monitoring 36,300 as an important near-term level of support and 36,381 as the first upside confirmation level.
Friday’s TSX Market Statistics: Broad-Based Strength Confirms the Advance
Market breadth on the TSX was decidedly positive on Friday, with advancing issues substantially outnumbering declining issues. There were 1,359 advancers versus 788 decliners, producing an advancer-to-decliner ratio of approximately 1.72:1. In other words, nearly two stocks advanced for every stock that declined. A further 130 issues finished unchanged.
The strength in breadth was reinforced by the market’s 52-week statistics. The TSX recorded 119 new 52-week highs and 22 new 52-week lows, compared with 89 new highs and 29 new lows on Thursday. This represents a 33.7% increase in new highs and a 24.1% decline in new lows from the previous session.
As a result, the new-high-to-new-low ratio improved substantially, rising to approximately 5.4:1, compared with roughly 3.1:1 on Thursday. This is an important technical improvement because it indicates that Friday’s advance was supported not only by the major index but also by a broader expansion in the number of stocks participating in the market’s upward movement.
Breadth Signals Strong Internal Momentum
From a market-strategy perspective, Friday’s breadth statistics are particularly encouraging. A strong advance accompanied by a favourable advancer-decliner ratio and a significantly greater number of new 52-week highs than new lows provides evidence of broad-based internal market strength.
The improvement in the new-high/new-low ratio is especially noteworthy. When new highs expand while new lows contract, it generally indicates that more stocks are participating in the prevailing uptrend and that downside pressure is relatively contained.
For traders, this reduces the likelihood that Friday’s TSX advance was driven primarily by a small number of large-cap stocks. Instead, the breadth data suggest that participation was relatively broad, providing stronger confirmation of the bullish technical picture.
Volume Adds Confirmation
Trading activity also provided constructive confirmation. Total TSX volume reached 472,456,921 shares, approximately 6.4% higher than the 443,947,440 shares traded on Thursday.
The combination of higher index prices, stronger market breadth, expanding new highs, fewer new lows, and increased trading volume represents a favourable confluence of technical signals. In market terms, this is generally more significant than an index advance occurring on weak participation.
Trading and Investment Outlook
The internal statistics therefore strengthen Friday’s bullish signal. Traders should monitor whether this improvement in breadth persists over the coming sessions. Continued expansion in new highs, a sustained advancer-to-decliner ratio above 1:1, and healthy or increasing volume would provide further confirmation that the underlying market trend remains constructive.
Conversely, traders should become more cautious if the TSX continues to rise while breadth deteriorates—for example, if advancing issues begin to fall relative to decliners, new highs contract, new lows expand, or volume weakens. Such a divergence between the index and its underlying market internals could provide an early warning that upward momentum is losing strength.
Bottom line: Friday delivered a strong breadth day for the TSX. The 1.72:1 advancer-decliner ratio, approximately 5.4:1 new-high/new-low ratio, 33.7% increase in new highs, 24.1% decline in new lows, and 6.4% increase in trading volume collectively point to solid internal participation. For traders and investors, the breadth data reinforce the broader bullish technical setup and suggest that, at present, the market’s advance has meaningful internal support
.
Friday’s Toronto TSX Market Wrap-Up Report
.
TSX Rebounds as Market Breadth and Momentum Strengthen
The S&P/TSX Composite Index rebounded strongly on Friday, gaining 244.92 points, or 0.68%, to close at 36,381.23. The advance followed Thursday’s decline and Wednesday’s gain, leaving the TSX in an increasingly familiar pattern of alternating daily moves.
While the market’s recent back-and-forth behaviour reflects the elevated level of uncertainty surrounding geopolitical developments in the Middle East, Friday’s session provided a more constructive signal beneath the surface. The key question for traders and investors is not whether the index moves higher or lower on any particular day, but whether the underlying market trend continues to strengthen or begins to deteriorate.
For now, the technical evidence remains favourable.
The TSX opened well above Thursday’s close of 36,136 and traded around the 36,300 level for much of the session before buyers stepped in during the final hour. The stronger finish is significant because it indicates that buyers were willing to commit capital into the close rather than allowing the early gains to fade.
The index also remains comfortably above its 25-day, 50-day, and 200-day moving averages, keeping the short-, intermediate-, and longer-term trend structures firmly constructive.
The Canadian 10-year government bond yield increased 2.12 basis points to 3.64% on Friday. Traders should continue to monitor bond yields alongside equities, particularly because changes in yields can influence the relative attractiveness of equities and affect interest-sensitive sectors.
Market Breadth Confirms the Advance
One of the strongest features of Friday’s session was the breadth of participation.
There were 1,359 advancing issues versus 788 declining issues, producing an advancer-to-decliner ratio of approximately 1.72:1. In practical terms, nearly two stocks advanced for every stock that declined. Another 130 issues finished unchanged.
The 52-week statistics were even more encouraging. The TSX recorded 119 new 52-week highs and only 22 new 52-week lows, compared with 89 new highs and 29 new lows in the previous session.
This represents an increase of approximately 34% in new highs and a decline of approximately 24% in new lows. The new-high-to-new-low ratio consequently improved to approximately 5.4:1, compared with roughly 3.1:1 in the previous session.
For market technicians, this is an important development. A rising index accompanied by expanding new highs, contracting new lows, and a positive advance-decline ratio is generally a healthier signal than an index advance driven by only a handful of large-cap stocks.
Trading volume provided additional confirmation. Approximately 472.5 million shares changed hands on the TSX, up about 6.4% from the 443.9 million shares traded in the previous session.
The combination of higher prices, positive breadth, more new highs, fewer new lows, and higher volume gives Friday’s advance considerably more credibility.
Sector Performance: Materials Lead
Sector performance was considerably more selective, with only four of the ten major TSX sectors posting gains.
Basic Materials was by far Friday’s strongest sector, advancing 4.46%. The sector has now recorded strong gains in consecutive sessions and has emerged as an important source of market leadership.
Technology followed, gaining 1.82%. The consumer-oriented sectors also finished higher, with Discretionary Consumer Goods & Services advancing 0.68% and Durable Consumer Goods & Services gaining 0.08%.
Financials, one of the TSX’s most important sectors by market capitalization, declined 0.25%, while Energy was the weakest-performing major sector.
The strength in Basic Materials deserves particular attention from traders. The sector’s leadership is consistent with the heavy representation of mining stocks among Friday’s strongest performers.
Retail-related stocks also continue to warrant attention. Their recent relative strength suggests that selected consumer names may be developing momentum independent of the broader sector rotation.
Energy, meanwhile, remains particularly sensitive to developments surrounding the Middle East. Any meaningful shift toward de-escalation could put downward pressure on crude oil prices and, consequently, energy equities. Conversely, renewed geopolitical tensions could produce the opposite reaction.
For traders, this makes Energy a sector where headline risk remains unusually important.
Mining Stocks Dominate the Leaders
Friday was another exceptionally strong session for mining stocks, particularly precious-metals producers and other resource companies.
Remarkably, 21 of the top 25 TSX performers were precious-metals mining stocks, underscoring the extent to which capital was flowing into the mining complex.
B2Gold Corp. (BTO) was the TSX’s strongest-performing stock, surging 22.47%. The small-cap miner closed at $7.03, with approximately 20.1 million shares changing hands. The combination of a large price move and substantial volume makes BTO one of the more notable momentum names to monitor following Friday’s session.
Among the strongest non-precious-metals mining and resource-related performers were Russel Metals (RUS), Altus Group (AIF), CES Energy Solutions (CEU), and Jamieson Wellness (JWEL).
Russel Metals, which reported earnings after Thursday’s close, jumped approximately 15%, with about 463,000 shares traded.
Altus Group advanced 15.05%, closing at $52.43 on approximately 347,000 shares.
CES Energy Solutions gained 11.5%, closing at $18.33, with approximately 2.0 million shares traded.
Jamieson Wellness also posted a strong gain, rising 9.95% to close at $45.48, with approximately 1.6 million shares changing hands.
For momentum traders, these stocks illustrate an important characteristic of the current market: earnings catalysts combined with strong sector momentum can produce outsized moves. However, traders should distinguish between a one-day momentum surge and the beginning of a sustainable trend. Follow-through in subsequent sessions, supported by volume, will be important.
Stock Watch: Shopify
Shopify Inc. (SHOP) remains an important stock to watch.
The stock’s technical picture has improved considerably. Several weeks ago, Shopify was trading below its 25-day, 50-day, and 200-day moving averages. The chart has since undergone a significant repair, and the stock is now trading above all three benchmarks.
The company’s earnings report released on Wednesday provided an additional catalyst and appears to have reinforced the stock’s current upward momentum.
From a trading perspective, the important consideration now is whether Shopify can maintain its position above these moving averages and establish a sustained series of higher highs and higher lows.
Traders should resist the temptation to chase an extended move simply because the chart looks strong. Instead, watch for constructive consolidation, successful tests of support, and renewed volume on subsequent advances. Those characteristics would provide stronger evidence that the trend is sustainable.
.
Key Takeaways for Traders and Investors
1. The broader TSX trend remains bullish.
The index is trading comfortably above its 25-day, 50-day, and 200-day moving averages. Until that technical structure deteriorates, the prevailing trend remains upward.
2. Friday’s advance had strong internal support.
The 1.72:1 advancer-decliner ratio, approximately 5.4:1 new-high/new-low ratio, and higher trading volume all strengthen the quality of Friday’s advance.
3. Watch market breadth for early warnings.
A continued expansion in new highs and a contraction in new lows would reinforce the bullish case. Conversely, if the TSX rises while breadth deteriorates, traders should become more cautious.
4. Basic Materials is the sector to watch.
The sector’s 4.46% gain and the extraordinary concentration of mining stocks among Friday’s leaders indicate strong momentum in the resource complex. Traders should watch for follow-through rather than assume that one exceptionally strong session guarantees another.
5. Geopolitical headlines remain a source of volatility.
The Middle East situation continues to create headline risk, particularly for oil, Energy stocks, commodities, and interest-rate expectations. Traders should account for the possibility of sharp reversals when positioning around geopolitical news.
6. Earnings-driven momentum remains important.
Russel Metals and Shopify demonstrate how earnings catalysts can accelerate an existing technical trend. Stocks showing both fundamental catalysts and improving price structure deserve attention.
7. Do not confuse a strong market with a market that cannot decline.
The most important discipline for traders is to follow the evidence rather than attempt to predict the next market move. A bullish trend can continue longer than expected, but it can also change quickly. The objective should be to identify emerging trends early, participate while the evidence remains favourable, and recognize when momentum and market internals begin to fade.
Market Strategy Going Forward
The current evidence favours a buy-the-strength/controlled-pullback mindset rather than an aggressive bearish stance, but selectivity remains important.
For momentum traders, the focus should be on stocks and sectors demonstrating three characteristics: relative strength, strong trading volume, and a clear catalyst or technical breakout. Friday’s mining leaders provide several examples of this type of setup.
For swing traders, the next priority should be determining whether Friday’s advance receives follow-through. A sustained move above 36,381, particularly if accompanied by continued positive breadth and healthy volume, would strengthen the bullish case for the TSX.
The 36,300 area is an important near-term reference level. Holding above this area would suggest that Friday’s buyers remain in control. A decisive move back below it, particularly if accompanied by deteriorating breadth, would weaken the immediate bullish setup.
For longer-term investors, the most important signal remains the position of the TSX relative to its major moving averages. As long as the index continues to hold above its 25-day, 50-day, and 200-day averages and market breadth remains healthy, the larger trend remains constructive.
Bottom Line
Friday was more than simply another positive session for the TSX. The breadth, new-high/new-low statistics, trading volume, and price structure all improved simultaneously, providing meaningful confirmation that the market’s internal condition remains strong.
The immediate challenge for the bulls is follow-through. If the TSX can maintain its position above 36,300, push through 36,381, and continue to generate expanding breadth and new highs, the bullish trend will gain further technical confirmation.
The market, however, does not need to be predicted—it needs to be monitored.
For traders and investors, the strategy should therefore remain focused on following price, breadth, volume, sector leadership, and momentum, while being prepared to adjust when the evidence changes. The objective is not to forecast every market move, but to participate when the trend is favourable and reduce exposure when the evidence begins to indicate that the trend is losing strength.
.
The US Markets
Friday’s U.S. Market Indexes: Nasdaq Leads a Broad-Based Rebound
U.S. equities staged a strong rebound on Friday, reversing much of Thursday’s disappointing performance as all four major market indexes finished higher. The advance was led decisively by the Nasdaq Composite and supported by renewed strength in small-cap stocks.
The Dow Jones Industrial Average gained 151.83 points, or 0.28%, to close at 54,036.93. The S&P 500 advanced 47.68 points, or 0.62%, finishing at 7,757.64. The Nasdaq Composite rallied 342.26 points, or 1.30%, to close at 26,690.62, making it the strongest performer among the four major indexes. The Russell 2000 also delivered a strong session, gaining 32.95 points, or 1.10%, to finish at 3,034.49.

Friday’s market action was broadly constructive, with buying interest returning across both large-cap and small-cap equities. The Dow was the clear laggard, but even its 0.28% gain represented a meaningful recovery following Thursday’s weakness.
Nasdaq Regains Leadership
The most notable development was the Nasdaq’s return to relative strength.
The technology-heavy index gained 1.30%, substantially outperforming both the Dow and S&P 500. This is particularly significant because the Nasdaq had already experienced strong momentum in the preceding sessions. Despite Thursday’s decline, the index remains comfortably above its 25-day, 50-day, and 200-day moving averages.
From a technical perspective, this keeps the Nasdaq’s intermediate- and longer-term trend firmly constructive.
The recent relative-strength shift also deserves attention. The S&P 500 had been outperforming the other major indexes for a period, but the Nasdaq now appears to be regaining its leadership position. For momentum-oriented traders, a sustained return to Nasdaq leadership would be an important signal because leadership from growth and technology stocks can help reinforce the broader market advance.
The key issue now is follow-through. Traders should watch whether the Nasdaq can continue to outperform the S&P 500 in subsequent sessions while maintaining its position above the major moving averages.
Small-Caps Show Renewed Strength
The Russell 2000 was another notable performer, gaining 1.10% and finishing at 3,034.49.
The small-cap index remains above its 25-day, 50-day, and 200-day moving averages, keeping its technical structure positive.
The Russell 2000’s relative strength is particularly important for market analysts because small-cap participation can provide useful information about the breadth and health of a market advance. When smaller companies begin participating alongside technology and large-cap stocks, it suggests that buying interest is spreading beyond the market’s largest and most heavily followed companies.
Friday’s performance—where the Russell 2000 finished only modestly behind the Nasdaq—therefore deserves attention.
For traders, sustained strength in the Russell 2000 could create additional opportunities among small-cap momentum stocks. For investors, continued participation from small-caps would provide a more convincing confirmation that the broader equity market advance has breadth rather than being driven primarily by a narrow group of mega-cap stocks.
S&P 500 Remains in a Strong Position
The S&P 500 gained 0.62% and remains above its 25-day, 50-day, and 200-day moving averages.
Although the index has recently been the relative-strength leader among the major U.S. benchmarks, Friday’s performance suggests that leadership may be broadening or rotating back toward growth-oriented equities.
For traders, this is an important distinction. A market in which leadership rotates between the S&P 500, Nasdaq, and small-caps can be healthier than one in which only a single index or narrow group of stocks continues to advance.
The S&P 500 therefore remains an important benchmark for determining whether the broader market trend is intact, while the Nasdaq and Russell 2000 provide useful signals about growth and risk appetite.
Dow Remains the Laggard
The Dow gained only 0.28%, making it the weakest of the four major indexes on Friday.
However, its underperformance should not necessarily be interpreted as a bearish signal. The Dow’s composition is different from that of the Nasdaq and Russell 2000, and its slower pace of appreciation can simply reflect the current preference for growth-oriented and higher-beta equities.
For traders, the widening performance gap between the Dow and Nasdaq is worth monitoring. If technology and growth stocks continue to lead while the Dow lags, market leadership is likely to remain concentrated in higher-growth segments.
Trading Strategy and Market Outlook
Friday’s rebound improved the technical picture across all four major U.S. indexes.
The most important development for traders is the simultaneous strength of the Nasdaq and Russell 2000. The Nasdaq provides leadership from technology and growth stocks, while the Russell 2000 provides evidence that small-cap stocks are participating in the advance.
The immediate strategy should therefore be to monitor relative strength and follow-through, rather than simply assuming that Friday’s gains guarantee another advance.
For momentum traders, Nasdaq-listed growth and technology stocks remain an area of interest, particularly where individual stocks are trading above their key moving averages and showing strong volume.
Small-cap traders should similarly watch the Russell 2000 for confirmation. Continued strength in the index could signal improving risk appetite and create a more favourable environment for selected small-cap momentum setups.
For investors, the fact that all four major indexes remain above their 25-day, 50-day, and 200-day moving averages is encouraging. The broader trend remains constructive unless these technical structures begin to break down.
Key Takeaways for Traders and Investors
1. Nasdaq has regained momentum.
Its 1.30% gain made it Friday’s strongest major index and reinforces its emerging return to relative leadership.
2. Small-caps are participating.
The Russell 2000’s 1.10% gain is significant because broader small-cap participation can strengthen the market’s overall risk-on signal.
3. The major trend remains bullish.
All four major indexes remain above their 25-day, 50-day, and 200-day moving averages, keeping the broader technical structure favourable.
4. Watch relative strength.
The S&P 500 had recently been the strongest major benchmark, but the Nasdaq is showing signs of reclaiming leadership. Traders should monitor this rotation rather than assume that yesterday’s leader will remain tomorrow’s leader.
5. Look for confirmation, not prediction.
The next few sessions should determine whether Friday represented merely a one-day rebound or the beginning of another sustained advance. Continued gains accompanied by strong volume and broad participation would provide confirmation.
Bottom Line
Friday’s U.S. market session was a constructive reversal of Thursday’s weakness. The Nasdaq’s 1.30% advance and the Russell 2000’s 1.10% gain were particularly encouraging, suggesting renewed strength in both growth-oriented and small-cap equities.
The technical picture remains favourable across the major indexes. For now, the evidence supports maintaining a bullish bias while remaining alert to changes in leadership, breadth, volume, and price relative to the major moving averages.
As always, the objective for traders and investors should not be to predict the next market move. It is to recognize where capital is flowing, identify emerging leadership early, participate while the trend remains intact, and reduce risk when the evidence begins to show that momentum is fading.
.
Friday’s U.S. Market Statistics: Strong Breadth Supports the Rebound
Friday’s U.S. market session produced broadly positive internal statistics, with advancing stocks substantially outnumbering declining stocks on both the New York Stock Exchange and Nasdaq. The breadth data provide additional confirmation that Friday’s rebound was supported by relatively broad participation rather than being driven solely by a small group of large-cap stocks.
At the same time, trading volume declined on both exchanges. While the lower volume does not undermine Friday’s positive session by itself, traders should monitor whether volume expands as the major indexes attempt to extend their gains.
NYSE: Strong Breadth, Softer Volume
At the New York Stock Exchange, 1,807 issues advanced compared with 950 decliners, while 72 issues finished unchanged. This produced an advancer-to-decliner ratio of approximately 1.90:1, meaning that nearly two NYSE stocks advanced for every stock that declined.
The breadth reading is clearly constructive and confirms that buying interest was widespread across NYSE-listed stocks.
The NYSE recorded 84 new 52-week highs and 45 new 52-week lows, compared with 248 new highs and 133 new lows on Thursday. Although both the number of new highs and new lows declined substantially from the previous session, the relationship between the two remained broadly unchanged. The new-high-to-new-low ratio was approximately 1.87:1 on Friday, compared with roughly 1.86:1 on Thursday.
This is an important distinction. The absolute number of new highs declined, but so did the number of new lows. Consequently, the relative balance between the two remained favourable.
NYSE trading volume reached approximately 5.18 billion shares, down about 6% from the 5.48 billion shares traded on Thursday.
The decline in volume is worth monitoring, but it should not be overinterpreted. NYSE volume can routinely fluctuate by several percentage points from one session to another, and a 6% decline on its own does not represent a significant deterioration in market participation.
From a trading perspective, the more important signal was the combination of positive breadth and a strong index performance. The NYSE therefore finished Friday with a constructive internal profile, although traders would prefer to see volume expand if the market continues to advance.
Nasdaq: Stronger Internal Momentum
The Nasdaq delivered an even stronger breadth reading.
There were 3,319 advancing stocks versus 1,598 declining stocks, with 156 issues unchanged. The resulting advancer-to-decliner ratio was approximately 2.07:1, meaning that more than two Nasdaq stocks advanced for every decliner.
This is a strong breadth reading and provides meaningful confirmation of the Nasdaq Composite’s 1.30% gain on Friday.
The new-high/new-low statistics were particularly encouraging. Nasdaq-listed stocks produced 267 new 52-week highs and 113 new 52-week lows, compared with 177 new highs and 119 new lows on Thursday.
This means that the number of new highs increased by approximately 51%, while the number of new lows declined by approximately 5%.
Consequently, the new-high-to-new-low ratio improved sharply, from approximately 1.49:1 on Thursday to 2.36:1 on Friday.
This is one of the more significant internal-market developments of the session. More stocks were reaching new 52-week highs while fewer were making new lows. Such an expansion in positive participation is generally consistent with improving underlying momentum.
The Nasdaq’s breadth therefore supports the technical observation that the index is regaining strength after its weaker performance several weeks ago.
Nasdaq Volume Requires Monitoring
Despite the strong breadth, Nasdaq trading volume declined to approximately 8.36 billion shares, down about 10% from the 9.31 billion shares traded on Thursday.
This marks the second consecutive session of declining Nasdaq volume.
For traders, this is not necessarily a bearish signal, particularly because the Nasdaq advanced strongly and breadth improved. However, the volume trend should be watched closely.
Ideally, continued price gains should eventually be accompanied by expanding participation and volume. If the Nasdaq continues to rise while volume steadily contracts, the market could become increasingly vulnerable to a short-term pause or consolidation.
The current situation is therefore best described as bullish price action with a volume trend that warrants monitoring, rather than as a negative divergence.
Market Internals Favour the Bulls
Taken together, Friday’s statistics present a favourable picture of U.S. market internals.
The NYSE recorded a 1.90:1 advancer-decliner ratio, while Nasdaq posted an even stronger 2.07:1 ratio. Nasdaq also experienced a significant improvement in its new-high/new-low relationship, with new highs rising sharply while new lows declined.
These statistics are particularly relevant because the Nasdaq Composite has now advanced in five of the last six sessions. The combination of improving breadth, expanding new highs, contracting new lows, and sustained index strength suggests that the Nasdaq’s recent recovery has meaningful internal support.
For traders, this is an important change from the weaker market conditions seen several weeks ago.
Trading Strategy
Friday’s market internals favour maintaining a constructive-to-bullish bias, but traders should continue to distinguish between confirmation and prediction.
For Nasdaq traders, the strongest signal is the combination of index strength, a 2.07:1 advancer-decliner ratio, and a substantially improved new-high/new-low ratio. If these conditions persist, the probability of continued momentum increases.
The next confirmation would be continued expansion in new highs and sustained positive breadth. Traders should also look for volume to stabilize or increase as the Nasdaq moves higher.
On the NYSE, the positive breadth is encouraging, but the smaller improvement in new-high/new-low statistics suggests that the internal picture is constructive rather than exceptionally strong.
The key warning signal would be a situation in which the major indexes continue rising while the number of advancing stocks falls, new lows begin expanding, and trading volume continues to contract. Such a divergence would suggest that the rally is becoming increasingly narrow and could warrant a more defensive trading stance.
Key Takeaways for Traders and Investors
1. Market breadth was clearly bullish.
Both exchanges recorded approximately two advancers for every decliner, providing strong confirmation of Friday’s rebound.
2. Nasdaq internals improved significantly.
New Nasdaq 52-week highs increased approximately 51%, while new lows declined approximately 5%. The resulting 2.36:1 new-high/new-low ratio is an important positive signal.
3. Nasdaq’s recovery is gaining credibility.
With the Nasdaq now higher in five of the last six sessions, the improving internal statistics suggest that the recovery is broader than simply an index-level rebound.
4. Volume is the principal item to monitor.
NYSE volume declined approximately 6%, while Nasdaq volume fell approximately 10%. Neither decline is automatically bearish, but traders should watch for volume expansion if the indexes continue higher.
5. The market remains favourable for momentum traders.
Strong breadth and improving Nasdaq internals provide a supportive environment for stocks demonstrating relative strength, strong technical structures, and positive catalysts.
6. Follow the internals, not the headlines alone.
The most useful confirmation of a sustainable advance will come from continued strength in advancing issues, new highs, and trading participation. Deterioration in these measures would provide an early warning that momentum is beginning to fade.
Bottom Line
Friday’s U.S. market statistics reinforce the positive message from the major indexes. Breadth was strong on both exchanges, Nasdaq’s new-high/new-low ratio improved substantially, and new lows declined while new highs expanded.
The principal caveat is the decline in trading volume, particularly on Nasdaq, where volume has now fallen for two consecutive sessions.
For now, however, the weight of the evidence remains bullish. The Nasdaq’s improving internal strength is especially encouraging and suggests that its recent recovery has broadened beyond a simple technical bounce. Traders should continue to favour stocks and sectors demonstrating relative strength while watching breadth and volume closely for signs that the current momentum is either strengthening or beginning to fade.
.
NOTICE TO READERS
The Canadian Vanguard Stock Market is about empowering you to build and manage your wealth by yourself. There is certainly no magic in managing finances or wealth but one needs to know what to do and commit to doing what is needed. When you are ready to start the journey to Take Charge and Put Your Destiny In Your Own Hands, start with reading The Canadian Vanguard every market day. If and when you need more related information or to advertise your business products or services in The Canadian Vanguard, Contact Us
Our readers are strongly advised to conduct their own research into individual stocks before making a purchase decision. In addition, investors are advised that past stock performance is no guarantee of future price appreciation. Any recommendation is not a guarantee of any particular stock’s future prices, and The Canadian Vanguard accepts no responsibility or liability for investors’ or readers’ purchases.
Stocks In The News/ Stocks To Watch and Market Strategy will soon be available only to Paying Subscribers. The dollar sign “$” in the Toronto Market section in the articles only stands for Canadian dollar and in the US market section “$” stands for US dollar.
(c) This article is published by The Canadian Vanguard on August 8, 2026