
Indexes Slip as Small-Caps Lead, Software Stocks Weigh on Nasdaq
The Canadian Vanguard Stock Market Report Tuesday August 11, 2026 Edition
.
The Toronto Market
Tuesday’s Toronto Market Index
Tuesday’s Toronto Market Index
The Toronto S&P/TSX Composite Index rose 17.59 points, or 0.05%, to close at 36,475.92.
The Toronto market had a relatively positive session on Tuesday. The TSX Index has remained in an uptrend since early July, despite brief periods of consolidation in early and late July. The index has gained more than 1,000 points this month.

The index reached a new high during today’s session but was unable to sustain its upward momentum. It closed only slightly above the session low and well below the session high. Nevertheless, the TSX has now closed higher for three consecutive sessions.
Today’s gain was modest at just 0.05%. More importantly, the index continues to trade well above its 25-day, 50-day, and 200-day moving averages, maintaining its overall bullish technical trend.
Tuesday’s TSX Market Statistics
At the TSX, advancing issues edged out declining issues. Specifically, there were 1,059 advancers and 1,026 decliners, producing an advancer-to-decliner ratio of 1.03 to 1—approximately one advancer for every decliner. A total of 185 issues were unchanged.
The exchange recorded 125 new 52-week highs and 31 new 52-week lows, compared with 144 new 52-week highs and 50 new 52-week lows yesterday. Although the number of new highs declined from yesterday, the number of new lows also fell. More importantly, the ratio of new 52-week highs to new 52-week lows improved to approximately 4.03 to 1, about 40% higher than yesterday’s ratio of 2.88 to 1.
Overall, market breadth remained positive, while the new-high/new-low data continued to point to considerable underlying strength. The market internals remain bullish, supporting the view that the TSX continues to have strong internal momentum.
Total trading volume on the TSX reached 428,829,841 shares, approximately 10.7% lower than the 480,119,288 shares traded yesterday. The decline in volume suggests somewhat lighter participation, but it does not materially weaken the otherwise positive market internals.
.
Tuesday’s Toronto TSX Market Wrap-Up Report
The S&P/TSX Composite Index rose 17.59 points, or 0.05%, to close at 36,475.92 on Tuesday. The index reached a new intraday high but could not sustain its upward momentum and finished only slightly above the session low and well below the session high.
Despite the modest gain, the broader trend remains constructive. The TSX has advanced more than 1,000 points this month and has now closed higher for three consecutive sessions. The index also remains comfortably above its 25-day, 50-day, and 200-day moving averages, confirming that the primary technical trend remains bullish.
However, after such a strong advance, the market may be approaching a period of consolidation. The TSX cannot continue advancing at its recent pace indefinitely, and a period of sideways trading or a pullback could be healthy if it allows the market to establish a new base before attempting another advance. Traders should therefore distinguish between normal consolidation within an uptrend and an actual deterioration in the underlying trend.
Market Internals Remain Strong
The market breadth was positive on Tuesday, although the margin was relatively narrow. There were 1,059 advancing issues compared with 1,026 declining issues, producing an advancer-to-decliner ratio of 1.03 to 1. Another 185 issues were unchanged.
The new-high/new-low data was more encouraging. The TSX recorded 125 new 52-week highs and only 31 new 52-week lows. While both figures were lower than yesterday’s 144 new highs and 50 new lows, the ratio of new highs to new lows improved to approximately 4.03 to 1, about 40% better than yesterday’s 2.88 to 1 ratio.
This is an important indication of underlying market strength. Even though the TSX’s headline gain was only 0.05%, the market continued to produce substantially more new highs than new lows. The internals therefore remain bullish and suggest that the current uptrend has not yet suffered a significant deterioration.
Trading volume was 428.8 million shares, approximately 10.7% below yesterday’s 480.1 million shares. The lighter volume is worth monitoring, particularly if the index begins to consolidate, but it does not by itself signal a bearish reversal.
Sector Performance
Only three of the ten major TSX sectors finished higher on Tuesday.
Energy was the clear leader, gaining 2.27%. Technology advanced 1.94%, while Basic Materials edged higher by 0.19%.
On the downside, Financials declined 0.14%. Telecommunications Services, down 0.97%, and Utilities, down 1.62%, were the weakest-performing sectors.
The strong performance in Energy and Technology helped offset weakness in several defensive and financial sectors. Given the importance of Financials to the Canadian market, continued weakness in this sector should be monitored closely in the coming sessions.
Financial Stocks
Manulife Financial was among the weaker performers within the TSX Financials sector. The stock declined 0.81% to close at $61.04, with approximately 8 million shares changing hands. Trading volume was considerably higher than its 50-day average, making the decline more noteworthy.
Manulife therefore underperformed the broader market and should remain on traders’ watchlists, particularly if elevated volume accompanies additional weakness.
Among the six major Canadian banks, Bank of Nova Scotia was the strongest performer, gaining 0.21%, followed by Toronto-Dominion Bank, which rose 0.16%. The other major banks finished the session lower.
Shopify
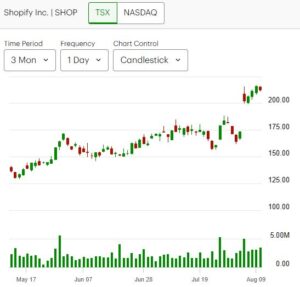
Shopify Inc. declined 1.76% to close at $212.30, with approximately 3.4 million shares traded.
Despite Tuesday’s decline, Shopify has advanced in five of the last six sessions. The stock’s pullback therefore appears in the context of a recent strong run, although it underperformed the broader TSX on Tuesday. Traders should watch whether the stock can resume its upward momentum or begins to enter a short-term consolidation phase.
Key Takeaways for Traders and Investors
1. The primary TSX trend remains bullish.
The index is trading well above its 25-day, 50-day, and 200-day moving averages, and the advance of more than 1,000 points this month demonstrates considerable momentum.
2. Consolidation would not necessarily be bearish.
After such a strong advance, a period of sideways movement or a controlled pullback could be constructive if the TSX establishes a higher base and subsequently breaks out to new highs.
3. Market internals remain encouraging.
The nearly balanced advancer-decliner ratio was not particularly strong, but the 4-to-1 new-high-to-new-low ratio remains a significant positive signal.
4. Sector leadership deserves attention.
Energy and Technology provided the strongest leadership Tuesday, while Financials were slightly weaker. Because Financials have such a large influence on the Canadian market, traders should watch whether this weakness persists.
5. Volume should be monitored during any consolidation.
Tuesday’s lower trading volume does not provide a bearish signal by itself. A healthy consolidation accompanied by declining volume could be constructive; a sharp decline accompanied by expanding volume would be more concerning.
6. Geopolitical developments remain a potential source of volatility.
The TSX experienced considerable volatility during July, much of it associated with geopolitical tensions in the Middle East. Traders and investors should continue to monitor developments in the region while using the technical picture to assess how the market is responding.
Bottom Line
Tuesday’s 0.05% gain was modest, but the headline performance does not tell the entire story. The TSX remains in a well-established uptrend, continues to trade above its major moving averages, and is showing strong new-high/new-low internals. The most important issue now is whether the index can consolidate its recent gains without materially damaging its technical structure.
For traders, the next few sessions will be important. A controlled consolidation that holds above key support levels could provide the foundation for another move higher. Conversely, a sharp deterioration in breadth, expanding downside volume, and a sustained break below key moving averages would provide an early warning that the character of the market is changing.
.
The US Markets
.
Tuesday’s U.S. Market Indexes
The major U.S. market indexes finished lower on Tuesday, with the Russell 2000 the notable exception. The Dow Jones Industrial Average fell 184.13 points, or 0.34%, to close at 53,791.85. The S&P 500 declined 24.91 points, or 0.32%, finishing at 7,728.20. The Nasdaq Composite slipped 159.91 points, or 0.60%, to close at 26,445.45. In contrast, the Russell 2000 gained 9.72 points, or 0.32%, ending the session at 3,027.12.

The session was characterized by a clear divergence between large-cap and small-cap stocks. While all three major large-cap indexes finished lower, the Russell 2000 advanced, indicating that small-cap stocks continued to show relative strength. This is an encouraging development for market breadth and risk appetite, although one session is not enough to establish a sustained rotation into smaller companies.
The Nasdaq was the weakest of the four major indexes on Tuesday, declining 0.60%. Nevertheless, its recent performance remains strong, and the index continues to trade well above its 25-day, 50-day, and 200-day moving averages. The recent strength has brought the Nasdaq back into a position where it is increasingly challenging the previous leadership of the S&P 500.
The Nasdaq may now be entering a short-term consolidation period. After a strong advance, some sideways movement would not necessarily be negative. A period of consolidation could allow the index to build a stronger base before making another attempt at higher levels. Traders should watch whether the Nasdaq can hold above its short-term moving averages and maintain its recent relative strength.
The S&P 500 also remains technically strong, despite Tuesday’s decline. The index continues to trade clearly above its 25-day, 50-day, and 200-day moving averages. The S&P 500 had been the strongest performer among the major indexes until recently, but the Nasdaq appears to be regaining some of its previous leadership.
The Russell 2000 continues to improve technically. The index moved back above its 25-day moving average approximately six trading sessions ago and has since shown more consistent short-term strength. More importantly, both the Russell 2000 and the S&P 500 remain above their 25-day, 50-day, and 200-day moving averages, keeping their primary technical trends constructive.
Key Takeaway for Traders and Investors
Tuesday’s market action was not broadly positive—the Dow, S&P 500, and Nasdaq all declined—but the relative strength of the Russell 2000 is noteworthy. The combination of continued strength in small-cap stocks and the Nasdaq’s strong recent performance suggests that market leadership may be broadening or shifting.
For traders, the immediate focus should be on whether the Nasdaq can consolidate its recent gains without breaking below important short-term support and whether the Russell 2000 can maintain its move above the 25-day moving average. For investors, the more important message is that the major indexes remain above their key moving averages, so the broader technical structure continues to favor the bulls.
At the same time, after a strong advance, a period of consolidation would be normal. Traders should avoid interpreting every one-day decline as a trend reversal. A more significant warning would come from a sustained deterioration in the major indexes, accompanied by breaks below their key moving averages and weakening market breadth.
Bottom line: Tuesday’s decline in the large-cap indexes was relatively modest, while the Russell 2000’s gain provided an encouraging sign of small-cap strength. The market remains technically constructive, but the next several sessions will be important in determining whether the recent strength develops into another leg higher or gives way to a broader consolidation.
.
Tuesday’s U.S. Market Statistics
New York Stock Exchange (NYSE): Market breadth at the New York Stock Exchange remained positive on Tuesday. Advancing issues outnumbered declining issues, with 2,379 advancers, 1,998 decliners, and 526 issues unchanged. This produced an advancer-to-decliner ratio of 1.19 to 1, or approximately six advancing stocks for every five declining stocks.
The NYSE recorded 322 new 52-week highs and 143 new 52-week lows, compared with 297 new highs and 149 new lows yesterday. The increase in new highs combined with a decline in new lows is an encouraging development and points to continued underlying market strength.
The new-high-to-new-low ratio was approximately 2.25 to 1 today, compared with about 1.99 to 1 yesterday. In other words, the ratio improved by roughly 13% from the previous session. This is a modest but meaningful improvement in market breadth.
Total NYSE trading volume reached 4.856 billion shares, down approximately 4% from the 5.034 billion shares traded yesterday. The decline in volume was relatively small and remains within the normal day-to-day fluctuations commonly seen at the NYSE. Volume therefore does not provide a significant warning signal.
Overall, the NYSE internals remain bullish and strong. The combination of positive breadth, more new highs, fewer new lows, and relatively stable trading volume suggests that the market continues to have substantial internal support.
NASDAQ: Market breadth was also positive at the NASDAQ. There were 2,705 advancers compared with 2,131 decliners, producing an advancer-to-decliner ratio of 1.27 to 1—approximately six advancing stocks for every five declining stocks. Another 440 issues were unchanged.
The number of unchanged issues increased slightly from yesterday but remained close to its 50-day average, suggesting that there was no unusual concentration of stocks sitting unchanged.
The NASDAQ recorded 214 new 52-week highs and 105 new 52-week lows, compared with 231 new highs and 110 new lows yesterday. Both new highs and new lows declined slightly, but the relationship between the two remained broadly stable.
The new-high-to-new-low ratio was approximately 2.04 to 1, compared with about 2.10 to 1 yesterday. The small change indicates that the market’s internal momentum has remained relatively stable rather than deteriorating materially.
NASDAQ trading volume totaled 8.013 billion shares, essentially unchanged from yesterday’s 7.974 billion shares. The stability in volume is another constructive feature of Tuesday’s session.
Key Takeaway for Traders and Investors
Tuesday’s market statistics provide a more positive picture than the headline declines in the major U.S. indexes might suggest.
Both the NYSE and NASDAQ had positive market breadth, with advancers comfortably outnumbering decliners. The NYSE showed particularly encouraging new-high/new-low data, while the NASDAQ’s new-high/new-low ratio remained stable. Trading volume was also generally steady, with the NYSE declining modestly and NASDAQ volume remaining virtually unchanged.
This combination is important because it indicates that Tuesday’s weakness in the Dow, S&P 500, and Nasdaq Composite was not accompanied by a broad deterioration in market internals. The market continues to show signs of underlying strength even when the major indexes experience modest pullbacks.
For traders, the key issue is whether this pattern continues. If the major indexes consolidate while breadth remains positive and new highs continue to substantially outnumber new lows, the consolidation could prove constructive and potentially establish a base for another advance.
For investors, the current internals remain reassuring. There is no clear indication from Tuesday’s statistics of a broad-based distribution or weakening market participation. Instead, the data suggest that the bullish trend remains intact, although continued monitoring of new highs, new lows, breadth, and volume is warranted.
Bottom line: The major U.S. indexes closed lower Tuesday, but the underlying market statistics remained bullish and relatively stable. The positive breadth at both exchanges, improving NYSE new-high/new-low statistics, and stable NASDAQ volume suggest that the market’s internal strength remains considerably better than the headline index performance alone would imply.
.
Tuesday’s U.S. Market Wrap-Up Report
The U.S. stock market finished Tuesday with modest losses in the major large-cap indexes, but the underlying market internals remained considerably stronger than the headline numbers suggested. The Dow Jones Industrial Average declined 0.34%, the S&P 500 fell 0.32%, and the Nasdaq Composite slipped 0.60%. The Russell 2000 was the exception, gaining 0.32% and continuing to demonstrate improving short-term strength among small-cap stocks.
The divergence between the major indexes and the Russell 2000 is worth watching. Large-cap stocks were under pressure, while small-caps continued to outperform. This suggests that Tuesday’s weakness was not necessarily a broad-based deterioration in investor risk appetite.
Market Internals Remain Bullish
The market statistics provided additional evidence that the underlying market remained healthy.
At the NYSE, 2,379 stocks advanced compared with 1,998 decliners, producing an advancer-to-decliner ratio of 1.19 to 1. The exchange also recorded 322 new 52-week highs versus only 143 new lows. Both the improvement in new highs and the decline in new lows were encouraging.
NASDAQ breadth was even stronger, with 2,705 advancers and 2,131 decliners, producing an advancer-to-decliner ratio of 1.27 to 1. The exchange recorded 214 new 52-week highs and 105 new lows. Although both figures were slightly lower than yesterday, the relationship between new highs and new lows remained broadly stable.
Trading volume also remained relatively steady. NYSE volume declined approximately 4%, while NASDAQ volume was essentially unchanged from the previous session. There was therefore no obvious volume-based warning signal accompanying Tuesday’s decline.
Taken together, these statistics suggest that the decline in the major indexes was relatively orderly. The positive breadth and continued dominance of new highs over new lows indicate that the market’s internal trend remains bullish.
Sector Performance
Only four of the major U.S. sectors finished higher Tuesday.
Utilities, up 1.27%, led the sectors, followed by Energy, which gained 0.65%. Telecommunications Services advanced 0.45%, while Financials edged higher by 0.19%.
On the downside, Healthcare declined 0.56%, while Consumer Durables & Services, down 0.62%, was the weakest-performing sector.
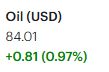
The strength in Energy was particularly notable given the increase in oil prices. Oil prices moved higher amid continuing uncertainty surrounding geopolitical developments in the Middle East. Energy stocks therefore provided some support to the broader market.
Nvidia and AI Infrastructure: In company news, the Financial Times reported that Nvidia announced partnerships involving six major asset-management and financial-industry companies—Apollo Global Management, BlackRock, Blackstone, Brookfield Asset Management, Goldman Sachs, and KKR—to help provide financing for data-center construction.
The initiative is aimed at providing substantial capital over time to Nvidia customers for the construction of data centers and AI infrastructure that will use Nvidia chips and related technology.
For investors, the development is significant because it highlights an increasingly important issue surrounding the AI investment cycle: financing the enormous amount of infrastructure required to support continued AI growth. The ability to secure large-scale financing could help sustain data-center construction and, in turn, demand for semiconductors, networking equipment, power infrastructure, and other components of the AI ecosystem.
At the same time, investors should distinguish between long-term AI infrastructure demand and short-term stock performance. Strong industry fundamentals do not necessarily prevent individual stocks from experiencing substantial corrections.
Semiconductor and Storage Stocks: Semiconductor stocks have experienced pressure recently, although some memory-chip and disk-drive-related stocks showed signs of recovery Tuesday.
SanDisk (SNDK) gained 2.68% and closed at $1,271.05, with approximately 9.4 million shares traded. Despite Tuesday’s gain, the stock remains well below both its 25-day and 50-day moving averages. Given the significant sell-offs experienced by disk-drive manufacturers during July, the technical condition of these stocks remains relatively weak.
Western Digital declined 0.09% on approximately 6.1 million shares.
Micron Technology (MU) gained 0.87% and closed at $868.52, with approximately 29.4 million shares traded.
Tower Semiconductor (TSEM) fell 1.17% to close at $249.58, with approximately 1.17 million shares traded.
The mixed performance across semiconductor and storage stocks suggests that the sector is still searching for stability after its recent volatility. Traders should be particularly careful with stocks that remain below their key moving averages, even when they experience one-day rebounds.
.
Key Takeaways for Traders and Investors
1. Tuesday’s index declines were not confirmed by weak market internals.
Both the NYSE and NASDAQ had more advancing stocks than declining stocks, while new 52-week highs continued to substantially outnumber new lows.
2. Small-cap strength is becoming increasingly important.
The Russell 2000 gained 0.32% while the three major large-cap indexes declined. The Russell has remained above its 25-day moving average for approximately six sessions, suggesting improving short-term momentum.
3. The Nasdaq may be entering consolidation rather than reversing its trend.
The Nasdaq declined 0.60% Tuesday but remains well above its 25-day, 50-day, and 200-day moving averages. A period of consolidation could be constructive if the index holds its important support levels.
4. The broader technical picture remains bullish.
The S&P 500 and Russell 2000 remain above their 25-day, 50-day, and 200-day moving averages. The Nasdaq is also comfortably above these benchmarks.
5. Sector leadership is changing.
Energy and Utilities provided leadership Tuesday, while several growth-oriented areas experienced weakness. Traders should watch whether this represents only short-term rotation or the beginning of a more persistent shift in leadership.
6. AI infrastructure remains a major investment theme.
Nvidia’s reported financing initiative underscores the enormous capital requirements associated with the AI buildout. This could have implications well beyond Nvidia, potentially benefiting companies involved in semiconductors, data centers, power generation, networking, and related infrastructure.
7. Technical discipline remains important in semiconductor stocks.
Several semiconductor and storage stocks have experienced significant volatility. A one-day recovery should not automatically be interpreted as a trend reversal, particularly when a stock remains below important moving averages.
Bottom Line: Tuesday’s U.S. market session was weaker on the surface but considerably healthier underneath. The major large-cap indexes declined, yet market breadth at both the NYSE and NASDAQ remained positive, new highs continued to outnumber new lows by a substantial margin, and trading volume remained stable.
The Russell 2000’s continued strength is another encouraging development and may indicate that market participation is broadening beyond the largest technology and growth stocks. Meanwhile, the Nasdaq’s recent strength remains intact despite Tuesday’s decline.
For now, the evidence points more toward rotation and possible consolidation than a broad market breakdown. Traders should focus on whether the major indexes hold their key moving averages and whether positive breadth and strong new-high/new-low readings persist. A continuation of those conditions would keep the larger bullish trend intact.
.
NOTICE TO READERS
The Canadian Vanguard Stock Market is about empowering you to build and manage your wealth by yourself. There is certainly no magic in managing finances or wealth but one needs to know what to do and commit to doing what is needed. When you are ready to start the journey to Take Charge and Put Your Destiny In Your Own Hands, start with reading The Canadian Vanguard every market day. If and when you need more related information or to advertise your business products or services in The Canadian Vanguard, Contact Us
Our readers are strongly advised to conduct their own research into individual stocks before making a purchase decision. In addition, investors are advised that past stock performance is no guarantee of future price appreciation. Any recommendation is not a guarantee of any particular stock’s future prices, and The Canadian Vanguard accepts no responsibility or liability for investors’ or readers’ purchases.
Stocks In The News/ Stocks To Watch and Market Strategy will soon be available only to Paying Subscribers. The dollar sign “$” in the Toronto Market section in the articles only stands for Canadian dollar and in the US market section “$” stands for US dollar.
(c) This article is published by The Canadian Vanguard on August 11, 2026