
Markets Rebound on Hopes of Easing U.S.-Middle East Tensions
The Canadian Vanguard Stock Market Report Thursday, September 24, 2026, Edition
.
The Toronto Market
Thursday’s Toronto Market Index
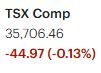
The S&P/TSX Composite Index fell 44.97 points, or 0.13%, to close at 35,706.46.
The TSX opened slightly below the previous close and then fell sharply during the morning session. However, buyers stepped in around midday, helping the index recover significantly. The TSX finished more than 200 points above the session’s low, making for an impressive recovery despite the overall weakness of the trading session.

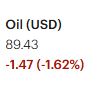
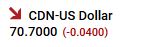
Overall, it was a generally poor trading day for the Toronto market, although the strong recovery from the intraday low was encouraging.
The TSX is now trading slightly below both its 25-day and 50-day moving averages, while still maintaining a comfortable gap above its 200-day moving average.
Thursday’s TSX Market Statistics
At the TSX, declining issues (decliners) significantly outnumbered advancing issues (advancers). There were 1,370 decliners compared with 830 advancers, producing a decliner-to-advancer ratio of 1.65 to 1—approximately three decliners for every two advancers. A total of 138 issues remained unchanged.
The exchange recorded 37 new 52-week highs and 178 new 52-week lows, compared with 38 new 52-week highs and 155 new 52-week lows yesterday. Market breadth remained negative, although it improved somewhat today. The ratio of new 52-week highs to new 52-week lows deteriorated to approximately 1:5, compared with 1:4 yesterday.
New 52-week lows continue to substantially outnumber new 52-week highs. The number of new 52-week highs was practically unchanged from yesterday, while the number of new 52-week lows increased by approximately 14%. Overall, the TSX’s internal indicators remain weaker than they were earlier in the week.
Total trading volume on the TSX reached 440,452,829 shares, essentially unchanged from the 438,973,759 shares traded yesterday.
Although the TSX’s decline today was roughly one-tenth as large as yesterday’s decline, trading volume remained virtually unchanged. This combination suggests that today’s decline was not accompanied by a significant increase in selling momentum.
Thursday’s Toronto TSX Market Wrap-Up Report
A Sharp Recovery from the Low—but the Internals Remain Weak: The TSX absorbed another bout of selling pressure Thursday and finished modestly lower, but the session was considerably more constructive than Wednesday’s severe sell-off.
The Toronto S&P/TSX Composite Index staged a meaningful intraday recovery on Thursday, although it still finished modestly lower at 35,706.46, down 44.97 points, or 0.13%. The index opened slightly below Wednesday’s close and initially sold off sharply before buyers stepped in around midday. The TSX ultimately closed more than 200 points above its session low, limiting what could have been a much deeper decline.
The recovery was encouraging, but the overall market internals remained weak. Declining issues substantially outnumbered advancing issues, with 1,370 decliners versus 830 advancers, producing a 1.65-to-1 decliner-to-advancer ratio. There were also 178 new 52-week lows compared with only 37 new 52-week highs. The number of new lows increased approximately 14% from Wednesday, while new highs were essentially unchanged.
Trading volume was 440.5 million shares, virtually unchanged from Wednesday’s 439.0 million shares. The relatively stable volume, combined with today’s much smaller index decline, suggests that Thursday’s weakness was not accompanied by a significant increase in selling pressure. However, the continued dominance of new 52-week lows indicates that the market’s internal condition remains fragile.
Sector Performance
Only four of the TSX’s ten major sectors finished Thursday with gains.
Technology was the standout sector, rising 1.78% and providing meaningful support to the broader index. Energy followed with a 0.40% gain, making it the second-best-performing sector for the second consecutive session. Industrials also finished higher, gaining 0.32%.
Financials, the TSX’s largest sector by market weight, was essentially unchanged, slipping only 0.03%. This was a significant improvement from Wednesday’s 1.76% decline and helped stabilize the broader market.
On the weaker side, Basic Materials fell 1.22%. Telecommunications Services, which had been one of Wednesday’s strongest sectors, declined 1.60% on Thursday and was the session’s weakest major sector.
The sector rotation therefore remained mixed: technology and energy provided support, while weakness in materials and telecommunications continued to weigh on market breadth.
Technology and BlackBerry in Focus
Technology was the strongest major sector Thursday, and BlackBerry was one of the notable individual performers. BlackBerry shares gained 3.63% following its earnings report.
BlackBerry has completed its transition away from the hardware business and is now focused on software, including its QNX operating system, which is used in automotive and other embedded systems. The company’s results and management commentary will therefore be watched closely by investors looking for evidence that momentum in its software-focused business is continuing to improve.
Canadian Banks Recover
The Canadian banks showed a noticeable improvement from Wednesday’s broad-based weakness.
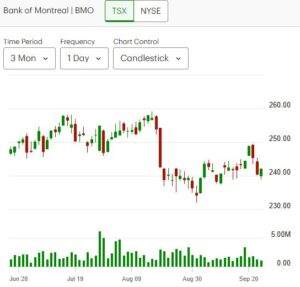
Five of the six major Canadian banks finished Thursday higher, with National Bank of Canada the only one of the group to close lower. Bank of Montreal was the strongest performer among the major banks, gaining 0.70% to close at C$242.07 on approximately 1.0 million shares traded.
Royal Bank of Canada also edged higher, gaining 0.27% to C$282.11 on approximately 2.4 million shares.
The improvement in bank stocks was important because financials represent a major component of the TSX. However, with the sector essentially flat overall, the banking rebound was more a stabilization signal than a broad-based market-driving move.
Technical and Market-Internal Picture
Thursday’s price action produced a mixed message.
On the positive side, the TSX demonstrated that buyers were willing to step in after a sharp intraday decline. Closing more than 200 points above the session low shows that the market was able to recover a substantial portion of its early losses.
However, the broader internal indicators remain weak. The TSX is now slightly below both its 25-day and 50-day moving averages, although it remains comfortably above its 200-day moving average. The continued excess of new 52-week lows over new highs is another indication that weakness is spreading beneath the surface of the index.
In other words, the index itself has held up considerably better than the overall number of individual stocks would suggest.
Key Takeaways for Traders and Investors
- The midday recovery was significant: Buyers emerged after the morning sell-off and pushed the TSX more than 200 points above its intraday low.
- Market breadth remains a concern: Decliners outnumbered advancers 1.65 to 1, while new 52-week lows outnumbered new highs by nearly 5 to 1.
- Selling pressure did not accelerate: Trading volume was essentially unchanged from Wednesday despite the market’s decline, suggesting no major increase in selling momentum.
- Technology provided leadership: The sector gained 1.78% and was Thursday’s strongest major sector.
- Financials stabilized: The sector was virtually unchanged after a much larger decline on Wednesday, while five of the six major banks finished higher.
- Energy continued to show relative strength: The sector gained 0.40% and was again among the better-performing groups.
- The technical picture remains mixed: The TSX is below its 25-day and 50-day moving averages but remains well above its 200-day moving average.
- The key issue remains market breadth: While the index showed resilience, the large number of new 52-week lows indicates that weakness remains widespread among individual stocks.
Bottom line: Thursday’s session was a much better performance than Wednesday’s severe decline from a price-action perspective, primarily because of the strong recovery from the intraday low. However, the underlying market statistics remain cautious: breadth was negative, new lows continued to dominate new highs, and the index remains below its shorter-term moving averages. For traders and investors, the recovery is therefore worth watching, but confirmation from improving market breadth and stronger participation across sectors would provide a clearer indication that the market’s internal condition is beginning to improve.
.
The US Markets
Thursday’s U.S. Market Indexes
U.S. equities finished Thursday with a mixed session, as the major indexes remained close to unchanged but showed meaningful differences in relative strength.
The Dow Jones Industrial Average fell 161.61 points, or 0.31%, to close at 51,349.98. The S&P 500 slipped just 1.90 points, or 0.02%, to 7,704.13. The Nasdaq Composite gained 3.34 points, or 0.01%, to finish at 26,939.27, narrowly avoiding a lower close. The Russell 2000 declined 3.09 points, or 0.11%, to 2,835.57.

The session was essentially flat for the major indexes, but the performance gap between them was notable. The Dow was again the weakest of the four, while the Nasdaq was the relative leader, although its gain was marginal. Small-cap stocks also showed a substantial improvement from Wednesday’s sharp decline.
Nasdaq and S&P 500 Continue to Hold Their Technical Position: The Nasdaq and S&P 500 remain in a considerably stronger technical position than the Dow and Russell 2000.
Despite Thursday’s essentially flat performance, both the Nasdaq Composite and S&P 500 remain comfortably above their 25-day, 50-day and 200-day moving averages.
This continues to indicate that the broader technology-heavy and large-cap growth segments of the U.S. market are maintaining their longer- and intermediate-term technical structure.
For traders, the important issue is whether these indexes can continue to hold above their shorter-term moving averages if selling pressure increases. So far, Thursday’s action did not materially change their technical picture.
Dow Continues to Lag: The Dow remains the weakest major U.S. index from a technical perspective.
Thursday’s 0.31% decline left the Dow below both its 25-day and 50-day moving averages, although it remains above its 200-day moving average.
This combination is worth monitoring. The index has not yet broken below its longer-term 200-day trend line, but its position below the two shorter-term averages indicates that the intermediate-term technical picture remains under pressure.
The continued underperformance of the Dow relative to the Nasdaq and S&P 500 also points to an uneven market rather than a uniform decline across U.S. equities.
Small Caps Improve After Wednesday’s Sell-Off: The Russell 2000 declined only 0.11% Thursday, a substantial improvement from Wednesday’s sharp decline.
However, the small-cap index remains below both its 25-day and 50-day moving averages, while staying above its 200-day moving average.
That leaves the Russell 2000 in a mixed technical position. Thursday’s stabilization was constructive, but the index has not yet recovered its short-term trend indicators.
For traders watching market participation and risk appetite, small caps remain an important group to monitor. A sustained recovery above the 25-day and 50-day averages would provide a clearer indication that buyers are returning to smaller companies.
Relative Strength Remains the Key Theme: Thursday’s market action reinforces an increasingly important distinction between the major U.S. indexes.
- Nasdaq: Marginal gain and remains above all three major moving averages.
- S&P 500: Essentially unchanged and remains above its 25-day, 50-day and 200-day moving averages.
- Russell 2000: Slight decline but a significant improvement from Wednesday; remains below its 25-day and 50-day averages.
- Dow Jones: Largest decline among the four indexes and remains below its 25-day and 50-day averages.
The result is a market in which the major large-cap technology-oriented indexes continue to show greater technical resilience, while the Dow and small-cap stocks remain less convincing.
Key Takeaway for Traders and Investors
Thursday did not produce a major move in either direction, but the relative performance between the indexes remains informative.
The Nasdaq and S&P 500 continue to maintain their positions above all three major moving averages, while the Dow and Russell 2000 remain below their shorter-term averages. This divergence suggests that market weakness is not evenly distributed across U.S. equities.
For traders, the 25-day and 50-day moving averages remain the key short-term technical reference points, particularly for the Dow and Russell 2000. For the Nasdaq and S&P 500, the ability to remain above those levels would help preserve their current technical structure.
What to Watch Friday
1. Nasdaq and S&P 500
Watch whether the two major indexes can maintain their position above their 25-day and 50-day moving averages. These levels remain important indicators of short-term trend strength.
2. Dow Jones
The Dow’s continued weakness is worth watching closely. A further decline while the Nasdaq and S&P 500 remain relatively stable would widen the performance gap between the major indexes.
3. Russell 2000
Small caps improved dramatically compared with Wednesday. Friday’s trading will help determine whether Thursday represented simple stabilization or the beginning of a more sustained recovery attempt.
4. Market breadth and participation
With the major indexes near record territory, traders should look beyond the headline index moves and monitor whether participation is broadening across sectors and company sizes.
5. Moving-average positioning
The technical divide is clear: Nasdaq and S&P 500 remain above their 25-day, 50-day and 200-day averages, while Dow and Russell 2000 remain below their 25-day and 50-day averages. Any significant change in this configuration would be worth noting.
Bottom line: Thursday was a quiet session on the surface, but the underlying index structure remains uneven. The Nasdaq and S&P 500 continue to demonstrate stronger technical positioning, while the Dow and Russell 2000 remain below their shorter-term moving averages. For Friday, the key question is whether the stronger indexes can maintain their leadership while the lagging Dow and small-cap stocks attempt to stabilize.
Thursday’s U.S. Market Statistics
Market Internals Deteriorate Despite Relatively Quiet Index Performance
Thursday’s headline index performance was largely uneventful, but the underlying market statistics told a considerably weaker story.
Market breadth deteriorated on both the NYSE and NASDAQ, while new 52-week lows continued to overwhelm new highs. The divergence between relatively stable headline indexes and weakening internal indicators remains an important signal for traders and investors to monitor.
NYSE: New Lows Continue to Dominate
At the New York Stock Exchange, 3,127 issues declined versus 1,481 advancers, with 507 issues unchanged. This produced a decliner-to-advancer ratio of approximately 2.11 to 1—roughly two declining stocks for every advancing stock.
The new-high/new-low picture was considerably weaker. The NYSE recorded 92 new 52-week highs and 818 new 52-week lows, compared with 90 new highs and 723 new lows on Wednesday.
While the number of new highs was essentially unchanged, new 52-week lows increased by approximately 13%. New highs represented only about 11% of the number of new lows.
That is a significant imbalance.
The NYSE therefore continues to show a market in which weakness is spreading across a large number of individual stocks even though the major indexes themselves have not experienced a comparable decline.
Trading volume also increased. Total NYSE volume reached approximately 5.44 billion shares, about 4% higher than Wednesday’s 5.24 billion shares.
Higher volume combined with sharply negative breadth and a large number of new lows is a combination worth watching closely.
NASDAQ: Breadth Weakens and New Lows Increase
The NASDAQ also finished with negative breadth.
There were 2,874 declining issues versus 1,993 advancing issues, with 431 unchanged. This produced a decliner-to-advancer ratio of approximately 1.44 to 1, meaning there were roughly three decliners for every two advancers.
The NASDAQ recorded 79 new 52-week highs and 486 new 52-week lows, compared with 83 new highs and 437 new lows Wednesday.
The deterioration came from both directions: new 52-week highs declined approximately 5%, while new 52-week lows increased approximately 11%.
This pushed the NASDAQ back toward the pattern seen earlier in the week, when new lows were consistently outnumbering new highs by a substantial margin.
The market’s internal indicators therefore remain weakened despite the NASDAQ Composite itself managing to finish essentially unchanged on Thursday.
NASDAQ trading volume totaled approximately 8.35 billion shares, about 6% below Wednesday’s 8.91 billion shares.
The lower volume is somewhat less concerning than the NYSE’s volume increase, but it does not negate the deterioration in breadth and new-low statistics.
The Breadth Divergence Matters
Thursday’s data reinforces an important distinction between index performance and the performance of individual stocks.
The Nasdaq Composite and S&P 500 remain above their major moving averages, yet a large number of individual stocks are simultaneously making new 52-week lows.
This means the strength visible in the major indexes is not being evenly distributed throughout the market.
For traders, this type of divergence is particularly important. A market can continue to hold up at the index level while underlying participation deteriorates. If the weakness in individual stocks continues to broaden, it can eventually become more difficult for the major indexes to maintain their current technical positions.
Key Takeaway for Traders and Investors
The most important message from Thursday’s market statistics is continued deterioration in breadth beneath relatively stable headline indexes.
On the NYSE, declining issues outnumbered advancing issues by more than 2 to 1, while new 52-week lows exceeded new highs by almost 9 to 1.
NASDAQ breadth was also negative, with new lows substantially exceeding new highs and the number of new lows increasing another 11% from Wednesday.
This does not, by itself, establish that a new market trend has begun. However, it does indicate that the market’s internal condition has weakened and deserves close monitoring.
The key question now is whether Thursday’s deterioration represents a temporary reaction or the early stages of a broader change in market participation.
What to Watch Friday
1. New 52-week lows
This is arguably the most important internal indicator. A continued expansion in new lows would signal that weakness is spreading even if the major indexes remain relatively stable.
2. NYSE breadth
Watch whether the 2.11-to-1 decliner-to-advancer ratio improves. A substantial improvement would suggest that Thursday’s weak breadth may have been temporary.
3. NASDAQ breadth
The NASDAQ remains technically stronger than the Dow and Russell 2000, but its internal statistics have weakened. Traders should watch whether advancing issues begin to regain control.
4. Volume
NYSE volume increased 4%, while NASDAQ volume declined 6%. Friday’s volume will help determine whether Thursday’s internal deterioration was accompanied by sustained participation or was more event-driven.
5. New highs versus new lows
A meaningful improvement would require more than simply stable indexes. Traders should look for new highs to expand and new lows to contract.
6. Index versus internal divergence
The Nasdaq and S&P 500 remain above their 25-day, 50-day and 200-day moving averages. If those indexes continue to hold their technical levels while breadth deteriorates further, the divergence will become increasingly important to monitor.
Bottom line: Thursday’s U.S. market statistics were considerably weaker than the headline index numbers suggested. The NYSE showed particularly poor breadth, while both exchanges recorded substantially more new 52-week lows than highs. For Friday, traders should focus less on whether the major indexes move a few points higher or lower and more on whether market participation begins to improve—or whether the deterioration in breadth and new lows continues.
Thursday’s U.S. Market Wrap-Up
Rising Treasury Yields Keep Pressure on U.S. Equities: The bond market remains the dominant force behind Thursday’s equity action. U.S. stocks finished essentially flat to modestly lower, but the underlying market statistics continued to deteriorate as Treasury yields pushed higher and investors reassessed the path of Federal Reserve interest rates.
The Dow Jones Industrial Average fell 161.61 points, or 0.31%, while the S&P 500 slipped just 1.90 points, or 0.02%. The Nasdaq Composite managed a marginal 3.34-point gain, or 0.01%, while the Russell 2000 declined 0.11%.
The quiet headline performance should not obscure the broader message from the market internals. Both the NYSE and NASDAQ recorded significantly more declining stocks than advancing stocks, while new 52-week lows continued to overwhelm new highs.
The bond market was again at the center of attention. The 10-year Treasury yield moved above 5.1%, reaching levels not seen since 2007, while the 2-year yield also moved sharply higher. Recent market commentary has pointed to stronger economic data, higher oil prices and rising inflation concerns as factors contributing to increased expectations for tighter Federal Reserve policy.
For equity traders, the significance is straightforward: higher Treasury yields increase the discount rate applied to future corporate earnings and can place particular pressure on highly valued growth stocks.
The Indexes Are Holding Up Better Than the Internals: Thursday’s major-index performance was relatively calm, but the underlying breadth statistics were considerably weaker.
At the NYSE, declining issues outnumbered advancing issues by approximately 2.11 to 1. At the NASDAQ, the ratio was approximately 1.44 decliners for every advancing issue.
The new-high/new-low figures were even more striking.
The NYSE recorded 92 new 52-week highs versus 818 new 52-week lows. On the NASDAQ, there were 79 new highs versus 486 new lows.
This means that the market’s internal condition remains significantly weaker than the headline index performance suggests.
The deterioration is particularly noteworthy because the Nasdaq and S&P 500 remain above their 25-day, 50-day and 200-day moving averages. The indexes are therefore maintaining relatively strong technical structures while a growing number of individual stocks are experiencing weakness underneath the surface.
For traders, this divergence deserves close attention.
Sector Leadership Remains Narrow: Only four of the eleven major sectors finished higher Thursday.
Healthcare was the strongest sector, gaining 0.67%. Telecommunications Services rose approximately 0.33%, while Energy advanced 0.18%. Technology was essentially unchanged, gaining just 0.01%.
On the downside, Financials fell 0.26%. Consumer Durables & Services declined 0.97%, while Basic Materials was the weakest major sector, falling 1.15%.
The sector picture therefore remains defensive and uneven. Healthcare provided the strongest leadership, while technology—despite the Nasdaq’s ability to finish marginally higher—did not provide significant sector-wide momentum.
The weakness in Basic Materials is also notable given the continued rise in Treasury yields and pressure on economically sensitive and commodity-related shares.
Eli Lilly Gets FDA Approval for Once-Weekly Insulin
Healthcare had one of the day’s strongest sector performances, and Eli Lilly provided an important company-specific development.
Eli Lilly announced Thursday that the U.S. Food and Drug Administration approved Onswik, a once-weekly basal insulin injection for adults with type 2 diabetes. The company said the treatment is designed to provide basal insulin coverage over seven days and could reduce the number of injections by more than 300 per year compared with once-daily basal insulin.
The approval expands Lilly’s diabetes portfolio and gives investors another product development to monitor as the company continues to build its diabetes and metabolic-disease franchise.
For traders, the broader healthcare sector’s relative strength is also worth watching if market leadership continues to rotate away from higher-duration growth stocks.
Semiconductor Stocks Deliver a Mixed Message
The semiconductor group was particularly interesting Thursday because performance varied considerably among individual names.
Intel (INTC) gained 3.91%, while Micron Technology (MU) added 0.81%. In contrast, SanDisk (SNDK) fell 3.47%, NVIDIA (NVDA) declined 0.41%, and Tower Semiconductor (TSEM) dropped 5.74%.
The selling was more pronounced among storage-related stocks. Western Digital (WDC) fell 4.94%, while Seagate Technology (STX) declined 1.86%.
The weakness in memory and storage names comes as semiconductor stocks contend with a broader technology-market repricing amid higher Treasury yields. Recent market reporting specifically identified SanDisk, Western Digital and Micron among the semiconductor names under pressure as yields moved above 5%.
This makes Thursday’s semiconductor action particularly useful for traders. The group is no longer moving as one block: some names are attracting buyers while others are undergoing significant profit-taking.
Intel and Marvell Remain Worth Watching: Intel was one of the strongest semiconductor performers Thursday, gaining 3.91%. Marvell Technology (MRVL) is another name worth keeping on the trading radar. After a substantial advance this month, the stock appears to be entering a consolidation phase.
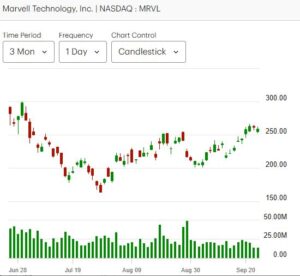
For traders, consolidation following a strong advance can be important to monitor, particularly if the broader technology sector begins to stabilize. The key is whether the stock can hold its recent gains while trading volume and price action establish a new range.
Rather than chasing a strong prior move, traders may want to watch for evidence of whether the consolidation develops into continuation or a deeper retracement.
Small Caps Remain Under Pressure: The Russell 2000 declined only 0.11% Thursday, representing a substantial improvement from Wednesday’s stronger decline.
However, the small-cap index remains below both its 25-day and 50-day moving averages, although it remains above its 200-day average.
This continues to distinguish small caps from the Nasdaq and S&P 500, which remain above all three major moving averages.
The difference is important because small-cap performance can provide useful information about market participation and risk appetite. So far, that participation remains uneven.
Key Takeaway for Traders and Investors
Thursday’s market was much weaker beneath the surface than the nearly unchanged major indexes suggest.
The biggest issue remains the rise in Treasury yields. With the 10-year yield moving above 5% and the 2-year yield also elevated, interest-rate expectations are becoming increasingly important to equity valuations.
At the same time, market breadth continues to deteriorate. The NYSE recorded more than eight times as many new 52-week lows as new highs, while the NASDAQ also showed a substantial imbalance between new lows and new highs.
That creates a clear divergence:
- S&P 500: Still above the 25-day, 50-day and 200-day moving averages.
- Nasdaq: Still above all three major moving averages and narrowly finished higher Thursday.
- Dow: Below its 25-day and 50-day averages, but above its 200-day average.
- Russell 2000: Below its 25-day and 50-day averages, but above its 200-day average.
- Market breadth: Negative on both major exchanges.
- New highs versus new lows: Heavily tilted toward new lows.
- Treasury yields: Remain elevated and are increasingly important for equity valuations.
The message for traders is that the index-level technical picture has not yet broken down, but the deterioration in market internals warrants caution. The next few sessions will be important in determining whether this is simply a period of rotation and profit-taking or whether the weakness is beginning to spread into the major indexes.
What to Watch Friday
- Treasury yields: The 10-year Treasury yield remains the most important macro variable for growth and technology stocks. Another move higher could add further valuation pressure.
- Nasdaq and S&P 500: Both indexes remain above their key moving averages. Watch whether they can maintain that technical strength despite deteriorating market breadth.
- New 52-week lows: This is one of the clearest signs of internal weakness. A continued increase in new lows would suggest that selling pressure is broadening.
- Semiconductor leadership: Watch Intel, Marvell, Micron, NVIDIA, SanDisk, Western Digital and Seagate for signs of rotation within the semiconductor group. Thursday’s wide performance dispersion suggests that stock selection remains particularly important.
- Small-cap participation: The Russell 2000 remains below its 25-day and 50-day averages. A sustained recovery would provide evidence of improving participation beyond the largest companies.
- Financials and Basic Materials: Both sectors declined Thursday. Continued weakness in these economically sensitive groups could provide additional evidence that rising yields are affecting broader market participation.
.
Bottom line: Thursday’s U.S. market looked relatively calm at the index level, but the underlying statistics were considerably less reassuring. Treasury yields remain the primary macro pressure point, while negative breadth and a heavy concentration of new 52-week lows show that weakness is spreading beneath the surface. For Friday, traders should watch Treasury yields, the major indexes’ moving averages, new lows, small-cap participation and semiconductor leadership for evidence of whether the current weakness is stabilizing or broadening.