







Markets Slide as Oil Prices Surge on Rising Fears of Escalation of Current Geopolitical Conflict
The Canadian Vanguard Stock Market Report Monday August 17, 2026 Edition
.
The Toronto Market
Monday Toronto Market Index
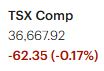
The Toronto S&P/TSX Composite Index slipped 62.35 points, or 0.17%, to close at 36,667.92.
The market remained mildly bearish today, with market breadth also weakening. After advancing for four consecutive sessions, the TSX has now posted two marginal declines, including Friday’s small pullback and today’s 0.17% decline.
This appears to be a mild consolidation following the TSX’s strong performance earlier last week. Given the relatively small decline, today’s move does not warrant significant additional analysis, particularly in the context of the index’s recent strength.
Overall, there continues to be positive momentum behind the TSX’s broader uptrend. The index remains well above its 25-day, 50-day, and 200-day moving averages, which continues to support the underlying bullish trend despite the recent minor pullback.
Monday’s TSX Market Statistics
At the TSX, declining issues (decliners) outnumbered advancing issues (advancers) by a considerable margin. There were 1,309 decliners and 843 advancers, producing a decliner-to-advancer ratio of 1.32 to 1—approximately six decliners for every five advancers. A total of 167 issues closed unchanged.
The exchange recorded 122 new 52-week highs and 50 new 52-week lows, compared with 154 new 52-week highs and 22 new 52-week lows on Friday. Market breadth weakened somewhat today, marking the second consecutive session of deterioration.
The ratio of new 52-week highs to new 52-week lows also declined from Friday. While the number of new 52-week highs fell from 154 to 122, the number of new 52-week lows more than doubled, rising from 22 to 50. New 52-week highs were approximately two and a half times the number of new 52-week lows today, compared with a much stronger seven-to-one ratio on Friday.
Despite this deterioration, the broader market internals remain bullish. However, today’s session showed a noticeable shift toward more bearish market conditions. The geopolitical developments in the Middle East also appeared to weigh on investor sentiment and contributed to the softer tone in the market.
Trading activity increased significantly. Total TSX volume reached 389,819,083 shares, approximately 15% higher than the 338,407,155 shares traded on Friday. The increase in volume, combined with weaker breadth and a higher number of new 52-week lows, suggests that today’s modest index decline was accompanied by somewhat stronger selling pressure.
Monday’s Toronto TSX Market Wrap-Up Report
Monday was an all-round negative session for the Toronto Stock Exchange, with the TSX Composite Index slipping 62.35 points, or 0.17%, to close at 36,667.92. The modest decline came after four consecutive advancing sessions and can best be viewed as a mild pullback following the TSX’s strong performance earlier last week.
Only two of the ten major TSX sectors finished higher. Basic Materials was the strongest-performing sector, gaining 1.16%, while Energy followed with a 0.82% advance. Financials declined 0.50%.
The consumer and technology sectors were among the weakest performers. Consumer Discretionary Goods & Services fell 1.00%, while Consumer Durable Goods & Services declined 1.67%. Technology was the session’s clear laggard, falling a hefty 3.22%.
Market Breadth Weakened
A closer look at the market internals confirms the negative tone of Monday’s session. Declining issues outnumbered advancing issues by 1,309 to 843, producing a decliner-to-advancer ratio of 1.32 to 1, or approximately six decliners for every five advancers. Another 167 issues closed unchanged.
The new 52-week high/low statistics also showed some deterioration. There were 122 new 52-week highs and 50 new 52-week lows, compared with 154 new highs and only 22 new lows on Friday.
Although new 52-week highs still outnumbered new lows by approximately 2.4 to 1, the quality of the breadth was clearly weaker than on Friday, when the ratio was approximately 7 to 1. More importantly, the number of new 52-week lows more than doubled from 22 to 50.
This represents the second consecutive session of weakening market breadth. Nevertheless, the broader market internals remain constructive, and Monday’s deterioration should be viewed in the context of the TSX’s recent strength rather than as evidence of a confirmed trend reversal.
Trading activity also increased. Total TSX volume reached 389.8 million shares, approximately 15% higher than Friday’s 338.4 million shares. The combination of higher volume, weaker breadth and a larger number of new 52-week lows suggests that selling pressure was somewhat more pronounced beneath the surface than the modest 0.17% index decline alone would indicate.
Geopolitical developments in the Middle East also appeared to weigh on investor sentiment and contributed to the more defensive tone during the session.
.
All Six Major Canadian Banks Declined
One of the clearest signs of Monday’s broadly negative tone was the performance of the six major Canadian banks. All six declined, although the losses were relatively small and there were no major selloffs among the group.
Bank of Montreal (BMO) was the weakest of the Big Six, falling 0.32%, with approximately 1.31 million shares traded. Toronto-Dominion Bank (TD) was the best performer among the six, declining only 0.05%, with approximately 1.92 million shares changing hands.
The relatively modest losses among the banks are important. While the universal decline points to some broad-based selling pressure, the absence of significant losses suggests that investors were not aggressively abandoning the financial sector.
Energy and Gold Miners Lead the Winners
Energy and gold-mining companies dominated Monday’s list of top-performing TSX stocks.
Spartan Delta Corp. (SDE) was among the session’s strongest performers, gaining 5.0% to close at $12.77, on approximately 416,500 shares traded. Although SDE falls below our usual $15 share-price and 100,000-share average-volume criteria, its strong daily performance warrants mentioning.
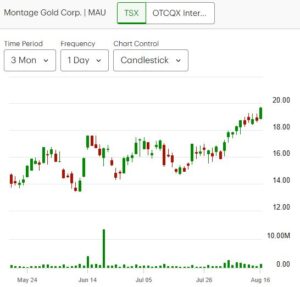
Montage Gold Corp. (MAU) was another notable performer, gaining 5.0% to close at $19.70, with approximately 1.32 million shares traded. MAU has now advanced in eight of the last ten market sessions, making it a particularly interesting momentum stock to monitor.
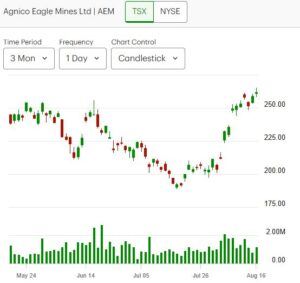
Agnico Eagle Mines (AEM) gained 1.1%, closing at $261.67, with approximately 1.15 million shares traded. AEM remains well above its 25-day, 50-day and 200-day moving averages, indicating that its longer- and intermediate-term technical trend remains firmly positive.
SSR Mining Inc. (SSRM) also finished higher, gaining 1.65% to close at $45.43, with approximately 184,850 shares traded.
MAU, AEM and SSRM are three stocks that may be worth keeping on a trader’s watchlist, particularly given the continued strength in the gold-mining segment.
Key Takeaways for Traders and Investors
1. The TSX remains in an uptrend.
Despite Monday’s decline, the TSX remains well above its 25-day, 50-day and 200-day moving averages. The broader technical picture therefore remains constructive.
2. Monday’s weakness was more visible beneath the surface.
The 0.17% index decline was modest, but declining issues outnumbered advancing issues 1.32 to 1, while new 52-week lows more than doubled. Traders should therefore pay attention to whether this deterioration continues.
3. Breadth is the key indicator to watch.
This was the second consecutive session of weakening breadth. A further deterioration in the advance/decline ratio and the new-high/new-low ratio would provide a stronger warning that the market’s momentum is losing strength.
4. The increase in trading volume deserves attention.
Volume rose approximately 15% while the index declined. If higher-volume selling continues in subsequent sessions, it would represent a more meaningful bearish signal. One isolated session, however, is not enough to establish a reversal.
5. Gold and energy stocks continue to show relative strength.
With Basic Materials and Energy leading the sectors higher, and several gold miners appearing among the TSX’s strongest performers, traders may want to continue monitoring these groups for momentum opportunities.
6. MAU, AEM and SSRM merit watching.
MAU’s advance in eight of the last ten sessions is particularly notable, while AEM’s position well above its major moving averages confirms strong technical momentum. SSRM also showed positive price action Monday.
Bottom Line
Monday’s session was bearish in character but not yet bearish enough to change the TSX’s broader bullish trend. The index’s 0.17% decline was relatively insignificant after four consecutive advancing sessions, but the deterioration in market breadth, the increase in new 52-week lows and the higher trading volume suggest that traders should become somewhat more cautious.
For now, the evidence points to a healthy pullback within a broader uptrend rather than a confirmed market reversal. The next few sessions will be important. If breadth stabilizes and the TSX resumes its advance, Monday’s weakness will likely prove to have been little more than consolidation. Conversely, continued deterioration in breadth accompanied by heavier selling volume would warrant a more defensive stance.
.
The US Markets
Monday’s U.S. Market Indexes
All four major U.S. market indexes finished Monday’s session in negative territory, although the declines were relatively modest.
The Dow Jones Industrial Average fell 272.63 points, or 0.51%, to close at 53,459.78. The S&P 500 declined 40.70 points, or 0.52%, finishing at 7,745.06. The Nasdaq Composite slipped 84.26 points, or 0.32%, to close at 26,644.91, while the Russell 2000 dropped 10.88 points, or 0.35%, ending the session at 3,057.54.

Nasdaq Takes a Pause
The Nasdaq underperformed on Monday and recorded its second consecutive declining session. Following its strong performance since the beginning of August, the index may simply be taking a pause and consolidating some of its recent gains.
The Nasdaq had appeared poised to challenge the psychologically important 27,000 level, but Monday’s decline has moved the index further away from that milestone. The setback, however, remains relatively small and does not currently alter the broader technical picture.
Small-Caps Give Back Some Ground
The Russell 2000 also moved lower after advancing for five consecutive sessions. Small-cap stocks appeared to be particularly sensitive to the more cautious tone in the market on Monday.
The decline should be monitored, especially because the Russell 2000 is an important indicator of investor appetite for smaller, more economically sensitive companies. However, one modest decline following a five-session advance is not, by itself, a significant bearish signal.
Geopolitical Developments Weigh on Sentiment
Monday’s market weakness was influenced in part by geopolitical developments overseas, particularly developments surrounding the Middle East conflict. These events can quickly affect investor sentiment and create short-term volatility across equities.
For traders, the important issue is not simply Monday’s decline but how the market responds to further geopolitical developments. A resilient market that absorbs negative news without significant technical damage would be a positive sign. Conversely, persistent selling accompanied by deteriorating market internals could signal that investors are becoming increasingly risk-averse.
.
Technical Picture Remains Positive
Despite Monday’s declines, the broader technical picture remains encouraging.
At Monday’s close, the Nasdaq, S&P 500 and Russell 2000 remained well above their 25-day, 50-day and 200-day moving averages. This is an important consideration for investors because it indicates that the underlying intermediate- and long-term trends remain positive despite the recent pullback.
The relatively small declines in the major indexes also suggest that Monday was more of a risk-off or consolidation session than a major change in market direction.
.
Key Takeaways for Traders and Investors
1. Monday’s weakness was modest.
All four major indexes declined, but none experienced a major selloff. The market remains technically intact.
2. The Nasdaq needs monitoring.
Two consecutive declining sessions have pushed the Nasdaq further away from the 27,000 level. Traders should watch whether the index stabilizes or whether the pullback develops into a deeper correction.
3. Small-caps deserve attention.
The Russell 2000 ended a five-session winning streak. Continued weakness in small-caps would be worth watching as a potential indication of declining risk appetite.
4. Market internals remain supportive.
Despite Monday’s negative session, the underlying market internals remain strong. This supports the view that the current weakness is more likely consolidation than a confirmed trend reversal.
5. Moving averages remain firmly positive.
The Nasdaq, S&P 500 and Russell 2000 are all positioned above their 25-day, 50-day and 200-day moving averages. Traders should therefore be cautious about interpreting a few down sessions as the beginning of a major market decline.
6. Geopolitical risk remains the wild card.
The market’s reaction to developments in the Middle East should be watched closely. A sustained deterioration in investor sentiment, particularly if accompanied by rising selling volume and weakening breadth, would make the current pullback more concerning.
.
Bottom Line
Monday was a negative but relatively orderly U.S. market session. All four major indexes declined, but the losses were limited and the technical structure of the market remains broadly bullish.
For now, the evidence points more toward consolidation following a strong run than the beginning of a major market reversal. The Nasdaq’s inability to challenge 27,000 in the near term and the Russell 2000’s pullback after five advancing sessions are worth monitoring, but the indexes remain comfortably above their major moving averages.
The key question for traders over the next several sessions is whether the market can absorb the geopolitical uncertainty and resume its advance—or whether the current modest pullback develops into something more significant.
Monday’s U.S. Market Statistics
Monday’s U.S. market statistics showed a clear deterioration in market breadth, with declining stocks significantly outnumbering advancing stocks on both the NYSE and Nasdaq. Trading volume also increased on both exchanges while the major indexes declined. These developments warrant attention, although they are not yet strong enough to conclude that the broader market uptrend has ended.
New York Stock Exchange (NYSE): At the New York Stock Exchange, declining issues substantially outnumbered advancing issues. There were 2,861 decliners, 1,627 advancers and 509 unchanged issues, producing a decliner-to-advancer ratio of 1.76 to 1—approximately nine decliners for every five advancers. This is clearly a bearish breadth reading for the session.
The NYSE recorded 275 new 52-week highs and 226 new 52-week lows, compared with 348 new highs and 125 new lows on Friday. The number of new highs therefore declined considerably, while new lows increased significantly.
As a result, the new-high-to-new-low ratio weakened to approximately 6 to 5, compared with a much stronger ratio on Friday. New highs still narrowly outnumbered new lows, but the deterioration is notable and suggests that market internals became more bearish beneath the surface.
Trading activity also increased. Total NYSE volume reached approximately 4.59 billion shares, up about 8% from Friday’s 4.24 billion shares.
The combination of weaker breadth, higher volume and a declining market is not the preferred combination for investors. However, one session does not establish a trend. The important question is whether the increase in volume and deterioration in breadth continue over the next several sessions or prove to be a one-day reaction to current market conditions.
Nasdaq Market: The Nasdaq also experienced a noticeable deterioration in market breadth. There were 3,106 decliners and 1,848 advancers, with 394 issues unchanged. This produced a decliner-to-advancer ratio of 1.68 to 1, or approximately eight decliners for every five advancers.
This was another clearly negative breadth reading and indicates that the weakness was broad-based rather than concentrated in only a few large-cap stocks.
The Nasdaq recorded 168 new 52-week highs and 168 new 52-week lows, compared with 238 new highs and 123 new lows on Friday.
For the first time in this comparison, new 52-week highs and new 52-week lows were exactly equal. There was therefore no advantage for either side in Monday’s new-high/new-low contest. However, the deterioration from Friday is important: new highs fell substantially while new lows increased.
An equal number of new highs and new lows does not, by itself, establish a bearish trend. However, if new lows continue to increase and eventually exceed new highs, it would represent a more significant warning that market internals are becoming bearish.
Nasdaq trading volume reached approximately 7.88 billion shares, about 6% higher than Friday’s 7.40 billion shares.
Once again, the combination of a declining index and higher trading volume deserves attention. At this stage, however, the increase in volume is not large enough to conclude that a major change in market direction is underway.
Market Breadth Is Sending a Warning
The most important message from Monday’s statistics is the simultaneous weakening of market breadth on both major U.S. exchanges.
On the NYSE, the decliner-to-advancer ratio was 1.76 to 1, while on the Nasdaq it was 1.68 to 1. New 52-week highs also declined on both exchanges, while new 52-week lows increased.
This is a shift in the wrong direction for the bulls.
At the same time, the deterioration needs to be kept in perspective. The major indexes experienced only modest declines, and the Nasdaq, S&P 500 and Russell 2000 remain comfortably above their 25-day, 50-day and 200-day moving averages.
The Nasdaq has also enjoyed a strong advance recently, so a two-session pullback or period of consolidation is not unusual. The market does not need to advance every day to remain in a healthy uptrend.
Key Takeaways for Traders and Investors
1. Market breadth weakened on both exchanges.
The NYSE and Nasdaq both recorded significantly more decliners than advancers. This is the clearest bearish feature of Monday’s market statistics.
2. New 52-week highs lost ground while new lows increased.
This is another warning sign. The NYSE still had more new highs than new lows, but the margin narrowed considerably. On the Nasdaq, new highs and new lows were equal.
3. Higher volume during a declining session deserves attention.
NYSE volume increased approximately 8%, while Nasdaq volume increased about 6%. This does not necessarily signal distribution, but traders should watch whether higher-volume selling continues.
4. The technical trend remains bullish—for now.
The major indexes remain above their 25-day, 50-day and 200-day moving averages. Monday’s market statistics therefore suggest caution rather than capitulation.
5. Do not make major portfolio decisions based on one session.
Monday’s statistics are a warning to monitor the market more closely, not a reason by themselves to abandon a bullish strategy. A sustained deterioration in breadth over several sessions would carry considerably more weight.
6. Watch the Nasdaq closely.
The Nasdaq’s new-high/new-low balance has deteriorated, and the index has now declined for two consecutive sessions. Continued weakness accompanied by increasing new lows would make the current pause more concerning.
Bottom Line
Monday’s U.S. market statistics were more bearish than the relatively modest index declines suggest. Both the NYSE and Nasdaq experienced weak breadth, new 52-week highs declined, new lows increased, and trading volume rose.
These are developments that traders and investors should keep on their radar, but they do not yet constitute confirmation of a major market reversal. The broader technical trend remains positive, with the major indexes still well above their key moving averages.
For now, the appropriate approach is to stay alert and let the data accumulate. If breadth improves over the next few sessions, Monday will likely prove to have been a temporary deterioration during a normal market pullback. If declining issues continue to dominate, new lows continue to rise and higher-volume selling persists, the market’s risk profile would become increasingly bearish.
.
Monday U.S. Market Wrap-Up Report
Monday was an all-around negative session for the U.S. stock market, with all four major market indexes closing lower. The Dow Jones Industrial Average fell 272.63 points, or 0.51%, to 53,459.78, while the S&P 500 declined 40.70 points, or 0.52%, to 7,745.06. The Nasdaq Composite slipped 0.32% to 26,644.91, and the Russell 2000 declined 0.35% to 3,057.54.
The declines were not large, but the market’s internal statistics were considerably weaker than the index numbers alone might suggest. Declining stocks substantially outnumbered advancing stocks on both the NYSE and Nasdaq, new 52-week highs declined while new lows increased, and trading volume increased on both exchanges.
Geopolitical Developments Remain a Major Market Risk
The U.S. bond market also experienced selling pressure on Monday. The 30-year Treasury yield rose to 5.31%, its highest level in 19 years, while the 10-year Treasury yield increased three basis points to 4.72%.
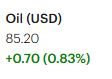
Geopolitical developments involving the Middle East were an important influence on Monday’s market. Reports concerning possible escalation involving the United States and Iran, together with concerns about disruptions to shipping through the Strait of Hormuz, contributed to higher oil prices. Brent crude moved above $90 a barrel.
There is an important lesson for traders and investors here: geopolitical developments can move financial markets in real time. When investors become concerned that a conflict could disrupt oil supplies or shipping routes, oil prices can rise quickly, bond yields can move and equity markets can come under pressure.
The relationship between higher oil prices and weaker stock markets has become an important short-term market theme during the current Middle East conflict. Investors can conduct extensive fundamental and technical research, but a major geopolitical announcement can change market sentiment almost immediately.
For that reason, traders should remain particularly attentive to developments surrounding the Middle East conflict. Investors should also have a strategy for dealing with sudden geopolitical shocks. One possible approach in the current environment is to avoid taking unnecessarily large positions in extremely volatile stocks until the geopolitical situation becomes clearer.
Market Breadth Deteriorated
Monday’s market internals provide a more cautious picture than the relatively small declines in the major indexes.
On the NYSE, there were 2,861 decliners compared with 1,627 advancers, producing a decliner-to-advancer ratio of 1.76 to 1—approximately nine declining stocks for every five advancing stocks. There were 509 unchanged issues.
The NYSE recorded 275 new 52-week highs and 226 new 52-week lows, compared with 348 new highs and 125 new lows on Friday. New highs therefore declined substantially while new lows increased.
On the Nasdaq, 3,106 stocks declined compared with 1,848 advancers, producing a decliner-to-advancer ratio of 1.68 to 1, or approximately eight decliners for every five advancers.
The Nasdaq recorded 168 new 52-week highs and 168 new 52-week lows, compared with 238 new highs and 123 new lows on Friday. The fact that new highs and new lows were exactly equal is notable, particularly because new lows increased significantly from the previous session.
These statistics indicate that market breadth weakened on both major U.S. exchanges. The market internals are beginning to lean more bearish, although they have not yet provided enough evidence to conclude that the broader market uptrend has ended.
Higher Volume Adds Another Warning
Trading volume increased on both exchanges while the market declined.
NYSE volume reached approximately 4.59 billion shares, about 8% higher than Friday’s 4.24 billion shares. Nasdaq volume reached approximately 7.88 billion shares, about 6% higher than Friday’s 7.40 billion shares.
Higher volume accompanying a declining market is not the preferred combination for investors. It deserves attention, particularly when combined with weaker market breadth and a deterioration in the new-high/new-low balance.
However, Monday’s increase in volume was not sufficiently dramatic to conclude that a major distribution phase has begun. Traders should watch to see whether elevated volume and weak breadth continue over the next several sessions or whether Monday proves to be a one-day reaction to geopolitical news and recent market gains.
Five of Eleven Major Sectors Gained
Despite the negative session, five of the eleven major S&P 500 sectors finished higher.
Industrials was the strongest sector, gaining 0.59%. Energy followed with a 0.35% gain. Healthcare advanced 0.20%, Basic Materials rose 0.15%, and Utilities edged higher by 0.01%.
Technology declined 0.31%, while Financials fell 0.37%. The two consumer retail-oriented sectors were the weakest performers, making Monday a particularly poor session for retail stocks.
The sector performance shows that Monday’s weakness was not a uniform selloff. Energy and industrial-related stocks demonstrated relative strength, while technology and consumer-related areas were weaker.
Semiconductor and Disk-Drive Stocks Continue Their Rebound
One of the most interesting developments on Monday was the continued rebound in semiconductor, semiconductor-equipment and disk-drive stocks.
SanDisk Corp. (SNDK) was among the strongest performers in the S&P 500, gaining 8.88% and closing at $1,786.85, with approximately 18 million shares traded.
Several major semiconductor and chip-equipment companies also posted strong gains. Marvell Technology (MRVL) advanced 5.54% to $234.33, with approximately 21.1 million shares traded. Applied Materials (AMAT) gained 5.55% to $535.31, with approximately 9.6 million shares traded.
Micron Technology (MU) rose 4.13% to $1,011.75, with approximately 33.4 million shares changing hands. Intel (INTC) continued its recovery, although its gain was more modest at 0.97%, closing at $103.49 on approximately 88.6 million shares.
The disk-drive stocks also remained strong. Western Digital (WDC) advanced 5.35% to $536.01, with approximately 9.3 million shares traded, while Seagate Technology (STX) gained 2.19% to $994.79, with approximately 4.3 million shares traded.
The continued strength in these groups is worth watching. Several semiconductor and technology-related stocks suffered significant declines during the earlier period of geopolitical uncertainty and sector rotation. The current rebound suggests that some investors are returning to areas that had previously experienced heavy selling.
For traders, the important question is whether this rebound develops into a sustained recovery or remains a short-term countertrend move. Strong price gains accompanied by healthy trading volume make these stocks particularly interesting to monitor.
.
Key Takeaways for Traders and Investors
1. Monday’s index declines were modest, but the internals were considerably weaker.
The major indexes fell only about 0.3% to 0.5%, but declining stocks outnumbered advancing stocks by substantial margins on both the NYSE and Nasdaq.
2. Breadth is the most important warning signal right now.
New 52-week highs declined on both exchanges while new lows increased. The Nasdaq finished with exactly 168 new highs and 168 new lows. Traders should watch whether new lows continue to expand.
3. Higher volume during a declining session deserves attention.
NYSE volume increased 8% and Nasdaq volume increased 6%. If higher-volume selling continues, the market’s recent weakness would become more concerning.
4. The broader technical trend remains positive.
Despite Monday’s weakness, the Nasdaq, S&P 500 and Russell 2000 remain above their 25-day, 50-day and 200-day moving averages. This is an important reason not to overreact to one or two declining sessions.
5. The Nasdaq may simply be taking a pause.
The Nasdaq has performed strongly since the beginning of August and is now experiencing its second consecutive declining session. A short-term consolidation after a strong advance is not unusual.
6. Small-cap weakness should be monitored.
The Russell 2000 ended a five-session winning streak. Continued weakness in small-caps could provide an early indication that investors are becoming less willing to take risk.
7. Geopolitical news remains the market’s wild card.
Developments involving Iran, the United States, the Middle East and the Strait of Hormuz can affect oil prices and investor sentiment almost immediately. Traders should be prepared for sudden market reactions.
8. Semiconductor and disk-drive stocks are showing impressive relative strength.
SNDK, MRVL, AMAT, MU, INTC, WDC and STX all posted gains Monday. The continued rebound in these groups is worth monitoring for potential momentum opportunities.
Bottom Line
Monday was a negative market session with increasingly cautious market internals, but it was not a major selloff. The deterioration in breadth and the increase in trading volume are warning signs that deserve close attention, particularly if they persist for several more sessions.
At the same time, the major indexes remain above their key moving averages, and several technology, semiconductor and disk-drive stocks are showing strong relative performance. The evidence therefore does not yet justify treating Monday as the beginning of a major market reversal.
For now, traders and investors should remain invested according to their individual strategies while becoming more selective about new positions. The next few sessions will be important in determining whether Monday’s weakness was simply a geopolitical-driven pause after a strong advance or the beginning of a broader deterioration in market conditions.
The most important indicators to watch are market breadth, new 52-week highs and lows, trading volume, oil prices and the market’s reaction to further Middle East developments
.
NOTICE TO READERS
The Canadian Vanguard Stock Market is about empowering you to build and manage your wealth by yourself. There is certainly no magic in managing finances or wealth but one needs to know what to do and commit to doing what is needed. When you are ready to start the journey to Take Charge and Put Your Destiny In Your Own Hands, start with reading The Canadian Vanguard every market day. If and when you need more related information or to advertise your business products or services in The Canadian Vanguard, Contact Us
Our readers are strongly advised to conduct their own research into individual stocks before making a purchase decision. In addition, investors are advised that past stock performance is no guarantee of future price appreciation. Any recommendation is not a guarantee of any particular stock’s future prices, and The Canadian Vanguard accepts no responsibility or liability for investors’ or readers’ purchases.
Stocks In The News/ Stocks To Watch and Market Strategy will soon be available only to Paying Subscribers. The dollar sign “$” in the Toronto Market section in the articles only stands for Canadian dollar and in the US market section “$” stands for US dollar.
(c) This article is published by The Canadian Vanguard on August 17, 2026



