
Market Indexes Retreat as Treasury Yields Hit Multi-Decade Highs, While Nasdaq and S&P 500 Show Resilience
The Canadian Vanguard Stock Market Report Wednesday, October 7, 2026, Edition
.
The Toronto Market
Wednesday’s Toronto Market Index
The S&P/TSX Composite Index fell 607.65 points, or 1.70%, to close at 35,041.86.
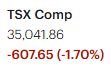
The TSX ended a two-session winning streak today. More importantly, the magnitude of the decline stands out. The index fell 1.70% in a single session, a relatively significant move for the TSX. Today’s decline effectively erased the gains from the previous two sessions.
Surging U.S. Treasury yields are weighing negatively on financial markets. Rising yields are contributing to increased market volatility and creating a more bearish bias.
The TSX remains below both its 25-day and 50-day moving averages, although it continues to maintain a healthy gap above its longer-term 200-day moving average. The market will likely regain a more positive tone once the current period of sharply rising Treasury yields subsides.
Wednesday’s TSX Market Statistics
At the TSX, declining issues (decliners) significantly outnumbered advancing issues (advancers). Specifically, there were 1,599 decliners and 654 advancers, producing a decliner-to-advancer ratio of 2.44 to 1—approximately five decliners for every two advancers. A total of 124 issues were unchanged.
The exchange recorded 37 new 52-week highs and 91 new 52-week lows, compared with 167 new 52-week highs and 65 new 52-week lows yesterday. This represents a significant deterioration in market breadth. The ratio of new 52-week highs to new 52-week lows fell to approximately 1 to 3, indicating that new lows substantially outnumbered new highs.
The number of new 52-week highs dropped sharply from 167 yesterday to just 37 today, while new 52-week lows increased from 65 to 91. These figures indicate a notable weakening in the market’s internal indicators.
The previous two sessions had been positive and had helped improve the condition of the market internals to some extent. However, today’s sharp decline reversed much of that improvement. We will need to see the market’s performance over the next several sessions before determining whether the underlying internals are genuinely improving or whether today’s deterioration signals a renewed weakening trend. For now, the market’s internal indicators remain weak.
Total volume on the TSX reached 426,549,510 shares, 3% lower than the 437,750,178 shares traded yesterday. Although declining stocks significantly outnumbered advancing stocks, trading volume decreased slightly.
Overall, today’s market internals were weak and point to increased market vulnerability. The TSX remains prone to volatility, and investors should continue to exercise caution when trading. Nevertheless, the broader market outlook is gradually improving, although further confirmation from the market internals is still needed.
Wednesday’s Toronto TSX Market Wrap-Up Report
Wednesday was a difficult session for the Toronto market. The TSX opened under pressure as U.S. Treasury yields continued to rise, although yields retreated later in the session. Despite that late improvement in yields, the TSX remained under significant selling pressure and ultimately fell 607.65 points, or 1.70%, to close at 35,041.86.
The decline ended the TSX’s two-session winning streak and erased the gains from those previous two sessions. More importantly, the size of today’s decline highlights how vulnerable the market remains while Treasury yields are moving sharply higher.
Only four of the TSX’s ten major sectors finished higher. Consumer Durables and Services was the strongest-performing sector, gaining 0.97%, followed by Technology, which advanced 0.46%. Telecommunications Services gained 1.04%, while Healthcare rose 0.41%.
The weakest sectors were Basic Materials and Financials, which fell 2.94% and 2.15%, respectively. The weakness in these two important TSX sectors was particularly significant because Financials carry substantial weight in the index, while Basic Materials represents an important part of the resource-oriented character of the Canadian market.
Canadian Banks Under Pressure
Canada’s major banks significantly underperformed the broader market today. Royal Bank of Canada (RY) fell 2.28% to close at $272.82. Canadian Imperial Bank of Commerce (CM) declined 2.57% to $154.57, with approximately 2.2 million shares traded.
Bank of Nova Scotia (BNS) dropped 3.08% to $124.29, with 3.6 million shares changing hands. Toronto-Dominion Bank (TD) fell 3.35% to $162.43 on heavy volume of approximately 12.7 million shares. National Bank of Canada (NA) declined 2.70% to $198.70, with approximately 1.1 million shares traded.
One notable feature of today’s session was the relatively strong trading volume in several of the major banks. The banking group has been under increasing pressure as U.S. Treasury yields have climbed from session to session.
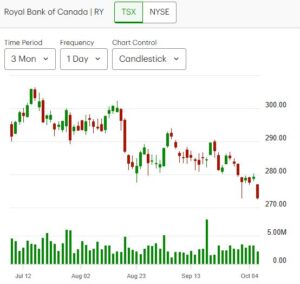
For traders and investors, the performance of the major banks remains important to watch. A sustained recovery in the TSX will likely be more convincing if the Financials sector and major Canadian banks begin participating in the advance. Conversely, continued weakness in the banks could remain a headwind for the broader index.
Market Breadth Deteriorates
The market internals weakened substantially today.
There were 1,599 declining issues compared with only 654 advancing issues, producing a decliner-to-advancer ratio of 2.44 to 1. In other words, roughly five stocks declined for every two stocks that advanced. Another 124 issues were unchanged.
The deterioration was also evident in the 52-week statistics. The TSX recorded only 37 new 52-week highs compared with 91 new 52-week lows. Yesterday, the exchange had recorded 167 new highs and only 65 new lows.
That represents a significant reversal. The new-high-to-new-low ratio fell to approximately 1 to 3 today, compared with a much stronger reading yesterday.
The previous two positive sessions had provided some improvement in the market’s internal indicators. Today’s sharp decline, however, reversed that improvement to a significant degree. The internals remain weak, and traders should look for several more sessions of evidence before concluding that the underlying market condition is improving.
Trading volume also eased slightly. Approximately 426.55 million shares changed hands today, about 3% below yesterday’s 437.75 million shares.
Algoma Central Surges on Dividend Increase
In company news, Algoma Central (ALC.TO) was a standout performer. The company announced a 48% increase in its regular quarterly dividend, from CA$0.21 per share, while its board also declared a special dividend of CA$1.00 per share.
The stock responded strongly, surging approximately 9% to close at a record high of CA$26.25.
This is the type of individual-stock strength that can stand out even during a weak broader market. Traders should nevertheless distinguish between company-specific strength and broad market strength. A strong individual stock can continue to outperform even when the overall market is under pressure, but position management and risk controls remain important.
Shopify Continues to Outperform
Shopify (SHOP) remains another important stock to watch. The shares advanced 1.22% to close at $236.59 on approximately 2.0 million shares traded.
More importantly, Shopify has now advanced for eight consecutive sessions.
The stock’s persistent strength is impressive, but traders should also recognize that extended advances can eventually produce profit-taking and temporary pullbacks. Stocks do not rise indefinitely without pauses. Investors should have a strategy and predetermined rules for dealing with pullbacks rather than reacting emotionally when one occurs.
A pullback by itself does not necessarily mean that an uptrend has ended. The key question is whether the stock maintains its important support levels and whether the broader trend remains intact.
Basic Materials Remains Under Pressure
Basic Materials was one of the weakest sectors today, falling 2.94%. This sector normally provides considerable trading activity within the TSX because of Canada’s large concentration of resource and mining companies.
The sector is currently facing an unfavorable environment as Treasury yields continue to rise and market volatility increases.
Two stocks worth keeping on the watch list are Franco-Nevada (FNV) and Agnico Eagle Mines (AEM). Both stocks are currently trading below their 25-day and 50-day moving averages.
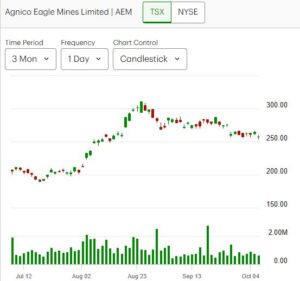
For technical traders, this is an important development. Until these stocks can reclaim those moving averages and demonstrate renewed relative strength, traders may want to remain selective rather than assuming that weakness in the resource sector represents an immediate buying opportunity.
Key Takeaways for Traders and Investors
- The TSX is becoming more volatile. Today’s 1.70% decline was substantial and erased the gains from the previous two sessions.
- Treasury yields remain a major market driver. If the recent surge in yields subsides, the TSX could regain a more constructive tone. Until then, traders should expect continued volatility.
- Market breadth deteriorated sharply. Decliners outnumbered advancers 2.44 to 1, while new 52-week lows outnumbered new highs roughly 3 to 1.
- The banks remain an important warning signal. Major Canadian banks were among the weakest performers today, and their continued weakness could limit the TSX’s ability to recover.
- The TSX remains technically mixed. The index is below its 25-day and 50-day moving averages but remains comfortably above its longer-term 200-day moving average. This suggests that the intermediate-term trend has weakened, while the longer-term trend has not yet been decisively broken.
- Stock selection is becoming increasingly important. Algoma Central and Shopify demonstrated that individual stocks can continue to outperform even when the broader market is weak.
- Do not chase extended winners. Shopify’s eight-session advance is impressive, but traders should be prepared for normal profit-taking and pullbacks. A good risk-management plan is more important after a strong run, not less.
- Watch for confirmation before becoming aggressive. One or two positive sessions are not enough to establish a durable improvement in market internals. Traders should look for sustained improvement in breadth, new highs versus new lows, sector participation, and the performance of the major banks.
Bottom Line
Wednesday’s session was a clear setback for the TSX’s recent improvement. The combination of a 1.70% index decline, weak market breadth, a sharp deterioration in new highs versus new lows, and continued weakness in the major banks suggests that traders should remain cautious.
At the same time, the TSX remains above its 200-day moving average, and several individual stocks continue to show strong relative performance. This argues against becoming excessively bearish based on one difficult session.
For now, selectivity, patience, and risk management remain more important than chasing either strength or weakness. The next several trading sessions should provide a better indication of whether today’s decline was simply a volatile setback or the beginning of a more sustained deterioration in the market.
.
The US Markets
Wednesday’s U.S. Market Indexes
U.S. equity markets came under pressure on Wednesday, ending a three-session winning streak. All four major indexes that we track finished lower, although the S&P 500 and Nasdaq Composite held up considerably better than the Dow Jones Industrial Average and Russell 2000.
The Dow Jones Industrial Average fell 341.41 points, or 0.66%, to close at 51,179.87. The S&P 500 declined 17.16 points, or 0.22%, to finish at 7,801.77. The Nasdaq Composite slipped 61.20 points, or 0.22%, to close at 27,538.69. The Russell 2000 was the weakest performer, falling 37.09 points, or 1.31%, to close at 2,793.20.

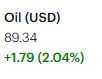
Today’s session was broadly negative, with all four major indexes posting declines. However, the indexes finished well above their session lows. The 10-year U.S. Treasury yield moved higher earlier in the session but retreated several basis points later following a strong Treasury bond auction. The modest decline in oil prices also provided some relief. The retreat in Treasury yields helped reduce some of the pressure on equities and allowed the major indexes to recover from their intraday lows.
Nasdaq and S&P 500 Remain Technically Strong
Despite today’s decline, the Nasdaq Composite continues to display considerable technical strength. The index remains comfortably above its 25-day, 50-day, and 200-day moving averages.
The S&P 500 also remains above its short-, intermediate-, and longer-term moving averages. This is an encouraging technical signal because it indicates that the broader uptrend remains intact despite today’s pullback.
The recent gains have pushed both indexes into relatively strong technical positions. However, traders should continue to monitor Treasury yields closely, as a renewed surge in yields could place additional pressure on growth and technology stocks.
Dow Jones Remains Weaker
The Dow Jones Industrial Average continues to show a weaker technical pattern. The index remains below both its 25-day and 50-day moving averages, although it maintains a small cushion above its 200-day moving average.
This places the Dow in a more vulnerable technical position than the Nasdaq and S&P 500. A sustained move back above the 25-day and 50-day moving averages would improve its short-term technical outlook. Conversely, a decisive break below the 200-day moving average would represent a more significant deterioration in the longer-term trend.
Small-Cap Stocks Take a Hit
Small-cap stocks were hit particularly hard today. The Russell 2000 fell 1.31%, making it by far the weakest of the four major indexes.
The Russell 2000 remains well below both its 25-day and 50-day moving averages and is trading only slightly above its 200-day moving average. This continues to indicate considerable weakness in the small-cap segment of the market.
The relative underperformance of small-cap stocks is worth watching. When investors become more cautious and Treasury yields rise, smaller companies can come under additional pressure because of their greater sensitivity to financing costs and economic conditions.
Market Outlook
Wednesday’s decline was a setback following three consecutive sessions of gains, but it does not yet appear to have materially damaged the technical structure of the Nasdaq or S&P 500. Both indexes remain above their key moving averages.
The bigger concern is the divergence between the major indexes. The Nasdaq and S&P 500 continue to demonstrate relative strength, while the Dow and especially the Russell 2000 remain technically weaker.
For traders and investors, Treasury yields remain an important market variable. A continued decline in yields could help support stocks and allow the recent market recovery to resume. On the other hand, another sustained rise in Treasury yields could increase volatility and put renewed pressure on equities.
For now, the U.S. market remains technically constructive but increasingly sensitive to interest-rate movements. The next several sessions should help determine whether Wednesday’s decline was simply a normal pullback after three consecutive gains or the beginning of a more significant change in market direction.
Wednesday’s U.S. Market Statistics
New York Stock Exchange (NYSE): Market breadth on the New York Stock Exchange was weak on Wednesday, with declining issues significantly outnumbering advancing issues. There were 3,510 decliners, 1,050 advancers, and 451 issues unchanged. This produced a decliner-to-advancer ratio of 3.34 to 1, meaning that more than three stocks declined for every stock that advanced.
The weakness was even more evident in the 52-week statistics. The NYSE recorded only 115 new 52-week highs and 497 new 52-week lows, compared with 258 new highs and 219 new lows yesterday.
The number of new 52-week highs fell sharply from 258 to 115, while new 52-week lows more than doubled, rising from 219 to 497. New lows therefore outnumbered new highs by more than four to one. New 52-week highs represented only approximately 23% of the number of new 52-week lows.
This represents a significant deterioration in market breadth and confirms that the NYSE’s internal indicators remain weak. Yesterday’s improvement in the new-high/new-low relationship was not sustained today.
Total NYSE trading volume reached 5.225 billion shares, approximately 2% higher than the 5.125 billion shares traded yesterday.
Overall, Wednesday’s NYSE statistics were negative. The sharp increase in new 52-week lows is particularly concerning because it indicates that weakness is spreading beneath the surface of the major indexes. We will need to see several more sessions of improving breadth and a sustained reduction in new 52-week lows before concluding that the market internals are genuinely improving.
For now, NYSE market internals remain weak.
NASDAQ: Market breadth was also weak on the NASDAQ. There were 3,493 declining issues compared with 1,419 advancing issues and 408 issues unchanged. This produced a decliner-to-advancer ratio of 2.46 to 1, meaning that approximately five stocks declined for every two that advanced.
The 52-week statistics also deteriorated. The NASDAQ recorded only 55 new 52-week highs and 374 new 52-week lows, compared with 211 new highs and 228 new lows yesterday.
The number of new 52-week highs declined dramatically from 211 to 55, while new 52-week lows increased from 228 to 374. As a result, new lows outnumbered new highs by approximately 6.8 to 1.
This was a clear setback after some improvement in the NASDAQ’s internal indicators during the previous two sessions. The market had been showing signs of improvement, but Wednesday’s statistics reversed some of that progress.
The decline in new highs and increase in new lows indicate that the NASDAQ’s internal indicators remain weak. However, the broader technical picture is somewhat more encouraging because the NASDAQ Composite remains above its 25-day, 50-day, and 200-day moving averages.
NASDAQ trading volume totaled approximately 7.570 billion shares, 14% lower than the 8.719 billion shares traded yesterday. The index declined while trading volume also decreased.
The lower volume is worth noting. Wednesday’s decline was not accompanied by a surge in trading activity, which suggests that the selling pressure did not reach the level of a broad-based panic or capitulation session. Nevertheless, the weak breadth and large number of new 52-week lows show that there is considerable weakness beneath the surface.
.
Key Takeaway for Traders and Investors
The market internals on both the NYSE and NASDAQ weakened on Wednesday. The most concerning development was the sharp increase in new 52-week lows combined with the substantial decline in new 52-week highs.
The NYSE had 497 new lows versus only 115 new highs, while the NASDAQ had 374 new lows versus just 55 new highs. These figures show that the deterioration extends well beyond the headline index performance.
At the same time, the lower NASDAQ trading volume indicates that Wednesday’s decline was not accompanied by panic-level selling. This distinction is important. The market is showing weakness, but Wednesday’s session does not yet look like a capitulation event.
Traders should therefore remain cautious rather than automatically turning aggressively bearish. The next few sessions will be important. A sustained improvement in advancing issues, new 52-week highs, and the new-high/new-low ratio would provide evidence that the internal condition of the market is recovering.
Until that happens, the headline indexes may continue to look stronger than the underlying market, particularly on the NASDAQ. Selectivity, disciplined position sizing, and clearly defined risk controls remain important in this environment.
.
Wednesday’s U.S. Market Wrap-Up Report
Wednesday was a difficult session for U.S. equities, with all four major indexes closing lower and ending a three-session winning streak. The Dow Jones Industrial Average fell 0.66%, the S&P 500 declined 0.22%, the Nasdaq Composite slipped 0.22%, and the Russell 2000 dropped 1.31%.
The Russell 2000 was clearly the weakest performer, highlighting continued weakness in small-cap stocks. The Dow also underperformed the S&P 500 and Nasdaq, while the technology-heavy Nasdaq and broader S&P 500 held up relatively well.
The market came under pressure early in the session as the 10-year Treasury yield moved higher. However, Treasury yields retreated later following a strong bond auction, helping the major indexes recover substantially from their session lows. The retreat in yields provided some relief to investors concerned about tighter financial conditions and higher corporate borrowing costs.
The release of the Federal Reserve’s latest meeting minutes also helped ease some concerns. The minutes did not indicate an urgent need for a rate hike at the next policy meeting, reducing some of the immediate pressure associated with expectations for tighter monetary policy.
Interest rates remain one of the most important variables for the stock market. A sustained decline in Treasury yields could provide additional support for equities, while another sharp rise in yields could quickly bring renewed selling pressure.
Sector Performance
The market’s weakness was broad, with only three of the eleven major sectors finishing higher.
Healthcare was the strongest-performing sector, gaining 0.76%. Telecommunications Services advanced 0.16%, while Consumer Discretionary Goods & Services edged higher by 0.05%.
On the downside, Basic Materials was the weakest sector, falling 2.24%. Industrials declined 1.87%, Financials fell 1.50%, and Technology slipped 0.32%.
The weakness in Financials and Industrials is notable because these sectors are important components of the broader market. The decline in Basic Materials was particularly significant given the sector’s sensitivity to economic expectations, commodity prices, and interest-rate conditions.
Market Internals Remain Weak
While the major indexes did not suffer a dramatic breakdown, the underlying market statistics were considerably weaker than the headline index numbers might suggest.
On the NYSE, 3,510 stocks declined compared with only 1,050 advancing stocks, producing a decliner-to-advancer ratio of 3.34 to 1. The NYSE also recorded just 115 new 52-week highs versus 497 new 52-week lows.
The NASDAQ showed a similar pattern. There were 3,493 declining issues and 1,419 advancing issues, producing a decliner-to-advancer ratio of 2.46 to 1. The exchange recorded only 55 new 52-week highs compared with 374 new 52-week lows.
These figures indicate that market weakness remains widespread beneath the surface. The sharp increase in new 52-week lows is particularly important. The improvement in market internals seen during the previous two sessions was not sustained today.
Trading volume does provide one mitigating factor. NASDAQ volume declined approximately 14% from the previous session, despite the index closing lower. This suggests that Wednesday’s decline was not accompanied by panic-level selling or a major surge in liquidation.
Nevertheless, traders should not ignore the breadth deterioration. The major indexes continue to look considerably stronger than the underlying market internals.
Technology and AI Infrastructure Remain Areas of Strength
One area that continues to attract significant investor interest is enterprise computing and data-center infrastructure, driven largely by the continued buildout of artificial-intelligence infrastructure.
Several companies in the enterprise server, hardware, and data-storage industries have posted substantial gains this year. NetApp (NTAP) has risen approximately 120%, Dell Technologies (DELL) has surged approximately 362%, and Hewlett Packard Enterprise (HPE) has gained approximately 203%. Specialized data-storage manufacturer Pure Storage (PSTG) has also posted a substantial gain of approximately 127%.
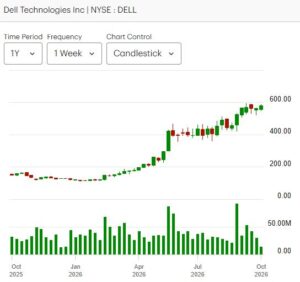
The magnitude of these moves demonstrates the strength of the AI infrastructure investment theme. However, it also presents a risk for momentum traders: stocks that have appreciated dramatically can become increasingly sensitive to profit-taking and valuation concerns.
Traders should therefore distinguish between a strong long-term theme and an attractive entry point. A stock can remain fundamentally attractive while still experiencing a significant short-term pullback.
Technical Picture
The technical picture remains mixed rather than outright bearish.
The Nasdaq Composite remains well above its 25-day, 50-day, and 200-day moving averages, indicating that its primary technical trend remains strong despite Wednesday’s decline.
The S&P 500 also remains above its key short-, intermediate-, and long-term moving averages.
The Dow Jones is in a weaker position, remaining below both its 25-day and 50-day moving averages while holding only a small cushion above its 200-day moving average.
The Russell 2000 remains the most technically vulnerable of the four major indexes. It is well below its 25-day and 50-day moving averages and only slightly above its 200-day moving average.
This divergence is important. The large-cap technology and growth areas continue to provide support for the major indexes, while small-cap stocks and several economically sensitive sectors are showing considerably more weakness.
Key Takeaways for Traders and Investors
- The headline market remains technically stronger than the underlying internals. The Nasdaq and S&P 500 remain above their major moving averages, but market breadth is weak.
- Treasury yields remain a major market catalyst. Wednesday demonstrated how quickly changes in bond yields can influence stocks. A renewed rise in yields could increase selling pressure.
- Small caps remain vulnerable. The Russell 2000’s 1.31% decline and weak position relative to its moving averages indicate that risk appetite remains uneven.
- Market breadth requires attention. New 52-week lows dramatically exceeded new highs on both the NYSE and NASDAQ. This is an important warning sign beneath the surface.
- Wednesday did not look like a panic-selling session. NASDAQ volume declined despite the index falling, suggesting that the selling lacked the characteristics of a major capitulation event.
- AI infrastructure remains a powerful momentum theme. Enterprise hardware and data-storage stocks continue to benefit from AI-related capital spending, but several have already experienced extraordinary gains.
- Stock selection is becoming increasingly important. The divergence between sectors, market-cap groups, and individual stocks means that traders may have better opportunities in specific areas rather than treating the entire market as one trade.
Bottom Line
Wednesday’s session was a setback for U.S. equities, but the technical picture has not yet broken down. The Nasdaq and S&P 500 remain in relatively strong positions, while the Dow and Russell 2000 are considerably weaker.
The bigger concern is what is happening underneath the indexes. The substantial number of new 52-week lows and the weak advance-decline ratios on both the NYSE and NASDAQ indicate that market internals remain fragile.
For now, the market is best described as technically resilient but internally weak. Traders should remain selective and avoid assuming that strength in the major indexes means that the broader market is equally healthy. The next several sessions will be important in determining whether the recent deterioration in market internals is temporary or develops into a more significant market-wide weakness.
.
NOTICE TO READERS
The Canadian Vanguard Stock Market is about empowering you to build and manage your wealth by yourself. There is certainly no magic in managing finances or wealth but one needs to know what to do and commit to doing what is needed. When you are ready to start the journey to Take Charge and Put Your Destiny In Your Own Hands, start with reading The Canadian Vanguard every market day. If and when you need more related information or to advertise your business products or services in The Canadian Vanguard, Contact Us
Our readers are strongly advised to conduct their own research into individual stocks before making a purchase decision. In addition, investors are advised that past stock performance is no guarantee of future price appreciation. Any recommendation is not a guarantee of any particular stock’s future prices, and The Canadian Vanguard accepts no responsibility or liability for investors’ or readers’ purchases.
Stocks In The News/ Stocks To Watch and Market Strategy will soon be available only to Paying Subscribers. The dollar sign “$” in the Toronto Market section in the articles only stands for Canadian dollar and in the US market section “$” stands for US dollar.
(c) This article is published by The Canadian Vanguard on October 7, 2026