




Indexes Retreat as Oil Prices Slip and Rate-Hike Concerns Resurface
The Canadian Vanguard Stock Market Report Weekend August 28-30, 2026 Edition
.
The Toronto Market
Friday Toronto Market Index
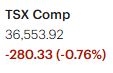
The S&P/TSX Composite Index declined 280.33 points, or 0.76%, on Friday to close at 36,553.92, snapping a five-session winning streak.
Friday’s decline reflected weak market breadth, with only three of the TSX’s ten major sectors posting gains, while the advances that did occur were relatively modest. This suggests that the selling pressure was relatively broad-based rather than being driven by weakness in a single sector. Overall, Friday offered a less favourable trading environment as investors appeared to take profits following the index’s recent advance.
Despite Friday’s pullback, the broader trend remains constructive. The TSX has delivered strong performance year-to-date and continues to rank among the better-performing major equity indexes. The one-day decline therefore appears more consistent with short-term consolidation following a strong run than with a meaningful deterioration in the broader market trend.
From a technical perspective, the index continues to show strong underlying momentum. The TSX remains comfortably above its 25-day, 50-day, and 200-day moving averages, reinforcing the bullish medium- and long-term trend. For traders, these moving averages remain important technical reference points, particularly if the index experiences further near-term weakness.
For investors, the key takeaway is that Friday’s decline has not, by itself, altered the broader bullish structure. Market breadth and price action in the coming sessions will be important in determining whether the pullback develops into a deeper correction or simply represents a pause within the prevailing uptrend
Friday’s TSX Market Statistics
Market breadth turned negative on Friday, with declining issues significantly outnumbering advancing issues on the TSX. There were 1,313 decliners versus 822 advancers, producing a decliner-to-advancer ratio of approximately 1.6-to-1—or roughly eight declining stocks for every five advancing stocks. A total of 135 issues were unchanged.
Despite the negative breadth, the market continued to show healthy participation beneath the surface. The TSX recorded 67 new 52-week highs and 31 new 52-week lows, compared with 54 new highs and 25 new lows on Thursday. While both figures increased, new highs remained more than twice the number of new lows, a constructive signal for the broader market.
The combination of negative daily breadth but a favourable new-high/new-low balance is important for investors and traders. It indicates that Friday’s weakness was relatively broad across individual stocks, but it did not translate into a significant deterioration in the market’s underlying trend. In other words, there was selling pressure, but the number of stocks breaking to new yearly lows remained comparatively contained.
From a market-internals perspective, the picture therefore remains constructive rather than bearish. Traders should continue to monitor the relationship between advancing and declining issues, as well as the new-high/new-low balance, to determine whether Friday’s decline develops into a deeper correction or simply represents short-term profit-taking within the prevailing uptrend
.
Friday’s Toronto TSX Market Wrap-Up Report
Friday was a weak and broadly negative session for the Toronto market, with the S&P/TSX Composite Index falling 280.33 points, or 0.76%, to 36,553.92. The decline ended the index’s five-session winning streak and came against a backdrop of weak market breadth, as only three of the TSX’s ten major sectors finished higher.
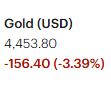
The session’s weakness was particularly evident in the Materials sector, which was the major laggard. Gold and other mining stocks came under significant selling pressure following comments from the Federal Reserve Chair that investors interpreted as increasing the possibility of another interest-rate hike at the Fed’s next meeting. Higher interest-rate expectations generally create a less favourable environment for precious metals and helped trigger profit-taking in several gold-mining stocks after their recent gains.
The release of Canada’s Q2 GDP data was another important market catalyst. Economic growth came in at 3.3%, its strongest pace in almost two years. The stronger-than-expected economic backdrop added to the market’s changing interest-rate expectations and did little to support precious-metals and resource stocks on Friday.
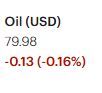
The Energy sector also contributed to the market’s weakness, falling 0.49% as oil prices moved modestly lower. Lower crude prices typically put pressure on energy producers and contributed to declines across a number of energy-related equities.
Geopolitical developments also influenced commodity prices. Reports of potentially easing tensions in the Middle East, including an agreement between Iran and Oman regarding revenue sharing from shipping through the Strait of Hormuz, contributed to some easing in oil prices. For energy traders, developments surrounding the Strait of Hormuz remain an important factor to monitor because any meaningful change in regional tensions could quickly affect crude prices and energy equities.
Mining and Resource Stocks Under Pressure
The selling was particularly pronounced among several large-cap and actively traded mining and resource companies.
Agnico Eagle Mines Ltd. (AEM) declined 3.85%, closing at $286.76, with approximately 1.1 million shares traded. SSR Mining Inc. (SSRM) fell 4.00% to $51.87, on approximately 504,400 shares.
Franco-Nevada Corp. was comparatively resilient, declining 1.70% to $369.97, with approximately 370,600 shares traded. Among the major mining names, Franco-Nevada’s smaller decline indicated relatively better relative strength during Friday’s selloff.
The uranium-related space was also under pressure. Cameco Corporation (CCO) dropped 5.58% to $139.11, with approximately 1.1 million shares changing hands. Energy Fuels Inc. (EFR), a smaller-cap energy and uranium-related company, fell 6.51% to $20.38, with approximately 828,000 shares traded.
The magnitude of the declines in several mining and resource names suggests that traders were actively reducing exposure following the sector’s recent strength. Investors who established positions several weeks ago and are sitting on substantial gains may want to consider whether their original investment thesis remains intact and whether some degree of profit protection or position management is warranted.
TSX Market Internals
The underlying market statistics provide a more nuanced picture than Friday’s headline index decline.
Declining issues substantially outnumbered advancing issues, with 1,313 decliners versus 822 advancers, producing a decliner-to-advancer ratio of approximately 1.6-to-1. Another 135 issues were unchanged. This confirms that Friday’s weakness was broad across individual stocks rather than being concentrated in only a handful of large-cap names.
However, the 52-week high/low statistics remained relatively constructive. The TSX recorded 67 new 52-week highs compared with 31 new 52-week lows, versus 54 new highs and 25 new lows on Thursday.
Although both new highs and new lows increased, the number of new highs remained more than twice the number of new lows. This is an important distinction for investors: daily breadth was negative, but the new-high/new-low balance did not indicate a major deterioration in the broader market’s underlying condition.
The TSX also remains well above its 25-day, 50-day and 200-day moving averages, supporting the view that the broader technical trend remains positive despite Friday’s pullback.
.
Key Takeaways for Traders and Investors
- Friday’s decline was a clear short-term setback, but not necessarily a trend reversal. The TSX remains above its key moving averages, keeping the broader technical trend constructive.
- Market breadth weakened significantly. The 1.6-to-1 decliner-to-advancer ratio shows that selling was broad-based and is something traders should monitor if weakness continues into next week.
- The new-high/new-low balance remains encouraging. With 67 new highs versus 31 new lows, the market continues to show underlying strength despite the negative daily breadth.
- Materials and gold stocks deserve close attention. The combination of higher interest-rate expectations and recent gains in precious-metals stocks could lead to additional profit-taking if gold prices and mining equities remain under pressure.
- Energy traders should watch crude oil and Middle East developments. A sustained decline in oil prices could continue to weigh on TSX energy stocks, while renewed geopolitical tension could quickly reverse that pressure.
- Traders should distinguish between sector rotation and a broad market breakdown. Friday’s weakness was significant, but the current market internals do not yet confirm a broad deterioration in the longer-term uptrend.
- Investors sitting on substantial gains should focus on risk management rather than trying to predict the exact market top. Reviewing position size, stop levels and individual stock fundamentals may be more appropriate than making an all-or-nothing decision based on a single weak session.
Bottom Line
Friday was a poor trading session for the TSX, characterized by broad-based selling, weakness in Materials and Energy, and significant declines among several mining and resource stocks. Nevertheless, the broader market picture remains cautiously constructive. The TSX continues to trade above its major moving averages, while the favourable new-high/new-low balance suggests that underlying market strength has not yet been seriously compromised.
For traders, the key question heading into the next sessions is whether Friday’s decline develops into follow-through selling or proves to be a normal consolidation after the index’s five-session advance. The behaviour of market breadth, commodity prices, and the Materials and Energy sectors should provide important clues
.
The US Markets
Friday’s U.S. Market Indexes
U.S. equity indexes finished lower on Friday, with small-cap stocks bearing the brunt of the selling pressure.
The Dow Jones Industrial Average slipped 9.45 points, or 0.02%, to close at 53,559.99. The S&P 500 declined 19.23 points, or 0.25%, to 7,711.76, while the Nasdaq Composite fell 138.93 points, or 0.52%, to 26,402.42. The Russell 2000 was the notable laggard, dropping 41.97 points, or 1.39%, to 2,972.37.

The relatively small decline in the Dow indicates that large-cap stocks showed considerably more resilience than the broader market. By contrast, the Russell 2000 suffered a significantly sharper decline and was the only major index to lose more than 1% on Friday.
The pronounced weakness in small-cap stocks is noteworthy because smaller companies tend to be more sensitive to interest-rate expectations and borrowing costs. The Federal Reserve Chair’s hawkish tone therefore appeared to weigh disproportionately on smaller-cap equities as investors reassessed the interest-rate outlook.
The session also highlighted an important divergence in market leadership. While the Dow remained essentially flat, technology and growth stocks represented by the Nasdaq experienced greater selling pressure. The Russell 2000, however, was hit hardest, suggesting that rate-sensitive areas of the market remain particularly vulnerable when monetary-policy expectations shift.
U.S. Market Technical Picture
Despite Friday’s weakness, the broader technical structure of the U.S. equity market remains constructive.
The S&P 500 and Nasdaq Composite remain clearly above their 25-day, 50-day and 200-day moving averages, indicating that their short-, medium- and long-term trends remain positive. Friday’s declines therefore have not, by themselves, changed the broader technical picture.
The Russell 2000 presents a somewhat different picture. Following Friday’s sharp decline, the index slipped slightly below its 25-day moving average, a development short-term traders should monitor. However, the index remains well above its 50-day and 200-day moving averages, meaning its medium- and long-term technical structure remains intact.
For traders, the Russell 2000 is particularly important to watch in the coming sessions. A recovery back above the 25-day moving average would suggest that Friday’s selloff may have been a short-term setback. Continued weakness, particularly if accompanied by a break below the 50-day moving average, would provide a more significant warning about deteriorating small-cap momentum.
Key Takeaway for Traders and Investors
Friday’s trading action points to interest-rate sensitivity as an important theme for the U.S. market. Large-cap stocks demonstrated relative resilience, while small-cap stocks experienced substantially heavier selling.
For investors, the major indexes remain technically healthy because the S&P 500 and Nasdaq continue to trade above their key moving averages. For traders, however, the weakness in the Russell 2000 deserves close attention. Small-cap performance can provide an early indication of changing investor risk appetite, particularly when interest-rate expectations are shifting.
The key question for the next several sessions is whether Friday’s weakness remains concentrated in rate-sensitive small-cap stocks or begins to spread more broadly across the major indexes. A stabilization in the Russell 2000, combined with continued strength above the major moving averages in the S&P 500 and Nasdaq, would support the view that Friday’s decline was primarily a short-term risk-off move rather than the beginning of a broader market reversal.
.
Friday’s U.S. Market Statistics
New York Stock Exchange (NYSE): NYSE market breadth was clearly negative on Friday, with declining issues substantially outnumbering advancing issues. There were 2,880 decliners, 1,625 advancers and 544 unchanged issues, producing a decliner-to-advancer ratio of approximately 1.77-to-1—roughly two declining stocks for every advancing stock.
The NYSE recorded 167 new 52-week highs and 107 new 52-week lows, compared with 192 new highs and 82 new lows on Thursday. Although both new highs and new lows declined from Thursday, new highs continued to significantly outnumber new lows. The resulting ratio was approximately 9 new highs for every 6 new lows, compared with roughly 5-to-2 on Thursday.
This is an important distinction for investors and traders. Daily breadth was negative, but the new-high/new-low balance remained favourable, suggesting that Friday’s weakness did not represent a broad deterioration in the longer-term market structure.
NYSE trading volume reached approximately 4.38 billion shares, down about 2% from Thursday’s 4.49 billion shares. The combination of a modest decline in trading volume and a lower market close does not, by itself, suggest an aggressive expansion of selling pressure.
Overall, the NYSE internals remain constructive despite the negative daily breadth. The continued presence of substantially more new 52-week highs than new lows is particularly encouraging and suggests that leadership remains present beneath the weaker headline index performance.
Nasdaq Market: The Nasdaq also experienced clearly negative market breadth on Friday. There were 3,409 declining issues versus 1,520 advancing issues, with 189 issues unchanged. This produced a decliner-to-advancer ratio of approximately 2.24-to-1, meaning that more than two stocks declined for every stock that advanced.
The Nasdaq recorded 127 new 52-week highs and 119 new 52-week lows, compared with 94 new highs and 106 new lows on Thursday. Both figures increased, but the increase in new highs was considerably stronger. The new-high/new-low ratio therefore remained close to 1-to-1, although the balance improved somewhat from Thursday as new highs moved ahead of new lows.
The Nasdaq’s intraday action was also noteworthy. The index opened slightly below Thursday’s close, rallied strongly during the morning, but subsequently surrendered those gains after the Federal Reserve Chair’s hawkish comments. The index then spent much of the afternoon trading roughly 100 points below the previous close.
For traders, this price action suggests that interest-rate expectations remain an important near-term driver of technology and growth stocks. The market initially demonstrated buying interest but was unable to sustain the advance once monetary-policy concerns returned to the forefront.
Nasdaq trading volume increased significantly, reaching approximately 8.77 billion shares, up about 14% from Thursday’s 7.68 billion shares. The combination of higher volume and a lower index close indicates that Friday’s selling attracted meaningful participation. Traders should therefore watch whether elevated volume continues if the Nasdaq remains under pressure in the next few sessions.
Sector and Market Leadership
Friday’s performance continued to show narrow market leadership, with a relatively small group of stocks exerting a disproportionate influence on the major indexes.
Semiconductor stocks remained under pressure, while Retail and Telecommunications Services were among the stronger areas of the market. Technology, Utilities and Basic Materials lagged.
The divergence between individual sectors reinforces the importance of looking beyond the headline index numbers. A market can remain technically strong while individual sectors and stocks experience significant rotation.
.
Key Takeaway for Traders and Investors
Friday’s U.S. market statistics present a mixed but not decisively bearish picture.
- Breadth was clearly negative on both the NYSE and Nasdaq, with declining stocks substantially outnumbering advancing stocks.
- NYSE internals remained relatively strong, with 167 new 52-week highs versus 107 new lows. The favourable high/low balance suggests that the broader NYSE structure has not deteriorated significantly.
- Nasdaq internals were less convincing, with 127 new highs versus 119 new lows. The near 1-to-1 ratio indicates a more balanced market beneath the index, despite the sharp negative daily breadth.
- Nasdaq volume increased 14% while the index declined, making volume an important metric to monitor. Continued high-volume selling would be a more significant warning than Friday’s price decline alone.
- Interest-rate expectations remain a major market catalyst. The Nasdaq’s inability to hold its intraday gains following the Fed Chair’s hawkish comments demonstrates the sensitivity of growth and technology stocks to changes in monetary-policy expectations.
- Market leadership remains narrow. Semiconductor weakness and continued concentration in a relatively small group of influential stocks suggest that traders should pay close attention to sector rotation rather than relying solely on the headline index.
- The broader technical picture remains constructive, particularly because the major indexes finished the week with gains and remain above their key moving averages.
Bottom Line
Friday produced negative daily breadth across both major U.S. exchanges, but the market internals do not yet point to a broad-based breakdown. The NYSE continues to show a favourable new-high/new-low balance, while the Nasdaq is closer to neutral.
For traders, the most important signals to watch next are market breadth, Nasdaq trading volume, semiconductor performance, and the reaction of growth stocks to further changes in interest-rate expectations. If declining breadth persists while new lows begin to substantially outnumber new highs, the market’s technical outlook would become less favourable. Conversely, a recovery in breadth and continued strength in the new-high/new-low data would support the view that Friday’s weakness was primarily a short-term pullback within the broader uptrend
.
Friday’s U.S. Market Wrap-Up Report
Friday’s session was dominated by the Federal Reserve Chair’s remarks at the conclusion of the annual Jackson Hole Economic Conference, which quickly became the market’s primary catalyst. Investors interpreted the comments as relatively hawkish, prompting a reassessment of the interest-rate outlook and putting pressure on several rate-sensitive areas of the market.
The major U.S. indexes finished lower, although the magnitude of the declines varied considerably. The Dow Jones Industrial Average slipped just 0.02%, the S&P 500 declined 0.25%, and the Nasdaq Composite fell 0.52%. The Russell 2000, however, was hit substantially harder, dropping 1.39%. The relative weakness of small-cap stocks was notable because smaller companies tend to be more sensitive to borrowing costs and changes in interest-rate expectations.
Market breadth was also clearly negative. On the NYSE, 2,880 stocks declined compared with 1,625 advancers, producing a decliner-to-advancer ratio of approximately 1.77-to-1. Nasdaq breadth was even weaker, with 3,409 decliners versus 1,520 advancers, or approximately 2.24 declining stocks for every advancing stock. Most stocks therefore finished lower despite the relatively modest declines in the major large-cap indexes.
Fed Comments Trigger Sector Rotation
Technology stocks, which had been among the market leaders on Thursday, came under pressure on Friday as investors reassessed the implications of the Fed Chair’s comments. Semiconductor stocks were particularly weak, highlighting the sensitivity of high-growth and technology companies to interest-rate expectations.
The weakness was not uniform across the technology sector, however. Several mega-cap technology companies demonstrated considerable resilience. Microsoft (MSFT) gained 1.68% to $513.53 on 29.2 million shares, while Meta Platforms (META) advanced 1.21% to $578.02 on approximately 16 million shares.
This divergence is important for traders. It suggests that investors were not indiscriminately selling technology stocks; rather, there was significant rotation within the sector, with some large-cap names attracting buying interest while more rate-sensitive and semiconductor-related stocks experienced heavier selling.
Sector Performance
Friday’s sector performance further demonstrated the market’s rotation away from some of the areas that had led the previous session.
Only five of the eleven major sectors finished higher, confirming that the market’s performance was not broad-based.
Consumer Discretionary was the strongest-performing sector, gaining 1.23%, followed by Telecommunications Services, up 1.22%. Consumer Durables and Services gained 0.53%, while Financials and Energy advanced 0.18% and 0.16%, respectively.
On the downside, Basic Materials was the session’s weakest sector, falling 1.55%, while Utilities declined 1.53% and Technology fell 0.83%.
The sharp decline in Basic Materials was consistent with the weakness seen in precious and industrial metals stocks following the Fed Chair’s comments. These stocks remained under pressure after the speech rather than recovering into the close, indicating that investors were willing to maintain their defensive positioning.
Semiconductor Stocks Take a Hit
Semiconductor stocks were among Friday’s most closely watched areas.
Nvidia (NVDA) dropped 4.58% to $217.55, with approximately 195.1 million shares traded, making it one of the session’s most actively traded stocks. Intel (INTC) declined 2.85% to $89.47 on approximately 86.2 million shares.
Micron Technology (MU) was comparatively resilient, slipping only 0.27% to $932.86 on 22.9 million shares. SanDisk (SNDK) essentially finished flat, gaining just 0.03% to $1,484.98 on approximately 8.1 million shares.
The contrast between these stocks demonstrates that semiconductor weakness was significant but not entirely uniform. Traders should watch whether Friday’s selling develops into continued sector-wide weakness or whether buyers return to the group following the initial reaction to the Fed comments.
Energy Stocks Show Relative Strength
Energy stocks provided a notable counterpoint to the weakness in Materials and Technology.
While crude oil prices slipped modestly, several downstream energy companies advanced. Marathon Petroleum (MPC) gained 1.45% to $368.81 on approximately 1.9 million shares, while Phillips 66 (PSX) rose 1.85% to $244.24 on approximately 1.7 million shares. Chevron (CVX) also gained 1.05% to $201.87, with approximately 5.3 million shares traded.
The relative strength of these companies indicates that lower crude prices did not translate into uniform weakness across the energy complex. Traders should therefore distinguish between different segments of the energy industry rather than treating the sector as a single trade.
Financial Stocks Mixed
Financial stocks were mixed, although the sector as a whole managed to finish slightly higher.
JPMorgan Chase (JPM) gained 0.92% on approximately 3.9 million shares, while Goldman Sachs (GS) declined 0.66% on approximately 1.1 million shares.
The divergence among major financial stocks reinforces the broader theme of Friday’s session: sector-level performance did not necessarily reflect individual-stock performance. Stock selection and relative strength were particularly important in a market characterized by significant rotation.
Optoelectronics and Network Infrastructure Stocks Under Pressure
Stocks in the optoelectronics and network infrastructure space were among the weaker individual names.
Lumentum Holdings (LITE) fell 6.39% on approximately 3.4 million shares, while Applied Optoelectronics (AAOI) declined 6.22% to $106.23, with approximately 5.7 million shares traded.
The weakness in this group, combined with the declines in several semiconductor names, suggests that investors were reducing exposure to portions of the technology and high-growth ecosystem that remain particularly sensitive to changes in interest-rate expectations.
U.S. Market Internals
Despite the negative headline performance, the market internals provide a more nuanced picture.
On the NYSE, there were 167 new 52-week highs versus 107 new 52-week lows. Although the number of new highs declined from Thursday, new highs continued to outnumber new lows by a meaningful margin.
On the Nasdaq, there were 127 new 52-week highs and 119 new 52-week lows. The near 1-to-1 ratio indicates that Nasdaq participation was considerably less healthy beneath the surface than the NYSE.
Trading volume also provides an important signal. NYSE volume reached approximately 4.38 billion shares, down about 2% from Thursday. Nasdaq volume, however, increased approximately 14% to 8.77 billion shares.
The combination of negative Nasdaq breadth, higher trading volume and a lower index close is worth monitoring. If elevated selling volume continues in subsequent sessions, it could indicate that Friday’s decline was more than a one-day reaction to the Fed Chair’s comments.
At the same time, the broader technical structure remains relatively constructive. The S&P 500 and Nasdaq remain above their 25-day, 50-day and 200-day moving averages. The Russell 2000 slipped slightly below its 25-day moving average on Friday but remains above its 50-day and 200-day averages.
Key Takeaways for Traders and Investors
- The Fed remains a major market catalyst. Friday demonstrated how quickly changes in interest-rate expectations can trigger sector rotation and alter market leadership.
- Small caps are particularly vulnerable to rate concerns. The 1.39% decline in the Russell 2000 was significantly larger than the losses in the major large-cap indexes.
- Technology leadership is becoming more selective. Several mega-cap technology stocks remained strong even as semiconductors and other technology-related names declined sharply.
- Market breadth warrants attention. Decliners substantially outnumbered advancers on both the NYSE and Nasdaq, indicating that Friday’s weakness extended well beyond the headline indexes.
- NYSE internals remain more constructive than Nasdaq internals. New 52-week highs continued to outnumber new lows on the NYSE, while the Nasdaq’s high/low balance was nearly even.
- Nasdaq volume is an important warning signal to watch. A 14% increase in volume alongside a lower index close suggests meaningful participation in Friday’s selling.
- Friday’s sector rotation was significant. Consumer Discretionary and Telecommunications Services performed well, while Basic Materials, Utilities and Technology lagged.
- Traders should avoid treating the entire market as one trade. Friday produced substantial differences among sectors and individual stocks, making relative strength and stock selection particularly important.
Bottom Line
Friday was a risk-off session driven largely by changing interest-rate expectations following the Fed Chair’s Jackson Hole remarks. The most pronounced selling occurred in small-cap, semiconductor, precious-metals and other rate-sensitive areas, while selected large-cap technology, consumer and energy stocks demonstrated relative strength.
The market’s underlying structure has not yet broken down, with the S&P 500 and Nasdaq remaining above their key moving averages and the NYSE continuing to show more new highs than new lows. However, the combination of negative breadth, elevated Nasdaq volume and pronounced weakness in small-cap and semiconductor stocks warrants close attention.
For the next several trading sessions, the key question is whether Friday’s selling proves to be a short-term reaction to the Fed’s hawkish tone or the beginning of a broader rotation away from risk-sensitive assets. Traders should pay particular attention to Nasdaq volume, semiconductor performance, the Russell 2000’s position relative to its 25-day moving average, and whether market breadth begins to improve.
.
NOTICE TO READERS
The Canadian Vanguard Stock Market is about empowering you to build and manage your wealth by yourself. There is certainly no magic in managing finances or wealth but one needs to know what to do and commit to doing what is needed. When you are ready to start the journey to Take Charge and Put Your Destiny In Your Own Hands, start with reading The Canadian Vanguard every market day. If and when you need more related information or to advertise your business products or services in The Canadian Vanguard, Contact Us
Our readers are strongly advised to conduct their own research into individual stocks before making a purchase decision. In addition, investors are advised that past stock performance is no guarantee of future price appreciation. Any recommendation is not a guarantee of any particular stock’s future prices, and The Canadian Vanguard accepts no responsibility or liability for investors’ or readers’ purchases.
Stocks In The News/ Stocks To Watch and Market Strategy will soon be available only to Paying Subscribers. The dollar sign “$” in the Toronto Market section in the articles only stands for Canadian dollar and in the US market section “$” stands for US dollar.
(c) This article is published by The Canadian Vanguard on August 29, 2026