




Major Indexes Edge Lower Ahead of Key CPI Report Amid Earnings Deluge
The Canadian Vanguard Stock Market Report – Tuesday October 13, 2026 Edition
.
The Toronto Market
Tuesday’s Toronto Market Index
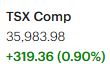
The S&P/TSX Composite Index rallied 319.36 points, or 0.90%, to close at 35,983.98 on Tuesday.

The TSX has now advanced for three consecutive sessions, recovering steadily from last Wednesday’s brutal market sell-off. The Toronto market has also shown greater stability, with volatility easing over the past couple of sessions.
However, several factors could challenge this improving sentiment. The U.S. September Consumer Price Index (CPI) report is scheduled for release late Wednesday morning. Depending on the inflation figures, the report could trigger significant market movements as investors reassess the outlook for interest rates.
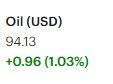
Meanwhile, geopolitical tensions in the Middle East remain a concern. Recent market patterns suggest that disruptions to oil shipments can drive crude prices higher, increasing uncertainty and triggering renewed volatility across financial markets.
U.S. Treasury yields have also been less disruptive over the past couple of days, providing some relief to equity markets. Nevertheless, traders should remain cautious while these uncertainties persist.
Our advice: Traders should consider taking profits more quickly than usual while the Middle East conflict remains unresolved. Securing even modest gains may be preferable to allowing profitable positions to turn into losses as market conditions change.
From a technical perspective, the TSX Composite Index is trading comfortably above both its 25-day and 50-day moving averages, indicating improving short-term momentum. The index is also trading well above its 200-day moving average, reinforcing the broader bullish trend.
Although the recent recovery is encouraging, traders should remain alert to incoming inflation data and geopolitical developments that could quickly alter market sentiment.
Tuesday’s TSX Market Statistics
Market breadth on the Toronto Stock Exchange (TSX) turned slightly bearish on Tuesday, as declining issues outnumbered advancing issues. Specifically, there were 1,218 decliners and 1,044 advancers, producing a decliner-to-advancer ratio of 1.16:1, or approximately six decliners for every five advancers. Another 126 issues remained unchanged.
This represents a reversal from Monday’s very bullish market breadth. However, the imbalance between decliners and advancers was relatively modest, suggesting that selling pressure was not particularly strong. Although market breadth turned negative, the statistics do not indicate an overwhelming bearish shift.
The exchange recorded 96 new 52-week highs and 68 new 52-week lows, compared with 81 new highs and 53 new lows on Monday.
The number of new 52-week highs increased by approximately 18% from the previous session, while new 52-week lows rose by approximately 28%. Despite the faster increase in new lows, new highs continued to outnumber new lows by a ratio of approximately 7:5, compared with roughly 3:2 on Monday.
These figures suggest that the internal strength of the market improved slightly in terms of the balance between new highs and new lows, although the overall picture remains mixed. The market appears to be attempting to reverse the recent deterioration in its internal indicators and return to a pattern in which new 52-week highs consistently outnumber new lows. However, it is too early to determine whether this improvement will develop into a sustained trend.
Trading activity also increased significantly. Total TSX volume reached 487,599,072 shares, approximately 12% higher than Monday’s volume of 435,592,300 shares. The increase in trading volume indicates greater market participation, although volume alone does not establish whether buying or selling pressure is dominant.
Market outlook: The TSX’s underlying conditions are showing tentative signs of improvement, but the market internals remain mixed and somewhat weakened. The modestly negative market breadth and the increase in new 52-week lows warrant continued caution. Investors should monitor the coming sessions to determine whether the recent improvement in new highs and broader market conditions can be sustained.
Tuesday’s Toronto Stock Market Wrap-Up Report
TSX Rebounds as Telecom, Energy, Technology and Bank Stocks Rally
Market Overview
The Toronto stock market delivered a strong rebound on Tuesday, with the S&P/TSX Composite Index advancing 319.36 points, or 0.90%, to close at 35,983.98. The index has now gained for three consecutive sessions, recovering steadily from last Wednesday’s sharp market sell-off.
Eight of the ten major sectors finished higher, reflecting broad participation in Tuesday’s rally. Telecommunications led the market with a gain of 3.14%, followed by Energy, up 3.11%, and Technology, which advanced 2.75%. Consumer-related stocks also performed well, with Durable Consumer Goods & Services gaining 1.46%, while Financials rose 1.22%.
Despite the strong advance in the headline index, underlying market breadth was slightly negative, as declining issues outnumbered advancing issues. This divergence suggests that Tuesday’s rally was not uniformly supported across the broader market.
Sector and Stock Highlights
Telecommunications led the rally. The sector gained 3.14%, making it Tuesday’s top-performing sector. Energy followed closely with a 3.11% advance, while Technology climbed 2.75%. The strength in these sectors helped drive the broader market higher.
Financial stocks delivered a solid performance. The Financials sector advanced 1.22%, supported by gains across all six of Canada’s largest banks. Toronto-Dominion Bank (TD) was the top performer among the Big Six, rising 2.22% on trading volume of approximately 11.5 million shares.
National Bank of Canada, Bank of Nova Scotia (BNS) and Canadian Imperial Bank of Commerce (CM) also posted strong gains, advancing 2.15%, 1.83% and 1.81%, respectively. The broad-based strength among the major banks was an encouraging development for the financial sector and helped reinforce Tuesday’s positive index performance.
Basic Materials and Healthcare were the weakest sectors. Basic Materials fell 1.92%, making it Tuesday’s worst-performing sector, while Healthcare declined 0.99%.
Weakness in gold-related stocks contributed to the pressure on the materials sector. Agnico Eagle Mines Ltd. (AEM) dropped 2.15%, with approximately 652,600 shares traded. Franco-Nevada Corp. also declined, losing 0.88% on trading volume of approximately 252,200 shares.
Gold-price movements can influence gold-mining and royalty stocks, although individual share prices may also respond to company-specific developments, operating costs and broader market conditions.
Market Breadth and Trading Activity
Despite the TSX’s 0.90% advance, market internals painted a more mixed picture.
Declining issues totalled 1,218, compared with 1,044 advancing issues, producing a decliner-to-advancer ratio of approximately 1.16:1. In other words, there were roughly six declining stocks for every five advancing stocks. Another 126 issues were unchanged.
This represented a reversal from Monday’s strongly positive market breadth. However, the relatively modest imbalance between decliners and advancers suggests that the deterioration was limited rather than indicative of overwhelming selling pressure.
The new-high/new-low figures offered a somewhat more encouraging signal. The TSX recorded 96 new 52-week highs and 68 new 52-week lows, compared with 81 new highs and 53 new lows on Monday. New highs therefore continued to outnumber new lows, although both figures increased.
The rise in new 52-week highs suggests that some stocks are continuing to demonstrate strength, but the faster increase in new lows indicates that weakness remains present beneath the surface. Traders should monitor these indicators over the coming sessions to determine whether market breadth begins to improve alongside the headline index.
Trading activity also increased. Total TSX volume reached approximately 487.6 million shares, up 12% from Monday’s 435.6 million shares. Higher volume accompanied the index advance, but the negative breadth reading suggests that the rally did not translate into gains for the majority of listed issues.
Technical Outlook
The S&P/TSX Composite Index is now trading comfortably above its 25-day and 50-day moving averages, while also maintaining a substantial gap above its 200-day moving average.
This positioning supports a constructive technical outlook. The three-session recovery suggests that buyers have regained some control following last week’s sell-off, while the index’s position above its major moving averages indicates that the broader upward trend remains intact.
Nevertheless, the combination of rising index prices and slightly negative market breadth calls for caution. A sustained recovery would be more convincing if advancing issues began to outnumber declining issues consistently and more stocks participated in the upward move.
Investors should also remain mindful of external risks, particularly the upcoming U.S. September Consumer Price Index (CPI) report and continuing geopolitical tensions in the Middle East. Inflation data can influence expectations for interest rates, while disruptions to oil shipments can push energy prices higher and trigger renewed volatility across financial markets. U.S. Treasury yields have been less disruptive in recent sessions, but that could change as new economic data emerge.
Key Takeaways for Traders and Investors
1. The short-term market trend remains positive.
The TSX has gained for three consecutive sessions and is trading above its 25-day, 50-day and 200-day moving averages. This supports a bullish technical bias, although it does not guarantee that the recovery will continue.
2. Watch market breadth before assuming the rally is broad-based.
Decliners outnumbered advancers on Tuesday despite the index’s strong gain. Traders should look for sustained improvement in advancing-versus-declining issues and the new-high/new-low balance to confirm that market participation is strengthening.
3. Bank stocks provided an encouraging signal.
All six major Canadian banks advanced, with TD leading the group. Continued strength in bank stocks could help support the Financials sector and the broader TSX, although traders should also consider valuation, earnings expectations and interest-rate sensitivity.
4. Be selective with sector exposure.
Telecommunications, Energy and Technology led Tuesday’s advance, while Basic Materials and Healthcare lagged. Traders may wish to monitor relative sector strength rather than assume that every sector will participate equally in the recovery. Gold-related stocks, in particular, warrant attention to movements in bullion prices and company-specific factors.
5. Protect profits amid event-driven risks.
The upcoming U.S. CPI release and persistent Middle East tensions could quickly change market sentiment. Traders may wish to tighten risk controls, manage position sizes carefully and consider taking partial profits when appropriate. Securing modest gains can be preferable to allowing a profitable position to deteriorate during a sudden reversal.
Final Market Assessment
Tuesday’s session was encouraging for the Toronto stock market. The TSX extended its recovery for a third consecutive session, eight of ten major sectors advanced, and all six major Canadian banks finished higher. The index’s position above its key moving averages also supports a constructive technical outlook.
However, the slightly negative market breadth and the increase in both new 52-week highs and new lows indicate that the market’s internal condition remains mixed. The next stage of the recovery will depend on whether broader participation improves and whether external developments allow investors to maintain their appetite for risk.
Our outlook is cautiously optimistic. The TSX’s upward momentum remains intact, but traders and investors should avoid becoming complacent. Confirmation from market breadth, continued sector participation and the market’s reaction to upcoming economic and geopolitical developments will be important in determining whether the current rebound can develop into a more durable advance.
.
The US Markets
Tuesday’s U.S. Market Indexes
Wall Street Closes Lower as Major Indexes Show Limited Movement
Market Overview
All four major U.S. stock market indexes finished in negative territory on Tuesday, although losses were generally modest. The Dow Jones Industrial Average fell 180.45 points, or 0.35%, to close at 51,670.10. The S&P 500 slipped 1.79 points, or 0.02%, to finish at 7,805.45, narrowly missing a positive close for the second consecutive session.

The Nasdaq Composite declined 41.52 points, or 0.15%, to close at 27,204.38, while the Russell 2000 dropped 11.11 points, or 0.40%, to finish at 2,783.37.
The Dow Jones and Russell 2000 were the weakest performers of the four major indexes, while the S&P 500 came close to ending the session unchanged.
Market Stability and Volatility
Tuesday’s market performance closely resembled Monday’s session, with limited movement across the major indexes and little change in the overall market picture. The S&P 500’s near-flat performance was particularly notable, as it almost finished in positive territory for the second consecutive day.
The subdued movements suggest that the market has entered a period of relative stability, with less pronounced day-to-day price fluctuations. This calmer environment can be welcome for traders, as it may provide more orderly trading conditions and make risk management easier.
However, relatively small daily changes do not necessarily mean that volatility will remain low. Investors should continue to monitor economic data, interest-rate expectations, corporate developments and geopolitical risks for potential catalysts that could trigger a more decisive market move.
Technology and Semiconductor Stocks Remain Under Pressure
Technology and semiconductor stocks continued to weigh on the Nasdaq Composite, contributing to its modest decline. Weakness in these influential stocks can have an outsized effect on the technology-heavy index, even when the broader market experiences relatively limited movement.
For traders, the key question is whether the pressure on technology and semiconductor shares will persist or begin to ease. A recovery in these groups could help improve Nasdaq performance, while continued weakness could constrain the index despite strength elsewhere in the market.
Technical Outlook: Major Indexes Show Diverging Signals
The technical picture across the four major indexes remains mixed, with the Nasdaq and S&P 500 maintaining stronger positions relative to their key moving averages while the Dow Jones and Russell 2000 show signs of weakening.
S&P 500 — Near-term stability, broader uptrend intact
The S&P 500 remains comfortably above its 25-day, 50-day and 200-day moving averages. Despite two consecutive sessions of almost no net movement, its position above these key technical indicators continues to support a constructive broader trend.
The index’s ability to hold above these averages is encouraging, although traders should watch for a decisive move that could provide a clearer indication of its next direction.
Nasdaq Composite — Longer-term technical position remains strong
The Nasdaq Composite also remains clearly above its 25-day, 50-day and 200-day moving averages. However, continued weakness in technology and semiconductor stocks is limiting its near-term performance.
The index’s technical position remains favourable, but traders should monitor whether selling pressure in these influential sectors begins to undermine its upward momentum.
Dow Jones Industrial Average — Short-term technical conditions soften
The Dow Jones weakened slightly from a technical perspective on Tuesday. The index is trading below its 50-day moving average but remains slightly above its 25-day moving average and comfortably above its 200-day moving average.
This configuration suggests that the index’s intermediate-term momentum has weakened, even though its longer-term technical position remains more constructive. Traders should watch whether the Dow can regain its 50-day moving average or whether further weakness develops.
Russell 2000 — A critical technical level comes into focus
The Russell 2000 was Tuesday’s weakest performer, falling 0.40%. More importantly, the index moved below both its 25-day and 50-day moving averages and is now touching its 200-day moving average.
This development deserves particular attention. In Monday’s report, we noted that the gap between the Russell 2000 and its 200-day moving average had narrowed. That gap has now effectively disappeared.
The 200-day moving average is an important long-term technical reference point. If the Russell 2000 holds around this level and rebounds, it could signal that buyers are defending an important area of support. However, a sustained break below the average could indicate further deterioration in small-cap momentum.
Traders should monitor the index closely for confirmation rather than assume that the 200-day moving average will necessarily hold.
Key Takeaways for Traders and Investors
1. Relative market stability is welcome, but direction remains uncertain.
The modest daily changes across all four major indexes suggest a pause in decisive market movement. Traders should avoid interpreting low day-to-day movement as a guarantee that the market is free of risk.
2. The S&P 500 and Nasdaq retain stronger technical positions.
Both indexes remain above their 25-day, 50-day and 200-day moving averages. This supports a constructive broader technical outlook, although continued weakness in technology and semiconductor stocks warrants attention.
3. The Russell 2000 is the key index to watch.
Its move below the 25-day and 50-day moving averages, combined with its approach to the 200-day average, represents a deterioration in its technical position. A sustained break below the 200-day average would be a warning sign; a rebound could help stabilize the small-cap outlook.
4. The Dow Jones is showing signs of intermediate-term weakness.
Trading below its 50-day moving average suggests that the index has lost some momentum. Its ability to recover that level could help clarify whether the recent softness is temporary or part of a more sustained pullback.
5. Maintain disciplined risk management.
With the indexes showing different technical patterns, traders should avoid assuming that all segments of the U.S. market are equally strong. Position sizing, stop-loss discipline and attention to important moving averages remain useful tools for managing exposure.
Final Market Assessment
Tuesday’s U.S. market session was characterized by modest losses, limited index movement and mixed technical signals. The S&P 500 and Nasdaq Composite continue to hold above their key moving averages, while the Dow Jones has weakened relative to its 50-day average. The Russell 2000 is at a more critical juncture, having fallen below its shorter-term moving averages and reached its 200-day average.
Our outlook is cautiously neutral in the short term. The recent stability is encouraging, but the market has yet to establish a clear new direction. The S&P 500’s resilience is a positive sign, while the Russell 2000’s test of its 200-day moving average deserves close monitoring. Traders and investors should remain selective and wait for clearer confirmation before assuming that the next significant move will be upward or downward.
Tuesday’s U.S. Market Statistics
NYSE Shows Tentative Improvement, While NASDAQ Market Internals Deteriorate
1. New York Stock Exchange (NYSE): Market breadth was positive, but the underlying market internals remained weak.
Advancing issues outnumbered declining issues on the New York Stock Exchange (NYSE) on Tuesday. There were 2,431 advancers, 2,091 decliners and 479 unchanged issues, producing an advancer-to-decliner ratio of approximately 1.16:1, or roughly six advancers for every five decliners.
Although the advance-decline figures indicate positive market breadth, the relatively modest margin between advancers and decliners suggests that buying participation was not particularly strong. More importantly, the new-high/new-low statistics continue to reveal considerable underlying weakness.
The NYSE recorded 158 new 52-week highs and 319 new 52-week lows, compared with 149 new highs and 272 new lows on Monday. The number of new highs increased by approximately 6%, while new lows rose by about 17%.
Consequently, new 52-week lows outnumbered new highs by approximately two to one. Although this remains a negative reading, the ratio of new highs to new lows was the most favourable in several weeks, based on the recent pattern described in our previous reports. The improvement suggests that the imbalance between stocks reaching new highs and those falling to new lows may be narrowing.
Nevertheless, the increase in new lows indicates that weakness remains widespread. The latest figures provide a tentative sign of improvement, but several more sessions of data will be needed to determine whether this represents a sustained recovery in market internals.
Trading volume increased substantially. Total NYSE volume reached approximately 4.99 billion shares, up 17.6% from Monday’s 4.24 billion shares.
The combination of positive advance-decline breadth and higher trading volume is encouraging at first glance. However, the continued dominance of new 52-week lows over new highs tempers that optimism. Higher volume alone does not establish whether buying or selling pressure is prevailing across the broader market.
NYSE assessment: Market breadth improved, and the new-high/new-low relationship showed a tentative positive development. However, the broader internal indicators remain weakened. Traders should look for a sustained reduction in new lows and a more decisive improvement in the balance between advancing and declining stocks before concluding that market conditions are recovering.
2. NASDAQ: Market breadth deteriorated, while new 52-week lows continued to dominate.
The NASDAQ presented a considerably weaker picture on Tuesday. Declining issues totalled 3,031, compared with 1,893 advancing issues, while 392 issues remained unchanged.
This produced a decliner-to-advancer ratio of approximately 1.60:1, meaning that there were roughly three declining stocks for every two advancing stocks. The negative breadth reading indicates that selling pressure extended well beyond a handful of individual companies.
The new-high/new-low figures were even more concerning. The exchange recorded just 77 new 52-week highs and 511 new 52-week lows, compared with 88 new highs and 398 new lows on Monday.
The number of new 52-week highs fell by approximately 12.5%, while new lows increased by approximately 28.4%. The resulting ratio was roughly one new high for every 6.6 new lows, underscoring the extent of the weakness beneath the headline index.
This deterioration suggests that the NASDAQ’s internal condition remains fragile. Although the index’s longer-term technical position may still be constructive, the large imbalance between new highs and new lows indicates that a substantial number of individual stocks continue to struggle.
Technology and semiconductor stocks have been weighing on the NASDAQ Composite, and the weak breadth figures reinforce the need for caution when evaluating the strength of the technology-heavy market.
Trading volume also increased. Total NASDAQ volume reached approximately 7.24 billion shares, up 9.8% from Monday’s 6.60 billion shares.
The combination of negative market breadth, a sharp increase in new 52-week lows and higher trading volume points to continued weakness in NASDAQ market internals. Although higher volume does not independently confirm aggressive selling, the accompanying breadth statistics suggest that Tuesday’s session did little to improve the market’s underlying condition.
NASDAQ assessment: Market internals weakened further on Tuesday. Decliners significantly outnumbered advancers, new 52-week lows increased sharply, and new highs declined. A sustained improvement in these indicators will be necessary before a more constructive outlook for the NASDAQ can be justified.
.
3. Key Takeaways for Traders and Investors
1. The NYSE is showing tentative signs of improvement, but confirmation is still needed.
Positive advance-decline breadth and a more favourable new-high/new-low ratio provide some encouragement. However, new lows still outnumber new highs by approximately two to one. Traders should watch for continued improvement rather than treating one session as confirmation of a recovery.
2. NASDAQ market internals remain a significant warning sign.
The 1.60:1 decliner-to-advancer ratio and the 77-to-511 balance between new highs and new lows indicate widespread weakness. Traders should be selective with technology and growth-stock exposure, particularly when individual stocks are trading below important technical support levels.
3. Distinguish index performance from the health of individual stocks.
A major index can remain relatively resilient even while many constituent stocks deteriorate. The number of new 52-week highs and lows can therefore provide useful information that is not immediately apparent from the headline index level.
4. Interpret higher volume alongside breadth.
Both exchanges experienced higher trading volume. On the NYSE, positive daily breadth offered a partial counterweight to weak new-high/new-low statistics. On the NASDAQ, negative breadth and a sharp increase in new lows made the overall picture more concerning. Volume should be interpreted in conjunction with price movement and market internals rather than in isolation.
5. Maintain disciplined risk management.
Given the continued weakness in market internals, traders should avoid assuming that a relatively stable index necessarily signals broad market strength. Appropriate position sizing, predefined exit levels and selective profit-taking can help manage risk if market conditions deteriorate.
Final Market Assessment
Tuesday’s U.S. market statistics presented two different pictures. The NYSE showed modestly positive market breadth and a tentative improvement in the relationship between new 52-week highs and lows. However, new lows continued to outnumber new highs by approximately two to one, indicating that the broader market remains vulnerable.
The NASDAQ’s internal indicators deteriorated further, with declining stocks outnumbering advancing stocks and new 52-week lows rising sharply. The increase in trading volume on both exchanges did not, by itself, establish a positive change in market direction.
Our overall assessment remains cautious. The NYSE may be showing early signs of stabilization, but the evidence is not yet strong enough to confirm a sustained recovery. The NASDAQ remains particularly weak beneath the surface. Traders and investors should monitor the next several sessions for improving breadth, a sustained reduction in new lows and stronger participation across individual stocks before adopting a more confident bullish stance.
.
Tuesday’s U.S. Market Wrap-Up Report
Wall Street Edges Lower as Investors Weigh Earnings, Sector Rotation and Market Weakness
Market Overview
The major U.S. stock market indexes finished in negative territory on Tuesday, although losses remained modest. The Dow Jones Industrial Average fell 180.45 points, or 0.35%, to close at 51,670.10. The S&P 500 slipped just 1.79 points, or 0.02%, to finish at 7,805.45, narrowly missing a positive close for the second consecutive session.
The Nasdaq Composite declined 41.52 points, or 0.15%, to close at 27,204.38, while the Russell 2000 lost 11.11 points, or 0.40%, to finish at 2,783.37.
Despite the broadly negative close, the relatively small percentage declines suggest that the major indexes experienced a subdued session rather than a sharp market sell-off. The S&P 500 was particularly resilient, ending almost unchanged.
However, the limited movement in the headline indexes should not be mistaken for broad market strength. Tuesday’s market statistics revealed continued weakness beneath the surface, particularly on the NASDAQ, where declining stocks significantly outnumbered advancing stocks and new 52-week lows continued to rise.
Sector Performance: Energy and Telecommunications Lead
Only five of the eleven major S&P 500 sectors finished higher on Tuesday, indicating that sector participation remained uneven.
Energy was the strongest-performing sector, advancing 1.69%. Telecommunications Services followed with a gain of 1.32%, while Utilities rose 0.58%. Technology edged higher by 0.14%, and Consumer Discretionary gained a marginal 0.04%.
On the downside, Healthcare was the session’s weakest sector, falling 1.46%. Financials declined 0.53%, while Basic Materials lost 0.41%.
The relative strength in Energy and Telecommunications Services helped limit the broader market’s losses. However, weakness in Healthcare and Financials weighed on overall performance.
The Energy sector’s advance came amid heightened attention to geopolitical risks and oil-market developments. Although energy stocks can benefit from rising crude prices, the relationship is not always straightforward, and movements in oil prices should be verified against the day’s actual trading data before attributing sector performance to them.
Company News: Apple Expands Its Smart-Home Ambitions
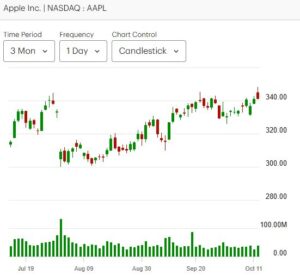
Apple Inc. (AAPL) announced a new range of smart-home products, including HomeView, the company’s first dedicated home hub. The device features a seven-inch display, a speaker and Siri AI capabilities, and is available in tabletop and wall-mounted versions.
Apple announced a starting price of US$299, with HomeView scheduled to become available on November 13. Additional products in the new lineup are expected to follow in December. The launch represents another attempt by Apple to expand its presence in the connected-home market, where it will compete with established offerings from Amazon and Google.
For investors, the announcement is worth watching as a potential expansion of Apple’s hardware and services ecosystem. However, the commercial significance of the new products will ultimately depend on consumer demand, adoption rates and their contribution to revenue and profitability.
Meta Platforms also attracted attention with its Muse artificial intelligence initiative, described in the draft as an AI assistant designed to help users complete practical tasks, including grocery shopping and travel bookings. Investors should distinguish early interest in AI products from evidence of meaningful monetization and financial returns.
Semiconductor Stocks Show Intraday Resilience
Semiconductor stocks initially came under pressure but several recovered from their session lows as trading progressed.
SanDisk Corp. (SNDK) opened sharply lower, reportedly falling by approximately 100 points in the early session, before recovering throughout the day to finish near Monday’s closing level. Micron Technology Inc. (MU) followed a similar pattern, opening weakly before recovering to close approximately unchanged. Semiconductor stocks have suffered declines in the last several sessions.
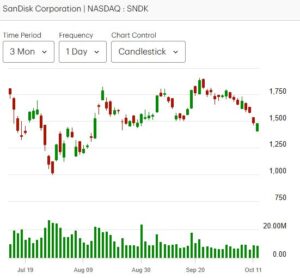
The recovery in these two stocks suggests that buyers were willing to step in after the initial selling pressure. However, a rebound from intraday lows does not necessarily signal that a sustained recovery has begun.
For traders, the important question is whether this resilience continues in subsequent sessions. Follow-through buying, improving trading volume and stronger performance across the semiconductor group would provide more convincing evidence of a recovery. Continued weakness in semiconductor stocks, by contrast, could remain a headwind for the NASDAQ Composite.
Bank Earnings: Mixed Results Set the Tone for the Season
Third-quarter earnings season moved into focus on Tuesday, with several major financial institutions reporting results.
Goldman Sachs (GS) delivered a particularly strong performance. The company reported third-quarter earnings per share of US$17.01 and revenue of US$18.68 billion, with both results reflecting substantial year-over-year growth. The stock reportedly advanced more than 3% following the results.
Citigroup (C) also delivered encouraging results, reporting its strongest third-quarter revenue performance in a decade, according to the supplied market commentary.
JPMorgan Chase (JPM) and Wells Fargo (WFC), meanwhile, delivered more mixed results. JPMorgan’s revenue increased, but earnings per share fell short of expectations. Wells Fargo reported higher profits but missed revenue estimates. These results highlight the importance of examining revenue, earnings, trading activity, credit quality and management guidance rather than relying on headline profit figures alone.
The mixed performance across the major banks suggests that investors are assessing not only the strength of financial-sector earnings but also the sustainability of revenue growth and the outlook for the broader economy.
Bank of America (BAC) and Morgan Stanley (MS), along with asset managers State Street (STT) and BlackRock (BLK), are scheduled to report on Wednesday, according to the supplied earnings calendar. Their results and management commentary will provide further insight into consumer and business conditions, investment-banking activity, asset flows and investor risk appetite.
Market Internals: A More Cautious Picture Beneath the Indexes
Tuesday’s market statistics revealed a divergence between the relatively stable performance of the major indexes and the weaker condition of many individual stocks.
NYSE: Advancing issues outnumbered declining issues, with 2,431 advancers against 2,091 decliners. This produced an advance-to-decline ratio of approximately 1.16:1, or six advancers for every five decliners.
However, new 52-week lows totalled 319, compared with 158 new highs. Although the relationship between new highs and new lows showed tentative improvement relative to recent sessions, the number of stocks reaching new lows remained approximately twice the number reaching new highs.
NASDAQ: Market breadth was considerably weaker. There were 3,031 declining issues and 1,893 advancing issues, producing a decliner-to-advancer ratio of approximately 1.60:1.
The exchange recorded just 77 new 52-week highs against 511 new lows. New lows increased by approximately 28% from Monday, while new highs declined by roughly 12.5%.
These figures indicate that weakness remained widespread among NASDAQ-listed stocks, despite the index’s relatively modest daily decline.
Trading volume increased on both exchanges. NYSE volume rose approximately 17.6% to 4.99 billion shares, while NASDAQ volume increased about 9.8% to 7.24 billion shares.
Higher volume accompanied a session of mixed internal signals. On the NYSE, positive advance-decline breadth provided some encouragement, although the new-high/new-low balance remained negative. On the NASDAQ, negative breadth, rising new lows and declining new highs presented a more concerning picture.
For traders and investors, the key lesson is that index performance alone does not fully describe market health. The continued deterioration in NASDAQ internals warrants caution, even while the headline indexes remain relatively stable.
Technical Outlook: The Russell 2000 Deserves Attention
The major indexes continue to display different technical characteristics.
The S&P 500 and Nasdaq Composite remain comfortably above their 25-day, 50-day and 200-day moving averages. Their broader technical trends therefore remain constructive, although weakness in individual stocks and sectors suggests that the recovery is not uniform.
The Dow Jones Industrial Average is trading below its 50-day moving average but remains slightly above its 25-day average and comfortably above its 200-day average. This configuration indicates some deterioration in intermediate-term momentum.
The Russell 2000 presents a more immediate concern. The small-cap index has fallen below both its 25-day and 50-day moving averages and is now testing its 200-day moving average.
The 200-day moving average is an important long-term technical reference point. If the Russell 2000 holds this level and rebounds, it could signal that buyers are defending an important area of support. A sustained break below it, however, could indicate further deterioration in small-cap stocks.
Traders should watch for confirmation rather than assume that the 200-day moving average will necessarily hold.
Key Takeaways for Traders and Investors
1. Do not confuse a quiet index session with a healthy market.
The major indexes experienced only modest losses, but the underlying market statistics remained weak, particularly on the NASDAQ. Traders should monitor market breadth and new 52-week highs and lows alongside index prices.
2. Watch the Russell 2000’s 200-day moving average.
The small-cap index is at an important technical juncture. A rebound could help stabilize sentiment, while a sustained breakdown could signal further weakness in small-cap stocks and broader risk appetite.
3. Monitor semiconductor stocks for confirmation of a recovery.
The intraday rebounds in SanDisk and Micron were encouraging, but follow-through buying is needed before concluding that selling pressure has eased. Semiconductor performance will also be important for the NASDAQ’s near-term direction.
4. Earnings reactions matter more than headlines alone.
Goldman Sachs and Citigroup delivered encouraging results, while JPMorgan and Wells Fargo presented a more mixed picture. Traders should assess how stocks respond to earnings relative to expectations, guidance and the broader market environment.
5. Watch Wednesday’s bank earnings for further clues.
Reports from Bank of America, Morgan Stanley, State Street and BlackRock could influence Financials and provide insight into trading activity, asset management and the wider economic outlook.
6. Maintain disciplined risk management.
With mixed sector performance and weak market internals, traders should remain selective, manage position sizes carefully and consider taking partial profits when appropriate. Modest index movements can coexist with significant volatility in individual stocks.
.
Final Market Assessment
Tuesday’s U.S. market session was characterized by modest index losses, uneven sector performance and mixed earnings results. Energy and Telecommunications Services provided support, while Healthcare and Financials weighed on the market. Semiconductor stocks showed some intraday resilience, but the broader technology group remains an important area to monitor.
The NYSE displayed tentative signs of stabilization, but its new-high/new-low balance remained negative. The NASDAQ’s internal indicators were weaker, with declining issues significantly outnumbering advancing issues and new 52-week lows increasing sharply.
Our overall outlook remains cautiously neutral in the short term. The limited losses in the headline indexes are encouraging, but the broader market has yet to demonstrate convincing improvement. Earnings reports, semiconductor performance and the Russell 2000’s test of its 200-day moving average will be important signals for the next trading sessions.
For now, traders and investors should avoid assuming that subdued index movements mean downside risk has disappeared. A sustained improvement in market breadth and participation would provide stronger evidence that the market is stabilizing and preparing for its next advance.
.
NOTICE TO READERS
The Canadian Vanguard Stock Market is about empowering you to build and manage your wealth by yourself. There is certainly no magic in managing finances or wealth but one needs to know what to do and commit to doing what is needed. When you are ready to start the journey to Take Charge and Put Your Destiny In Your Own Hands, start with reading The Canadian Vanguard every market day. If and when you need more related information or to advertise your business products or services in The Canadian Vanguard, Contact Us
Our readers are strongly advised to conduct their own research into individual stocks before making a purchase decision. In addition, investors are advised that past stock performance is no guarantee of future price appreciation. Any recommendation is not a guarantee of any particular stock’s future prices, and The Canadian Vanguard accepts no responsibility or liability for investors’ or readers’ purchases.
Stocks In The News/ Stocks To Watch and Market Strategy will soon be available only to Paying Subscribers. The dollar sign “$” in the Toronto Market section in the articles only stands for Canadian dollar and in the US market section “$” stands for US dollar.
(c) This article is published by The Canadian Vanguard on October 13, 2026