







Markets Rebound Strongly as Oil Prices Stabilize and Investors Shrug Off Rising Bond Yields
The Canadian Vanguard Stock Market Report Weekend, October 9-11, 2026, Edition
.
The Toronto Market
Friday’s Toronto Market Index
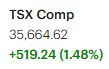
The S&P/TSX Composite Index rallied 519.24 points, or 1.48%, to close at 35,664.62 on Friday.
The TSX has now advanced for two consecutive sessions following Wednesday’s brutal market sell-off. Friday’s 1.48% gain marked a significant improvement over Thursday’s more modest 0.30% advance.

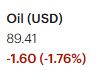
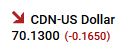
However, surging U.S. Treasury yields and continued volatility in oil prices are creating a challenging environment for traders and investors. Given the market’s current volatility, taking profits more quickly may be a prudent strategy. Traders should consider locking in gains, even smaller-than-usual profits, rather than holding positions too long and risking those gains evaporating.
From a technical perspective, the TSX gapped higher on Friday but remains just below both its 25-day and 50-day moving averages. Meanwhile, the index has widened its distance above its longer-term 200-day moving average, suggesting that the broader trend remains comparatively resilient despite the recent market turbulence.
Friday’s TSX Market Statistics
Market breadth on the TSX was strongly positive on Friday, with advancing issues significantly outnumbering declining issues. There were 1,800 advancers and 403 decliners, producing an advancer-to-decliner ratio of 4.46:1, or approximately nine advancers for every two decliners. Another 126 issues closed unchanged. The figures indicate that the bulls were firmly in control of Friday’s session.
The exchange recorded 81 new 52-week highs and 53 new 52-week lows, compared with 32 new highs and 76 new lows on Thursday. This marked a notable improvement in market breadth, with new highs more than doubling and new lows declining substantially.
The ratio of new 52-week highs to new 52-week lows improved to approximately 8:5. More importantly, new highs outnumbered new lows for the first time in the recent sequence of sessions in which new lows had consistently dominated. This represents a welcome improvement in the market’s internal indicators and suggests that underlying market conditions may be attempting to strengthen.
However, it remains too early to determine whether Friday’s improvement marks the beginning of a sustained reversal or merely a one-session development. A similar shift occurred last week but lasted only one session before the previous pattern reasserted itself. We will need to monitor the coming sessions to determine whether new highs can continue to outnumber new lows and establish a more durable positive trend. For now, market internals remain weakened, although Friday’s results offer encouraging signs that conditions may be improving.
Total trading volume on the TSX reached 435,592,300 shares, down approximately 7% from Thursday’s 469,936,230 shares. Although advancing stocks decisively outnumbered declining stocks, the decline in trading volume suggests that Friday’s rally was not accompanied by an increase in overall trading activity.
The TSX’s improving breadth and stronger advance-decline figures are encouraging, but the lower trading volume and lingering weakness in market internals warrant continued caution. Given the market’s vulnerability to volatility, investors should remain disciplined in their trading decisions and risk management.
Overall, the market outlook is improving, but further confirmation is needed. The key question is whether Friday’s stronger market breadth will persist over the coming sessions and translate into a sustained improvement in the TSX’s underlying technical condition.
Friday’s Toronto Stock Exchange (TSX) Market Wrap-Up Report
Sector Performance: Technology Leads a Broad-Based Advance
The TSX delivered a strong performance on Friday, with seven of the ten major sectors finishing in positive territory. Technology led the advance, climbing 3.54%, followed by Basic Materials, which gained 2.68%. Consumer Discretionary advanced 2.54%, while Financials rose 1.18%.
On the downside, Healthcare slipped 0.08%, Consumer Durables declined 0.28%, and Telecommunications Services fell sharply by 4.39%, making it the weakest-performing sector among those reported.
The significant decline in Telecommunications Services came amid concerns surrounding SpaceX’s reported acquisition of nationwide low-band spectrum. The development raises questions about the competitive threat to established telecommunications providers and the potential implications for their market share, pricing power, and future revenue growth. Investors should monitor further developments to determine how significantly this may affect the sector’s competitive landscape.
The strong performance in Technology, Basic Materials, Consumer Discretionary, and Financials helped support the broader market advance. Nevertheless, the sharp weakness in Telecommunications highlights the divergence in sector performance and reinforces the importance of selective positioning in the current market environment.
.
Company Spotlight: Aritzia Surges 20% on Strong Growth Expectations
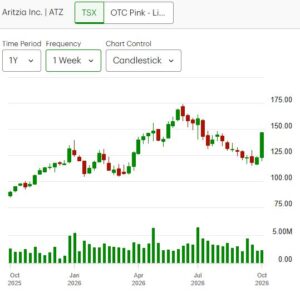
Aritzia Inc. (ATZ) was one of Friday’s standout performers, surging 20% to close at $146.91 on approximately 2.3 million shares traded.
The rally followed Thursday’s news highlighting strong growth at the Canadian women’s fashion retailer, driven in part by increasing demand from American shoppers. Friday’s price action suggests that investors responded enthusiastically to the company’s growth prospects.
From a technical perspective, Aritzia opened with a significant upward price gap, accompanied by trading volume well above its daily average. The combination of a sharp price advance and elevated volume indicates strong buying interest and provides greater significance to Friday’s breakout attempt.
Aritzia had been under pressure over the preceding two months, but Friday’s surge recovered a substantial portion of its recent decline. Traders will now be watching to see whether the stock can hold its gains and establish a higher trading range, or whether some investors will use the sharp advance as an opportunity to take profits.
For momentum traders, Friday’s price action puts Aritzia firmly on the watchlist. However, after a 20% single-session advance, chasing the stock without a defined entry strategy and risk-management plan could expose traders to substantial volatility. The ability to consolidate above its breakout area would be an important development to monitor.
.
Canadian Banks: Big Six Deliver a Broad-Based Advance
Canada’s Big Six banks enjoyed a relatively strong session on Friday, with all six institutions participating in the broader financial-sector advance.
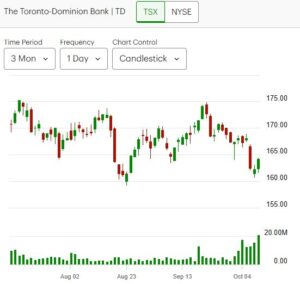
Toronto-Dominion Bank (TD) led the group, gaining 1.91% on reported trading volume of approximately 20.7 million shares. Bank of Montreal (BMO) followed with a 1.61% advance on approximately 1.2 million shares traded. National Bank of Canada (NA) and Canadian Imperial Bank of Commerce (CM) gained 1.36% and 1.27%, respectively.
Royal Bank of Canada (RY) advanced 1.07%, recovering more than its Thursday loss, while the remaining major bank stocks also contributed to the sector’s positive performance.
The broad-based strength in the banking group was encouraging, particularly given the importance of Financials to the TSX Composite Index. Continued strength in the banks could help support the broader index if the advance persists.
However, one strong session does not necessarily establish a sustained uptrend. Traders should watch whether the banks can maintain their gains and attract continued buying interest over the coming sessions, particularly as changing bond yields and broader market volatility influence financial stocks.
The big six banks have largely underperformed the last three months. The markets are dynamic and the outlook is constantly changing. Currently, both Toronto Dominion Bank and Bank of Nova Scotia (BNS) have the better charts in the group. Both BNS and TD stocks are above the 200-day moving average but below their 25-day and 50-day moving averages. National Bank stock, for example, is below both its short and long term averages.
.
Broader Market Context: Improving Momentum, but Confirmation Is Needed
The S&P/TSX Composite Index rallied 519.24 points, or 1.48%, to close at 35,664.62 on Friday, extending its recovery to two consecutive sessions following Wednesday’s sharp sell-off.
Market internals were notably stronger. Advancing issues totalled 1,800, compared with 403 declining issues, producing an advance-decline ratio of approximately 4.46:1. Another 126 issues closed unchanged. This broad participation suggests that Friday’s advance extended well beyond a handful of large-cap stocks.
The new-high/new-low figures also improved significantly. The TSX recorded 81 new 52-week highs against 53 new 52-week lows, compared with 32 new highs and 76 new lows on Thursday. This reversal is an encouraging development because new highs outnumbered new lows after a recent stretch in which new lows had been dominant.
Trading volume, however, declined approximately 7% to 435.6 million shares from 469.9 million shares on Thursday. Although the improvement in market breadth is positive, the lower volume warrants some caution when assessing the strength and sustainability of the rally.
From a technical perspective, the TSX gapped higher on Friday but remained just below its 25-day and 50-day moving averages. The index also maintained a greater distance above its 200-day moving average, suggesting that the longer-term technical picture remains more resilient than the short-term trend.
Surging U.S. Treasury yields and volatility in oil prices remain important factors for investors to monitor. These developments could influence sector leadership, market sentiment, and the sustainability of the recent recovery.
The key question is whether Friday’s stronger breadth and improved new-high/new-low relationship will persist. A repeat performance over the next several sessions would provide stronger evidence that market conditions are improving rather than merely experiencing a temporary rebound.
.
Key Takeaways for Traders and Investors
1. The market recovery is encouraging, but confirmation remains essential.
Two consecutive advancing sessions, a strong advance-decline ratio, and new 52-week highs exceeding new lows point to improving market conditions. However, the TSX remains below its 25-day and 50-day moving averages, while trading volume declined on Friday. Traders should look for follow-through before concluding that a more durable recovery is underway.
2. Selectivity remains important in a volatile market.
Technology, Basic Materials, Consumer Discretionary, and Financials led Friday’s advance, while Telecommunications Services suffered a substantial decline. This divergence highlights the importance of evaluating individual sectors and stocks rather than assuming that the entire market will move in the same direction.
3. Aritzia offers a momentum setup to monitor, not an automatic buy signal.
The 20% rally, upward price gap, and above-average volume point to strong buying interest. However, after such a sharp move, volatility and profit-taking risks are elevated. Traders should monitor whether the stock holds its gains and consolidates constructively before considering a new position.
4. The banking sector could help sustain the TSX recovery.
Broad-based gains among the Big Six banks are encouraging because Financials are an important component of the Canadian equity market. Continued strength would support the index, but traders should monitor the effects of bond yields and the broader economic outlook.
5. Manage profits and risk proactively.
In the current volatility environment, traders may wish to consider taking partial profits sooner, tightening risk controls where appropriate, and avoiding oversized positions. Waiting for a substantially larger gain can be counterproductive if market conditions cause unrealized profits to disappear. Trading decisions should remain consistent with each investor’s time horizon and risk tolerance.
.
Overall Market Outlook
Friday’s session delivered several encouraging signals: a strong TSX advance, broad participation across advancing stocks, an improvement in the new-high/new-low relationship, and strength in several influential sectors.
Nevertheless, the decline in trading volume, the index’s position below its shorter-term moving averages, and continuing uncertainty surrounding bond yields and oil prices argue against becoming overly optimistic after only two advancing sessions.
The market outlook is improving, but the recovery still needs confirmation. Traders should monitor the TSX’s ability to reclaim its 25-day and 50-day moving averages, the persistence of positive market breadth, and whether new 52-week highs continue to outnumber new lows. Until these improvements become more consistent, maintaining a selective, disciplined approach to trading and risk management remains prudent.
.
The US Markets
Friday’s U.S. Market Indexes
Major U.S. Indexes Extend Their Recovery
The major U.S. stock indexes advanced for a second consecutive session on Friday, extending their recovery and delivering a broadly positive finish to the trading week.
The Dow Jones Industrial Average led the major indexes, rallying 423.31 points, or 0.83%, to close at 51,654.95. The S&P 500 gained 46.18 points, or 0.59%, finishing at 7,811.54, while the Nasdaq Composite advanced 172.83 points, or 0.64%, to close at 27,366.17. The Russell 2000 rose 12.85 points, or 0.46%, ending the session at 2,806.98.

Although the Russell 2000 was the weakest performer among the four indexes, it still posted a respectable gain of nearly 0.50%. Overall, Friday was a buoyant session, with all four major indexes participating in the advance. The second consecutive daily gain is encouraging, although further confirmation will be needed to establish whether the recovery can be sustained.
Technical Analysis: Most Indexes Show Improving Conditions
From a technical perspective, the major indexes are showing a mixed but generally improving picture.
The Nasdaq Composite and S&P 500 remain comfortably above their 25-day, 50-day, and 200-day moving averages, indicating that their short-, intermediate-, and longer-term technical positions remain comparatively strong.
A particularly encouraging development is the S&P 500’s position above both its 25-day and 50-day moving averages. This strengthens the near-term technical outlook and suggests that the recent recovery is gaining traction. Maintaining these levels in the coming sessions will be important to confirming the improvement.
The Dow Jones Industrial Average presents a less convincing short-term picture. Despite leading Friday’s advance, the index remains below both its 25-day and 50-day moving averages, although it is trading just below the 25-day average. This remains a technical concern because the Dow has yet to reclaim these important short-term trend indicators. On the positive side, the index continues to trade well above its 200-day moving average, suggesting that its longer-term technical position remains comparatively resilient.
The Russell 2000 has also moved clearly above its 25-day and 50-day moving averages and remains comfortably above its 200-day moving average. This is an encouraging development for small-cap stocks and suggests that the recent improvement is extending beyond the large-cap stocks represented in the Dow, S&P 500, and Nasdaq.
Key Takeaways for Traders and Investors
- The recovery is broadening. All four major indexes advanced for a second consecutive session. The positive performance across large-cap and small-cap indexes is encouraging, although two sessions of gains alone do not confirm a sustained market uptrend.
- The S&P 500 and Nasdaq remain technically well positioned. Both indexes are above their 25-day, 50-day, and 200-day moving averages. The S&P 500’s position above its two shorter-term averages is particularly encouraging.
- The Dow needs further improvement. Despite Friday’s strong gain, the index remains below its 25-day and 50-day moving averages. Reclaiming these levels would strengthen its short-term technical outlook.
- The Russell 2000 deserves attention. Its position above all three moving averages is a positive sign for small-cap stocks. Continued strength could provide additional evidence that the market recovery is broadening.
- Maintain disciplined risk management. Following two consecutive advancing sessions, traders should watch for follow-through rather than assume that the recovery will continue uninterrupted. Position sizing, profit-taking, and clearly defined risk limits remain important, particularly if volatility returns.
Overall Market Outlook
Friday’s session delivered another positive development for U.S. equities, with all four major indexes advancing for a second consecutive day. The technical picture is encouraging for the S&P 500, Nasdaq Composite, and Russell 2000, all of which are trading above their key moving averages.
The Dow remains the principal area of short-term technical concern because it has yet to reclaim its 25-day and 50-day moving averages, despite leading Friday’s advance.
The overall market outlook is improving, but confirmation remains necessary. Traders should monitor whether the major indexes can sustain their gains, whether the Dow can recover its short-term moving averages, and whether the strength in the Russell 2000 persists. Continued progress across these measures would provide stronger evidence that the market recovery is becoming more established.
Friday’s U.S. Market Statistics
New York Stock Exchange (NYSE): Market Breadth Improves as New Lows Decline Sharply
Market breadth on the New York Stock Exchange (NYSE) was positive on Friday, with advancing issues comfortably outnumbering declining issues. The exchange recorded 2,801 advancers, 1,698 decliners, and 458 unchanged issues, producing an advance-decline ratio of approximately 1.65:1. In other words, there were roughly five advancers for every three decliners.
This positive advance-decline reading indicates that buying interest extended across a broad range of NYSE-listed stocks. However, the new-high/new-low figures present a more cautious picture of the market’s underlying technical condition.
The NYSE recorded 141 new 52-week highs and 183 new 52-week lows on Friday, compared with 110 new highs and 416 new lows on Thursday. The number of new highs increased by approximately 28%, while new lows declined by about 56%.
The most encouraging development was the sharp reduction in new 52-week lows. For several recent sessions, new lows had substantially outnumbered new highs, sometimes by several times. Friday interrupted that pattern, with the number of new lows falling below Thursday’s level by more than half and the gap between new highs and new lows narrowing considerably.
Nevertheless, new lows continued to outnumber new highs, 183 to 141. This means the market’s longer-term internal indicators remain weakened despite Friday’s improvement. The latest figures suggest that underlying market conditions may be stabilizing, but it is too early to conclude that a sustained reversal is underway.
We will need to monitor the coming sessions to determine whether new highs can continue to increase and new lows decline. A sustained improvement in this relationship would provide stronger evidence that the market’s internal condition is recovering.
NYSE trading volume totalled approximately 4.87 billion shares, down about 22% from Thursday’s 6.25 billion shares. Although advancing issues substantially outnumbered declining issues, trading activity was considerably lighter than in the previous session.
The combination of positive market breadth and lower trading volume is encouraging in the sense that the market advanced without the same level of activity seen on Thursday. However, lower volume alone does not establish the strength or sustainability of the recovery. The market’s ability to maintain positive breadth while improving its new-high/new-low relationship will be more important in assessing the next phase of the trend.
NYSE assessment: Friday delivered a meaningful improvement in market breadth and a sharp reduction in new 52-week lows. However, new lows still exceeded new highs, leaving the broader internal picture weakened. Further confirmation is required.
.
NASDAQ: Market Internals Improve, but Underlying Weakness Persists
The NASDAQ also recorded positive market breadth on Friday, with advancing stocks outnumbering declining stocks. There were 2,883 advancers, 2,040 decliners, and 430 unchanged issues, resulting in an advance-decline ratio of approximately 1.41:1. That translates to roughly seven advancers for every five decliners.
The positive ratio indicates that buying interest extended across a broad range of NASDAQ-listed stocks. However, as with the NYSE, the new-high/new-low relationship suggests that the market’s underlying technical condition remains weaker than the headline advance-decline figures might imply.
The NASDAQ recorded 72 new 52-week highs and 272 new 52-week lows on Friday, compared with 48 new highs and 442 new lows on Thursday.
The number of new highs increased by 50%, while new lows declined by approximately 38%. As a result, the relationship between new highs and new lows improved substantially. The number of new lows fell from more than nine times the number of new highs on Thursday to fewer than four times the number on Friday.
This represents a welcome improvement in the NASDAQ’s market internals. Nevertheless, new 52-week lows continued to outnumber new highs by a considerable margin, indicating that underlying weakness has not yet been eliminated.
The recent pattern of significantly elevated new lows suggests that many individual stocks remain under pressure, even as the major indexes recover. Friday’s improvement could mark the beginning of a broader stabilization, but several more sessions of improving figures would be needed to establish greater confidence in that possibility.
NASDAQ trading volume reached approximately 7.09 billion shares, down 23% from Thursday’s 9.14 billion shares. The NASDAQ advanced despite this substantial decline in trading activity.
The lower volume indicates that Friday’s session involved less trading activity than Thursday’s. However, it would be premature to conclude that there was no momentum or selling pressure based on volume alone. Price movement, trading volume, and market internals should be evaluated together to determine whether the recovery is attracting sustained participation.
NASDAQ assessment: Market breadth was positive, new highs increased, and new lows declined significantly. These are encouraging developments, but the continued dominance of new lows indicates that the NASDAQ’s underlying technical condition remains weak.
Key Takeaways for Traders and Investors
1. Market breadth improved on both exchanges.
Advancing issues outnumbered declining issues on both the NYSE and NASDAQ. This broad participation is encouraging and suggests that Friday’s positive session extended beyond a small number of heavily weighted stocks.
2. The sharp decline in new 52-week lows is the most encouraging development.
Both exchanges recorded substantial reductions in new lows compared with Thursday. This may indicate that some of the recent selling pressure is easing. However, new lows continued to exceed new highs on both exchanges, so the improvement needs to persist before a stronger conclusion can be drawn.
3. Market internals remain weaker than the headline index performance suggests.
Positive advance-decline ratios do not necessarily mean that the broader market has fully recovered. The continued dominance of new 52-week lows indicates that a significant number of individual stocks remain under pressure. Traders should therefore avoid relying exclusively on the major indexes when evaluating market health.
4. Lower trading volume requires careful interpretation.
Trading volume declined by approximately 22% on the NYSE and 23% on the NASDAQ. The lower activity accompanied a positive session, but it does not independently confirm that selling pressure has disappeared or that buying conviction is strengthening. Continued price gains accompanied by improving breadth and healthier new-high/new-low figures would provide more convincing evidence of a sustainable recovery.
5. Watch for follow-through over the next several sessions.
The key question is whether Friday’s improvement represents a temporary interruption in the recent weakness or the beginning of a more durable recovery in market internals. Continued declines in new lows, accompanied by rising new highs and positive advance-decline ratios, would strengthen the case for improving market conditions.
Overall Market Outlook
Friday’s market statistics delivered encouraging signs on both the NYSE and NASDAQ. Advancers outnumbered decliners, new 52-week highs increased, and new 52-week lows declined sharply. These developments suggest that the immediate market environment may be stabilizing following the recent weakness.
However, the internal picture remains fragile. New lows continued to outnumber new highs on both exchanges, while trading volume declined substantially from Thursday’s levels.
The market is showing signs of improvement, but a confirmed recovery in market internals has yet to emerge. Traders and investors should remain selective, manage risk carefully, and monitor whether Friday’s positive developments persist. A sustained improvement in the new-high/new-low relationship would be one of the more important signals that the broader market is regaining technical strength.
Friday’s U.S. Market Wrap-Up Report
Stocks Rebound for a Second Session as AI-Related Shares Show Mixed Performance
Major U.S. Indexes Extend Their Recovery
U.S. equities advanced for a second consecutive session on Friday, extending their recovery following Wednesday’s sell-off, which was driven in part by investor concerns about AI-related revenue growth, capital spending, and the sustainability of the artificial intelligence business model.
The Dow Jones Industrial Average led the major indexes, gaining 0.83%. The S&P 500 advanced 0.59%, while the Nasdaq Composite rose 0.64%. The Russell 2000 gained 0.46%, demonstrating that small-cap stocks also participated in the recovery.
Friday’s performance was encouraging, particularly given the concerns that had unsettled investors earlier in the week. Some AI-infrastructure companies that had suffered substantial losses during the recent sell-off rebounded, suggesting that buyers were willing to step back into selected growth stocks.
The broader economic backdrop may also have helped support sentiment. According to the figures provided, the U.S. 10-year Treasury yield rose just one basis point to 5.24% on Friday, while oil prices were essentially flat. The relatively limited daily movement in these markets may have reduced additional pressure on equities, although it does not establish the cause of Friday’s advance.
Nevertheless, two consecutive advancing sessions do not necessarily signal that the market has fully recovered. Investors remain sensitive to Treasury yields, energy prices, corporate earnings expectations, and the substantial investment required to build out AI infrastructure.
Sector Performance: Gains Across Most Sectors, but Leadership Remains Uneven
Eight of the eleven S&P 500 sectors advanced on Friday, indicating that the recovery extended across much of the market.
Healthcare led the reported S&P 500 sector performance, gaining 1.52%, while Basic Materials advanced 1.42%. Consumer Discretionary rose 1.25%, and Consumer Durables gained 0.21%. Energy slipped 0.04%.
Retail-related stocks were another area of strength, gaining 2.69% according to the figures provided. Meanwhile, Telecommunications Services plunged 8.43%, making it the weakest-performing group cited in the report.
The strong performance in Basic Materials was also notable, as materials-related stocks featured prominently among Friday’s leading gainers. This suggests that the recovery was not confined exclusively to technology and AI-related companies.
However, the substantial decline in Telecommunications Services highlights the uneven nature of the session. Investors should continue to distinguish between broad market improvement and weakness affecting specific industries or individual companies.
.
Semiconductor Stocks Remain Under Pressure
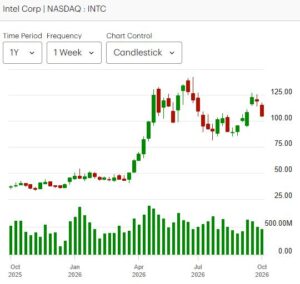
Despite Friday’s broader market advance, semiconductor stocks continued to exhibit weakness. The supplied trading figures show continued declines across Micron Technology (MU), Sandisk (SNDK), Intel (INTC), and Nvidia (NVDA).
The following figures summarize the reported price movements across the two sets of sessions supplied.
| Company | Earlier reported close | Subsequent reported close | Subsequent change |
|---|---|---|---|
| Micron Technology (MU) | $1,035.84 | $1,029.00 | -0.66% |
| Sandisk (SNDK) | $1,609.46 | $1,581.82 | -1.72% |
| Intel (INTC) | $107.08 | $104.70 | -2.22% |
| Nvidia (NVDA) | $230.48 | $229.28 | -0.52% |
Trading volume also declined across all four stocks in the subsequent session, according to the supplied figures. Intel recorded the largest volume among the group, with 75.0 million shares traded, followed by Nvidia at 84.6 million shares and Micron at 19.9 million shares; Sandisk recorded 5.6 million shares.
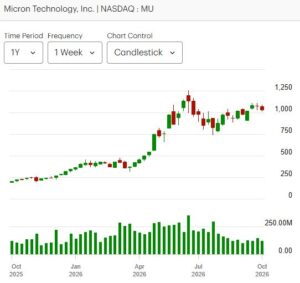
The continued weakness in these semiconductor names deserves attention because they occupy important positions in the AI and data-centre investment ecosystem. Their performance can influence sentiment toward technology stocks more broadly.
However, weakness in individual semiconductor stocks should not automatically be interpreted as evidence that the AI industry is losing its long-term growth potential. Company-specific valuations, earnings expectations, competitive pressures, and investor positioning can all influence short-term share-price movements.
For traders, the key question is whether these stocks can establish support and demonstrate renewed buying interest. Two consecutive sessions of weakness may warrant monitoring, but a watchlist candidate should ideally show evidence of stabilization or a credible reversal setup before a position is considered.
AI Infrastructure Stocks Rebound After Recent Selling
While semiconductor stocks remained under pressure, several companies associated with optical communications and AI infrastructure recovered on Friday.
Lumentum Holdings (LITE) was among the notable gainers. After falling 5.62% in the earlier session cited in your report, the stock advanced 5.22% on Friday to close at $1,103.36, with approximately 5.2 million shares traded.
Coherent Corp. (COHR) also rebounded, gaining 3.4% to close at $312.62 on 8.1 million shares traded. The advance followed a reported 9.62% decline in the preceding session, when 9.3 million shares changed hands.
Applied Optoelectronics (AAOI) recovered as well. After dropping 13.58% in the earlier session, the stock rose 3.53% on Friday to close at $109.64, with approximately 14.5 million shares traded.
These reversals illustrate the considerable volatility affecting companies exposed to AI infrastructure spending. Sharp declines can attract bargain hunters and short-term traders looking for rebounds, particularly when the longer-term growth narrative remains intact.
However, the Friday advances did not fully offset the earlier losses reported for Coherent and Applied Optoelectronics. Lumentum’s reported Friday gain was also smaller than its earlier percentage decline. The price action therefore represents a partial recovery rather than confirmation that the previous downtrend has ended.
Traders should monitor whether these stocks can maintain their rebounds, establish higher lows, and attract sustained buying volume. A single strong session following a steep decline can be the beginning of a recovery, but it can also be a temporary relief rally.
For investors with a longer time horizon, these companies may merit further research because optical networking and related infrastructure are important components of data-centre expansion. Nevertheless, their long-term prospects must be assessed alongside valuations, earnings growth, competitive positioning, and the actual pace of AI infrastructure investment.
AI Outlook: Long-Term Potential Remains, but Investors Must Be Selective
Artificial intelligence remains a major technological development with the potential to transform industries, business processes, and everyday life. Its adoption is still evolving, and continued investment in computing capacity, data centers, networking, and supporting infrastructure could create opportunities for selected companies over the coming years.
The long-term opportunity, however, should not be confused with a guarantee that every AI-related stock will appreciate. Companies can benefit from a growing industry and still deliver disappointing shareholder returns if their valuations become excessive, earnings fail to meet expectations, or competition reduces profit margins.
The recent volatility also highlights an important distinction between the AI investment theme and the performance of individual stocks. Semiconductor manufacturers, optical-networking suppliers, data-centre operators, and software developers have different business models, risk profiles, and earnings drivers. Their share prices will not necessarily move together.
Investors should therefore focus on identifying businesses with sustainable competitive advantages, credible revenue growth, sound financial positions, and valuations that reasonably reflect their prospects. Traders, meanwhile, should pay close attention to price action, volume, support and resistance levels, and broader market conditions.
AI may continue to be a powerful long-term technological force, but the path for investors is unlikely to be a straight line. Periods of enthusiasm, valuation adjustments, and temporary setbacks should be expected as the industry matures and market expectations evolve.
Key Takeaways for Traders and Investors
1. The broad market recovery is encouraging, but confirmation is still needed.
All four major U.S. indexes advanced for a second consecutive session. The Dow led the gains, while the S&P 500, Nasdaq Composite, and Russell 2000 also finished higher. Traders should watch for continued follow-through rather than assume that the recent sell-off has definitively ended.
2. Semiconductor weakness warrants close monitoring.
Micron, Sandisk, Intel, and Nvidia continued to decline in the supplied figures. Their price action suggests that buying interest remains uneven within the technology sector. Traders should look for stabilization and renewed demand before treating these stocks as confirmed recovery candidates.
3. AI infrastructure stocks are volatile trading candidates, not automatic bargains.
Lumentum, Coherent, and Applied Optoelectronics rebounded after significant losses. These moves may offer opportunities for traders who can define their entries and manage risk, but the rebounds have not yet established that the previous weakness is over.
4. Lower Treasury-yield pressure and stable oil prices may help sentiment, but remain important variables.
Friday’s relatively modest movement in Treasury yields and oil prices coincided with the equity advance. Traders should continue monitoring these markets because renewed increases in yields or sharp movements in energy prices could affect valuations and market sentiment.
5. Long-term AI potential does not eliminate valuation risk.
AI adoption may create significant opportunities, but investors should differentiate between companies with durable earnings potential and those whose valuations depend heavily on optimistic future expectations. Fundamental research and valuation discipline remain essential.
6. Risk management remains especially important after sharp market swings.
In a volatile environment, traders may consider taking partial profits when appropriate, avoiding oversized positions, and using predefined risk limits. After a sharp rebound, chasing a stock without a clear trading plan can expose traders to another abrupt reversal.
Overall Market Outlook
Friday’s session offered a welcome improvement in U.S. equity sentiment, with all four major indexes advancing for a second consecutive day. Strength in several AI-infrastructure stocks and gains across eight of the eleven S&P 500 sectors provided additional evidence that the recovery extended beyond a narrow group of companies.
Nevertheless, the continued weakness in major semiconductor stocks and the sharp volatility in AI-infrastructure names suggest that investor confidence remains uneven. The broader market statistics also warrant caution: although market breadth was positive on both the NYSE and NASDAQ, new 52-week lows continued to outnumber new highs on both exchanges, and trading volume declined substantially from Thursday.
The market is recovering, but the underlying technical picture remains mixed. Traders should look for sustained index strength, improving market internals, and clearer stabilization in individual stocks before assuming that a durable uptrend has resumed.
For longer-term investors, AI remains an important investment theme worth researching, but selectivity, valuation discipline, and financial quality should guide stock selection. For active traders, the immediate priority is to distinguish genuine recoveries from temporary rebounds and to manage risk accordingly.
.
NOTICE TO READERS
The Canadian Vanguard Stock Market is about empowering you to build and manage your wealth by yourself. There is certainly no magic in managing finances or wealth but one needs to know what to do and commit to doing what is needed. When you are ready to start the journey to Take Charge and Put Your Destiny In Your Own Hands, start with reading The Canadian Vanguard every market day. If and when you need more related information or to advertise your business products or services in The Canadian Vanguard, Contact Us
Our readers are strongly advised to conduct their own research into individual stocks before making a purchase decision. In addition, investors are advised that past stock performance is no guarantee of future price appreciation. Any recommendation is not a guarantee of any particular stock’s future prices, and The Canadian Vanguard accepts no responsibility or liability for investors’ or readers’ purchases.
Stocks In The News/ Stocks To Watch and Market Strategy will soon be available only to Paying Subscribers. The dollar sign “$” in the Toronto Market section in the articles only stands for Canadian dollar and in the US market section “$” stands for US dollar.
(c) This article is published by The Canadian Vanguard on October 10, 2026



