




U.S. Indexes Retreat as Renewed Middle East Tensions Rattle Markets
The Canadian Vanguard Stock Market Report Monday August 31, 2026 Edition
.
The Toronto Market
Monday Toronto Market Index
The S&P/TSX Composite Index fell 283.44 points, or 0.78%, to close at 36,270.48, extending its losing streak to two consecutive sessions.
The TSX opened lower and remained under pressure throughout Monday’s session. Market breadth was weak, with only three of the ten major sectors finishing higher. Overall, the tone was negative and approached bearish territory, as geopolitical developments in the Middle East weighed on investor sentiment and risk appetite.
Despite Monday’s decline, the broader trend remains constructive. The TSX has fallen in only two of the past seven sessions, indicating that the recent weakness is still relatively contained within the broader uptrend.
From a technical perspective, the index’s internals remain relatively strong. The TSX is currently sitting around its 25-day moving average, while remaining comfortably above both its 50-day and 200-day moving averages. This suggests that, although near-term momentum has weakened, the longer-term technical structure remains positive.
Bottom line: Monday was a poor session for the Toronto market, with broad-based weakness and heightened geopolitical concerns. However, the TSX has yet to break down from its broader bullish structure. Traders should watch the 25-day moving average closely for signs of either stabilization or further downside momentum.
Monday’s TSX Market Statistics
Market breadth on the TSX was decidedly negative on Monday, with declining issues substantially outnumbering advancing issues. There were 1,440 decliners versus 780 advancers, producing a decliner-to-advancer ratio of 1.84:1—or roughly two declining stocks for every advancing stock. Another 141 issues finished unchanged.
The deterioration in market breadth was also evident in the 52-week statistics. The TSX recorded 39 new 52-week highs and 99 new 52-week lows, compared with 67 new highs and 31 new lows on Friday.
This represents a significant deterioration in underlying market strength. The number of new 52-week highs fell by approximately 42%, while new 52-week lows more than tripled from Friday’s level. The new-high-to-new-low ratio consequently deteriorated sharply to 2:5, compared with 2:1 on Friday.
The message from the internals was therefore clear: Monday’s market weakness was broad-based and carried a distinctly bearish tone. The sharp expansion in new lows, combined with the decline in new highs, suggests that selling pressure was not limited to a handful of major stocks.
Trading activity also increased significantly. TSX volume reached 519.6 million shares, up approximately 30% from Friday’s 398.6 million shares. The combination of higher volume, negative breadth, and a surge in new 52-week lows provides additional confirmation that Monday’s decline reflected meaningful deterioration in short-term market sentiment.
Bottom line: The TSX’s internal statistics were considerably weaker on Monday. While the broader index remains above its longer-term moving averages, the deterioration in breadth and the sharp increase in new lows are warning signals that traders should monitor closely.
.
Monday’s Toronto TSX Market Wrap-Up Report
The S&P/TSX Composite Index closed at 36,270.48, down 283.44 points, or 0.78%, extending its losing streak to two consecutive sessions. The index continues to have difficulty sustaining levels above 37,000, and Monday’s session added to the evidence that near-term momentum has weakened.
The selling pressure was broad-based. The TSX opened lower and remained below Friday’s close throughout the session, with only three of the ten major sectors finishing higher. Geopolitical developments involving the United States and Iran again dominated investor sentiment, contributing to higher oil prices and providing support for the energy sector.
Energy Leads as Oil Rises
Energy was the TSX’s strongest major sector, gaining 1.08%, as renewed Middle East tensions pushed oil prices higher. Several major energy names rebounded after Friday’s losses.
Canadian Natural Resources recovered approximately 2% after declining 1.3% on Friday, while Suncor Energy gained about 1.8% after losing 1.1% in the previous session.
The energy sector is therefore providing an important source of relative strength for the TSX, although traders should distinguish between a genuine improvement in the broader market and a sector benefiting from geopolitical risk and higher commodity prices.
Gold Stocks Pull Back
Gold prices continued to retreat on Monday, and the weakness carried over into several major gold-mining stocks following their recent gains.
Agnico Eagle Mines (AEM) declined 3.85% to $286.76, with approximately 1.1 million shares changing hands. SSR Mining (SSRM) fell approximately 4% to $51.87, on volume of about 504,000 shares.
The pullback in gold miners is worth watching. After a strong advance, profit-taking and consolidation are normal, but continued weakness in gold prices could put additional pressure on the group.
Financials Under Pressure
The major Canadian banks also had a difficult session. Bank of Montreal (BMO) declined 1.25%, while Bank of Nova Scotia (BNS) fell 1.16%, making them the two weakest performers among the major banks.
Royal Bank of Canada (RY) was down approximately 0.27%, while the remaining major banks were also generally weaker.
The weakness in financials is significant because the banks carry substantial weight in the TSX. Continued selling across the financial sector would make it more difficult for the index to regain upward momentum.
Individual Stocks to Watch
Bombardier (BBD) was one of Monday’s notable decliners, falling approximately 6%. The move represents a particularly sharp single-session decline and places the stock firmly on the watch list for traders looking for either continued downside momentum or a potential technical rebound.
Aritzia (ATZ) gained 1.06%. After being a market favourite in recent weeks, the stock appears to be entering a consolidation phase. Traders should watch whether the stock can establish support and resume its advance or whether the consolidation develops into a deeper correction.
Cameco and Energy Fuels: A Different Energy Story: Cameco (CCO) and Energy Fuels (EFR) provide an interesting contrast to the oil and gas producers.
Although both companies are classified within the energy space, their businesses are tied to uranium and nuclear energy rather than crude oil and natural gas. Consequently, the geopolitical developments affecting oil prices and the Strait of Hormuz do not provide the same direct catalyst for these stocks.
Neither Cameco nor Energy Fuels participated meaningfully in Monday’s oil-driven energy-sector advance. For traders, this distinction is important: “energy” on the TSX is not a single trade. Oil producers, uranium companies and other energy-related stocks can respond very differently to the same geopolitical event.
.
Market Internals Send a Warning
The day’s market statistics were considerably weaker than the headline index decline alone would suggest.
There were 1,440 declining issues versus 780 advancing issues, producing a decliner-to-advancer ratio of 1.84:1—roughly two declining stocks for every advancing stock. Another 141 issues were unchanged.
The 52-week statistics were even more concerning. The TSX recorded only 39 new 52-week highs against 99 new 52-week lows, compared with 67 new highs and 31 new lows on Friday.
That represents a sharp deterioration in market breadth. New 52-week highs fell by approximately 42%, while new 52-week lows more than tripled from Friday. The new-high-to-new-low ratio deteriorated from 2:1 on Friday to 2:5 on Monday.
Trading volume also increased substantially. Approximately 519.6 million shares changed hands on the TSX, about 30% higher than Friday’s 398.6 million shares.
The combination of higher volume, negative breadth and a sharp increase in new 52-week lows gives Monday’s decline more significance than a routine 0.78% pullback. The market internals were clearly weak and carried a distinctly bearish short-term tone.
Technical Perspective: Despite Monday’s weakness, the longer-term technical picture has not yet broken down.
The TSX is currently around its 25-day moving average, but remains comfortably above its 50-day and 200-day moving averages. This suggests that the index is experiencing a deterioration in short-term momentum while its intermediate- and longer-term trend remains constructive.
For traders, the 25-day moving average becomes an important near-term level to monitor. Holding this area and seeing breadth improve could signal stabilization. A decisive break below it, accompanied by expanding downside volume and further deterioration in new highs versus new lows, would be a more meaningful warning.
Key Takeaways for Traders and Investors
- Short-term tone: Bearish. Monday produced broad-based selling, weak internals and higher trading volume.
- Broader trend: Still constructive. The TSX remains above its 50-day and 200-day moving averages.
- Breadth: A significant warning signal. Decliners outnumbered advancers 1.84:1, while new lows surged.
- Volume: Approximately 30% higher than Friday, adding weight to Monday’s decline.
- Energy: The strongest sector, benefiting from higher oil prices and renewed Middle East tensions.
- Financials: Weakness in the major banks remains a concern because of their importance to the TSX.
- Gold miners: Continued weakness in gold prices is putting pressure on stocks that had recently performed strongly.
- Individual stocks: Bombardier’s 6% decline warrants attention, while Aritzia appears to be consolidating after its recent advance.
- Key technical level: The 25-day moving average is an important near-term test for the TSX.
- What traders should watch next: Whether the index can stabilize near its short-term moving average and whether market breadth begins to improve.
Bottom Line: Monday was a poor session for the TSX, and the market internals were more bearish than the 0.78% index decline might initially suggest. The surge in new 52-week lows, weak advance-decline ratio and higher volume point to meaningful deterioration in short-term market sentiment.
However, the broader technical structure remains intact for now. The TSX is still well above its 50-day and 200-day moving averages, so Monday’s action should be viewed as a short-term warning rather than confirmation of a major trend reversal.
For traders, the next few sessions will be important. A recovery accompanied by improving breadth would suggest that Monday’s selloff was primarily a correction. Continued weakness, expanding new lows and a break below the 25-day moving average would make the bearish case considerably stronger.
.
The US Markets
Monday’s U.S. Market Indexes
All four major U.S. equity indexes finished Monday’s session in negative territory, with large-cap and small-cap stocks both under pressure.
The Dow Jones Industrial Average fell 374.09 points, or 0.70%, to 53,185.90. The S&P 500 declined 25.62 points, or 0.33%, to 7,686.14, while the Nasdaq Composite slipped 31.53 points, or 0.12%, to 26,370.89. The Russell 2000 dropped 15.92 points, or 0.54%, to 2,972.37.
Large Caps and Small Caps Under Pressure
The Dow was the weakest of the three major large-cap indexes, falling 0.70% as higher Treasury yields weighed on equities. Rising yields can pressure stock valuations because higher interest rates increase the discount rate applied to future corporate earnings and make fixed-income investments relatively more attractive.
The Russell 2000, which represents smaller U.S. companies, also came under pressure. Small-cap companies tend to be more sensitive to financing conditions because they often rely more heavily on external borrowing to fund expansion. Higher interest rates can therefore increase their cost of capital and make growth more difficult to finance.
The Russell 2000 fell 0.54% on Monday, following a much sharper 1.39% decline on Friday. Although Monday’s loss was considerably smaller, the back-to-back declines are worth monitoring. Small caps are showing greater short-term vulnerability than the large-cap indexes.
Nasdaq and S&P 500 Show Relative Strength
The Nasdaq Composite and S&P 500 were also lower, but their performance was considerably better than that of the Dow and Russell 2000.
Both indexes finished well above their session lows, indicating that buyers emerged during the day and helped recover a meaningful portion of the early weakness. The Nasdaq declined only 0.12%, while the S&P 500 lost 0.33%.
Some technology stocks managed to advance, but weakness in several large-cap technology names limited the performance of the technology-heavy Nasdaq. Nevertheless, the Nasdaq and S&P 500 demonstrated better relative strength than the Dow and Russell 2000.
This relative performance is important for traders: the market was not uniformly weak. Capital appeared to remain more supportive of large-cap growth and technology-oriented stocks than of economically sensitive and small-cap names.
Technical Picture
The technical picture remains constructive for the S&P 500 and Nasdaq Composite. Both indexes continue to trade above their 25-day, 50-day and 200-day moving averages, maintaining their broader bullish structures despite Monday’s decline.
The Dow Jones Industrial Average is now testing its 25-day moving average. It remains comfortably above its 50-day and 200-day moving averages, so the longer-term trend has not been damaged. However, a decisive break below the 25-day average would be a short-term warning signal.
The Russell 2000 presents the weakest technical picture of the four major indexes. After two consecutive sessions of significant selling pressure, the index has fallen back below both its 25-day and 50-day moving averages. This suggests that small caps could face a more difficult short-term trading environment.
Relative Strength Matters
Monday’s closing levels highlight an important distinction between the major U.S. indexes.
The Nasdaq and S&P 500 demonstrated relative strength, recovering from their session lows and maintaining their positions above all three major moving averages. The Dow was weaker, while the Russell 2000 showed the greatest technical deterioration.
For traders and investors, this divergence is worth watching. A market correction becomes more concerning when weakness spreads from a few vulnerable segments into the strongest areas of the market. For now, the large-cap growth complex remains technically stronger than small caps.
Key Takeaways for Traders and Investors
- Overall market tone: Negative, but not uniformly bearish.
- Strongest major index: Nasdaq Composite, down only 0.12% and closing well above its session low.
- S&P 500: Down 0.33%, but still above its 25-day, 50-day and 200-day moving averages.
- Weakest large-cap index: Dow Jones, down 0.70% and now testing its 25-day moving average.
- Small caps: Russell 2000 remains the technical weak spot, falling 0.54% after Friday’s 1.39% decline and moving back below its 25-day and 50-day averages.
- Interest rates: Higher yields remain a headwind for equity valuations and are particularly relevant to smaller companies with greater financing needs.
- Market leadership: Large-cap technology and growth remain relatively stronger than small caps, although some major technology names came under pressure Monday.
- Technical signal to watch: Whether the Dow can hold its 25-day moving average and whether the Russell 2000 can reclaim its 25-day and 50-day averages.
Bottom Line: Monday was a risk-off session, but the damage was uneven. The Dow and Russell 2000 absorbed the greatest pressure, while the Nasdaq and S&P 500 showed considerably better resilience by recovering from their session lows.
The most important technical distinction is that the S&P 500 and Nasdaq remain above their 25-day, 50-day and 200-day moving averages, while the Russell 2000 has slipped below its 25-day and 50-day averages.
For traders, the Russell 2000 deserves particular attention. **If small caps continue to weaken while the major large-cap indexes remain above their key moving averages, market leadership is becoming increasingly
Monday’s U.S. Market Statistics
Monday’s market internals were decidedly bearish, particularly on the New York Stock Exchange. Both the NYSE and Nasdaq recorded negative breadth, while the number of new 52-week lows increased sharply. The NYSE also experienced a substantial increase in trading volume as the market declined, adding weight to the day’s negative price action.
New York Stock Exchange (NYSE): Market breadth on the NYSE was strongly negative and highly lopsided. There were 2,991 declining issues versus 1,534 advancing issues, producing a decliner-to-advancer ratio of 1.95:1—essentially two declining stocks for every advancing stock. Another 485 issues finished unchanged.
The deterioration was even more apparent in the 52-week statistics. The NYSE recorded 112 new 52-week highs and 234 new 52-week lows, compared with 167 new highs and 107 new lows on Friday.
New 52-week highs therefore declined by approximately 33%, while new 52-week lows more than doubled. The new-high-to-new-low ratio deteriorated dramatically to approximately 1:2 on Monday, compared with 9:4 on Friday and approximately 5:2 on Thursday.
That is a significant change in market character. The market went from having substantially more stocks reaching new highs than new lows to having twice as many stocks making new lows as new highs.
Trading volume provided another warning signal. NYSE volume reached approximately 5.57 billion shares, up 27% from Friday’s 4.38 billion shares.
A declining market accompanied by a sharp increase in volume generally deserves attention. In this case, the combination of negative breadth, a surge in new lows and substantially higher volume points to a meaningful deterioration in short-term market internals.
Adding to the weakness, energy was the only one of the NYSE’s eleven major sectors to finish higher on Monday. Weakness was therefore not concentrated in a small group of industries; it was broadly distributed across the market.
NYSE takeaway: The internal picture was clearly bearish. The market may be entering a period of short-term deterioration, although one session by itself is not sufficient to establish a sustained market downtrend.
Nasdaq Market Statistics: The Nasdaq also experienced negative breadth on Monday, marking the second consecutive session of declining breadth.
There were approximately 3,000 declining issues versus 1,905 advancing issues, producing a decliner-to-advancer ratio of approximately 1.57:1. Another 189 issues finished unchanged.
The 52-week statistics were particularly weak. The Nasdaq recorded only 62 new 52-week highs against 210 new 52-week lows, compared with 127 new highs and 119 new lows on Friday.
New 52-week highs therefore fell by approximately 50%, while new 52-week lows increased by roughly 76%. The resulting new-high-to-new-low ratio was approximately 1:3.4, or roughly one new high for every three to four new lows.
This is a substantial deterioration in market breadth and indicates that weakness was spreading beneath the headline Nasdaq index.
.
Nasdaq Price Action and Volume
The Nasdaq opened slightly below Friday’s close and initially advanced strongly. However, the early gains were subsequently surrendered, and following a hawkish tone from the Federal Reserve Chair, the index retreated and spent much of the afternoon trading roughly 100 points below the previous close.
Despite the negative breadth, the Nasdaq’s headline decline was relatively small. This creates an important distinction for traders: the index itself appeared relatively resilient, while its underlying internals were considerably weaker.
Nasdaq trading volume reached approximately 8.03 billion shares, down about 9% from Friday’s 8.77 billion shares.
Unlike the NYSE, therefore, the Nasdaq experienced a small decline accompanied by lower—not higher—volume. That makes Monday’s Nasdaq session somewhat less concerning from a volume-confirmation perspective, although the deterioration in breadth and new 52-week highs versus lows remains a significant warning.
NYSE vs. Nasdaq: What the Internals Are Saying
The two exchanges produced a similar message on breadth but an important difference in volume.
| Indicator | NYSE | Nasdaq |
|---|---|---|
| Decliners | 2,991 | 3,000 |
| Advancers | 1,534 | 1,905 |
| Decliner/Advancer Ratio | 1.95:1 | 1.57:1 |
| New 52-Week Highs | 112 | 62 |
| New 52-Week Lows | 234 | 210 |
| High/Low Ratio | 1:2 | 1:3.4 |
| Volume vs. Friday | +27% | -9% |
| Breadth | Bearish | Bearish |
The NYSE displayed the more concerning volume pattern, with substantially higher volume accompanying a decline.
The Nasdaq displayed the more concerning 52-week breadth pattern, with only 62 new highs against 210 new lows.
This divergence is worth watching. The Nasdaq and S&P 500 can remain technically strong even while their internal participation deteriorates. If that deterioration continues, however, it can eventually undermine the headline indexes.
Key Takeaways for Traders and Investors
- Market breadth: Clearly bearish on both exchanges.
- NYSE: Nearly two decliners for every advancer, with only one new high for every two new lows.
- Nasdaq: About 1.6 decliners for every advancer and roughly three to four new lows for every new high.
- 52-week statistics: A major deterioration on both exchanges, particularly on the Nasdaq.
- NYSE volume: Up 27% while the market declined—a potentially significant warning signal.
- Nasdaq volume: Down 9%, making the Nasdaq’s small price decline less concerning from a volume-confirmation standpoint.
- Sector breadth: Energy was the only NYSE sector to finish higher, indicating exceptionally broad selling pressure.
- Short-term outlook: Market conditions appear to be deteriorating, and traders should expect potentially greater volatility.
- Important caution: One session—or even two consecutive sessions—does not establish a new bear market. Confirmation requires sustained deterioration in price, breadth, volume and technical structure.
Bottom Line: Monday’s market internals were considerably weaker than the headline index performance suggested. The NYSE showed negative breadth, a sharp deterioration in its new-high/new-low relationship and a 27% increase in volume as the market declined. The Nasdaq also showed significant deterioration, particularly in its 52-week statistics, despite posting only a modest decline.
The most important development is the breadth deterioration beneath the major indexes. When fewer stocks are making new highs and substantially more stocks are making new lows, market participation is narrowing and the risk of further short-term weakness increases.
For traders, this does not yet mean that a major market reversal is confirmed. The more important question is what happens next: Do the major indexes begin breaking their key moving averages while breadth continues to deteriorate, or do the internals recover and the indexes stabilize?
Until that becomes clearer, the prudent interpretation is that the market’s short-term risk has increased and traders should treat rallies with greater selectivity while closely monitoring breadth, new highs versus new lows, volume and key technical support levels.
.
Monday’s U.S. Market Wrap-Up Report
Geopolitical Tensions Put U.S. Markets Under Pressure
Renewed hostilities between the United States and Iran weighed heavily on investor sentiment Monday, sending all four major U.S. equity indexes lower. Geopolitical developments in the Middle East have become an increasingly important market catalyst, and Monday was another clear example of how quickly headlines can overwhelm otherwise constructive market conditions.
The Dow Jones Industrial Average fell 374.09 points, or 0.70%, to 53,185.90. The S&P 500 declined 25.62 points, or 0.33%, to 7,686.14, while the Nasdaq Composite slipped only 31.53 points, or 0.12%, to 26,370.89. The Russell 2000 fell 15.92 points, or 0.54%, to 2,972.37.
The market was therefore broadly negative, but the selling was not uniform. The Nasdaq and S&P 500 demonstrated considerably better relative strength than the Dow and Russell 2000. Both indexes recovered significantly from their session lows, suggesting that buyers were willing to step in despite the geopolitical uncertainty.
For traders, this distinction is important. Monday was a weak market on the surface, but there were still areas of significant underlying strength.
Energy Was the Only Sector to Gain
The market’s sector performance clearly reflected the geopolitical backdrop.
Energy was the only one of the eleven major sectors to finish Monday in positive territory, gaining 1.89%. Renewed conflict involving Iran and the United States raised concerns about energy supplies and supported oil prices, providing a direct catalyst for energy stocks.
Every other major sector finished lower.
Technology declined only 0.19%, making it the second-best-performing sector and narrowly missing a positive close. Financials fell 0.56%, Basic Materials declined 0.85%, while Utilities was the weakest major sector, falling 1.02%.
The exceptionally narrow sector leadership is worth noting. When energy is the only sector advancing, it suggests that investors are positioning around the geopolitical and commodity implications of the conflict rather than broadly increasing equity exposure.
Market Internals Were More Bearish Than the Indexes Suggested
Monday’s market internals painted a considerably weaker picture than the headline Nasdaq and S&P 500 declines might suggest.
On the NYSE, declining issues outnumbered advancing issues by 2,991 to 1,534, producing a decliner-to-advancer ratio of 1.95:1. The exchange recorded 112 new 52-week highs versus 234 new 52-week lows, a dramatic deterioration from Friday’s 167 new highs and 107 new lows.
The new-high-to-new-low ratio deteriorated to approximately 1:2, compared with 9:4 on Friday. At the same time, NYSE volume increased approximately 27% to 5.57 billion shares.
That combination—negative breadth, sharply deteriorating new-high/new-low statistics and higher volume on a declining market—is a warning signal for traders.
The Nasdaq also showed weak internals. Approximately 3,000 stocks declined versus 1,905 advancers, producing a decliner-to-advancer ratio of approximately 1.57:1. There were only 62 new 52-week highs against 210 new 52-week lows, producing an extremely weak new-high/new-low relationship of roughly 1:3.4.
Nasdaq volume, however, declined approximately 9% from Friday. That makes the Nasdaq’s modest 0.12% decline somewhat less concerning from a volume-confirmation perspective than the NYSE’s heavier-volume selloff.
The important message is that the indexes held up better than the average stock.
.
Technology Shows Relative Strength
Technology was down only 0.19% on Monday, and several major technology names actually advanced. This helps explain why the Nasdaq substantially outperformed the Dow and Russell 2000.
The Nasdaq also opened slightly below Friday’s close, rallied strongly during the session, and then surrendered those gains following a hawkish tone from the Federal Reserve Chair. The index subsequently stabilized around 100 points below the previous close for much of the afternoon.
The ability of the Nasdaq to recover from its session low is encouraging. However, the weak underlying breadth means traders should not assume that the index’s resilience automatically signals a new upward move.
Tesla Leads the Individual Stock Action: Tesla (TSLA) was one of Monday’s strongest large-cap technology-related names, surging 5.51% on exceptionally heavy volume of approximately 61.7 million shares to close at $367.95.
The technical picture remains mixed. Tesla is trading around its 25-day moving average and is currently straddling its 50-day moving average, but remains clearly below its 200-day moving average.
That creates an interesting short-term trading setup but a more questionable long-term investment picture.
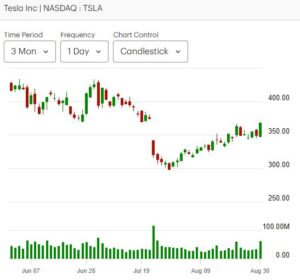
For active traders, Tesla’s combination of a 5.51% gain and very heavy volume makes it a stock worth watching. A continuation of the move accompanied by strong volume could improve the technical picture. Conversely, failure to hold the short-term moving averages could quickly turn Monday’s breakout attempt into a failed rally.
Longer-term investors should remain more cautious while the stock remains below its 200-day moving average.
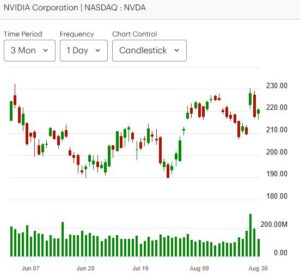
Nvidia Extends Its Advance: Nvidia (NVDA) gained 1.48%, closing at $220.78 on approximately 124.6 million shares.
More importantly, Nvidia has now advanced for two consecutive sessions, something that has not occurred frequently in the recent trading pattern.
Nvidia’s strength is particularly relevant because the stock is one of the most influential names in the technology and semiconductor complex. Continued strength in Nvidia could help support the Nasdaq and broader technology sector if geopolitical tensions begin to ease.
For now, however, the broader market environment remains headline-sensitive.
Semiconductor Stocks Show Strength
Several semiconductor and memory-related stocks also posted impressive gains.
SanDisk (SNDK) jumped 5.50%, closing at $1,566.70 on approximately 23.3 million shares.
Micron Technology (MU) gained 2.77%, closing at $958.93 with approximately 22.5 million shares changing hands.
The strength in Nvidia, SanDisk and Micron is noteworthy because it demonstrates that selective buying remains active even on a broadly negative market day.
This is an important distinction for traders. The market is not experiencing indiscriminate selling. Rather, investors appear to be rotating toward selected areas of technology and energy while reducing exposure elsewhere.
Technical Picture Remains Mixed
Despite Monday’s decline, the broader technical picture for the major large-cap indexes has not broken down.
The S&P 500 and Nasdaq remain above their 25-day, 50-day and 200-day moving averages, preserving their broader bullish structures.
The Dow is now testing its 25-day moving average, although it remains well above its 50-day and 200-day averages.
The Russell 2000 remains the technical weak spot. After being hit hard on Friday and again on Monday, the index has fallen back below both its 25-day and 50-day moving averages. Small caps could therefore remain under pressure in the short term, particularly while interest rates remain elevated.
The divergence between the major indexes is becoming increasingly important: large-cap technology remains relatively strong, while small caps are showing considerably greater technical deterioration.
Key Takeaways for Traders and Investors
- Market tone: Negative, with geopolitical risk dominating Monday’s trading.
- Sector leadership: Energy was the only one of eleven major sectors to finish higher, gaining 1.89%.
- Nasdaq: The strongest major index, falling only 0.12% and recovering substantially from its session low.
- S&P 500: Down 0.33%, but still above its 25-day, 50-day and 200-day moving averages.
- Dow: Down 0.70% and now testing its 25-day moving average.
- Russell 2000: Down 0.54% after Friday’s 1.39% decline and now below both its 25-day and 50-day moving averages.
- Market breadth: Bearish on both the NYSE and Nasdaq, with decliners substantially outnumbering advancers.
- 52-week statistics: A major warning signal, with new lows dramatically exceeding new highs on both exchanges.
- NYSE volume: Up 27% while the market declined, adding significance to the selling pressure.
- Technology: Relatively strong despite the negative market, with Nvidia, Tesla, SanDisk and Micron all advancing.
- Tesla: Strong 5.51% move on heavy volume, but the stock remains below its 200-day moving average.
- Interest rates: Higher yields remain a headwind, particularly for small-cap companies and growth-sensitive stocks.
- Trading environment: Highly headline-driven and therefore potentially volatile.
Bottom Line
Monday was a negative session for U.S. equities, but it was not a uniform selloff. Geopolitical tensions drove investors toward energy stocks while broad market breadth deteriorated sharply. The NYSE’s combination of higher volume, negative breadth and a surge in new 52-week lows is particularly concerning.
At the same time, the Nasdaq and S&P 500 showed resilience, recovering from their session lows and remaining above their major moving averages. The strength in Tesla, Nvidia, SanDisk and Micron also indicates that there is still meaningful buying interest in selected technology stocks.
The market therefore appears to be at an interesting crossroads. The indexes are holding their technical structures, but market internals are deteriorating. That divergence deserves close attention.
For traders, this is a market where stock selection and risk management are becoming increasingly important. Strong individual names can continue to advance even while the overall market weakens, but traders should be prepared to reverse positions quickly if geopolitical headlines trigger another broad risk-off move.
For investors, the evidence does not yet confirm a major market reversal. However, the deterioration in breadth and the sharp increase in new 52-week lows suggest that the market’s short-term risk has increased.
The next few sessions should provide an important test: if the S&P 500 and Nasdaq hold their key moving averages while breadth improves, Monday’s weakness may prove to be another temporary correction. If breadth continues to deteriorate and the major indexes begin breaking technical support, the current warning signals could develop into a more significant market correction.
.
NOTICE TO READERS
The Canadian Vanguard Stock Market is about empowering you to build and manage your wealth by yourself. There is certainly no magic in managing finances or wealth but one needs to know what to do and commit to doing what is needed. When you are ready to start the journey to Take Charge and Put Your Destiny In Your Own Hands, start with reading The Canadian Vanguard every market day. If and when you need more related information or to advertise your business products or services in The Canadian Vanguard, Contact Us
Our readers are strongly advised to conduct their own research into individual stocks before making a purchase decision. In addition, investors are advised that past stock performance is no guarantee of future price appreciation. Any recommendation is not a guarantee of any particular stock’s future prices, and The Canadian Vanguard accepts no responsibility or liability for investors’ or readers’ purchases.
Stocks In The News/ Stocks To Watch and Market Strategy will soon be available only to Paying Subscribers. The dollar sign “$” in the Toronto Market section in the articles only stands for Canadian dollar and in the US market section “$” stands for US dollar.
(c) This article is published by The Canadian Vanguard on August 31, 2026