







Indexes Finish Mixed as Long-Term Bond Yields and Oil Prices Slip
The Canadian Vanguard Stock Market Report Monday August 24, 2026 Edition
.
The Toronto Market
Monday Toronto Market Index
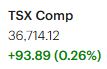
The Toronto S&P/TSX Composite Index advanced 93.89 points, or 0.26%, to close at 36,714.12.
The TSX has now recorded two consecutive sessions of gains. Today’s rebound was broad-based, with gains across a wider range of sectors compared with previous sessions, when only a handful of sectors advanced. This broader participation instills greater confidence among investors and suggests that the market’s underlying strength remains intact.
The TSX internals also remain strong and robust. More importantly, the index continues to trade well above its 25-day, 50-day, and 200-day moving averages. This is a positive technical signal and indicates that the broader uptrend remains firmly in place.

.
Monday’s TSX Market Statistics
At the TSX, market breadth was mixed beneath the surface, with declining issues outnumbering advancing issues. There were 1,224 decliners versus 945 advancers, producing a decliner-to-advancer ratio of 1.29 to 1, or roughly six decliners for every five advancers. A total of 151 issues were unchanged.
Despite the negative daily breadth, the broader market internals remained constructive. The exchange recorded 62 new 52-week highs and 33 new 52-week lows, compared with 60 new highs and 60 new lows on Friday. The number of new 52-week highs remained essentially unchanged, while new 52-week lows fell by almost 50%.
More importantly for traders and investors, the new-high/new-low ratio improved significantly to almost 2:1, compared with just 6:5 on Friday. This improvement indicates that fewer stocks are participating on the downside while the number of stocks reaching new highs remains elevated. Taken together, the data point to firm and improving market internals, reinforcing the bullish trend observed on Friday.
TSX trading volume totaled 431,291,884 shares, down approximately 2% from the 440,248,990 shares traded on Friday. The modest decline in volume, despite the continued advance in the index, does not materially weaken the overall technical picture. The combination of sustained new highs, a sharp reduction in new lows, and relatively stable volume remains a constructive signal for the broader TSX trend.
.
Monday’s Toronto TSX Market Wrap-Up Report
.
TSX Extends Winning Streak
The Toronto S&P/TSX Composite Index advanced 93.89 points, or 0.26%, to close at 36,714.12, extending its winning streak to two consecutive sessions. While Monday’s gain was less pronounced than Friday’s advance, it was still a constructive session, particularly because the recovery was broad-based rather than concentrated in only a handful of sectors.
From a technical perspective, the broader trend remains firmly constructive. The TSX continues to trade well above its 25-day, 50-day, and 200-day moving averages, indicating that the primary and intermediate-term uptrends remain intact.
The market’s internal statistics also provide reasons for cautious optimism. Although decliners outnumbered advancers on Monday, the number of stocks setting new 52-week lows fell sharply, while new 52-week highs remained elevated. That combination suggests that underlying market strength remains healthier than the headline advance/decline numbers alone might indicate.
Market Breadth and Internals
Monday’s breadth was mixed, with 1,224 decliners versus 945 advancers, producing a decliner-to-advancer ratio of 1.29 to 1. Another 151 issues were unchanged.
However, the new-high/new-low statistics were considerably more encouraging. The TSX recorded 62 new 52-week highs and only 33 new 52-week lows, compared with 60 new highs and 60 new lows on Friday.
The number of new highs therefore remained essentially unchanged, while new lows declined by almost 50%. The resulting new-high-to-new-low ratio improved to almost 2:1, compared with approximately 6:5 on Friday.
For traders and investors, this is an important distinction: headline breadth was negative, but the deeper market internals remained constructive. Fewer stocks are making new lows while the number reaching new highs remains elevated. That is generally a healthier setup for the broader market than a session in which both decliners and new lows expand sharply.
TSX trading volume totaled 431.29 million shares, approximately 2% below Friday’s 440.25 million shares. The modest decline in volume does not materially alter the overall technical picture.
Seven of Ten Major Sectors Advance
Sector participation was another positive feature of Monday’s session. Seven of the TSX’s ten major sectors finished higher, indicating that the advance was relatively broad-based.
Basic Materials once again led the market, gaining 1.26% and extending its leadership for a third consecutive session. Precious- and industrial-metals miners continued to feature prominently among the market’s strongest performers.
Other notable advancing sectors included:
- Consumer Durables & Services: +1.14%
- Telecommunications Services: +1.01%
- Technology: +0.71%
- Utilities: +0.64%
- Healthcare: +0.63%
- Financials: +0.20%
The main areas of weakness were Consumer Discretionary, which fell 1.68%, and Energy, which declined 0.45%.
The continued leadership from Basic Materials is particularly noteworthy. Traders should continue monitoring whether strength in gold and other metals-related equities broadens into additional sectors or remains concentrated within the mining complex.
Bonds, Yields and Gold
The Canadian 10-year government bond yield eased to 3.68%, down approximately 0.08 percentage points from the previous session. The U.S. 10-year Treasury yield also moved lower, trading near 4.70%.
Bond-market volatility remains an important consideration for equity investors. A sustained sell-off in government bonds pushes bond prices lower and yields higher, potentially increasing long-term borrowing costs and putting pressure on equity valuations. Conversely, falling yields can provide some relief to rate-sensitive sectors.
Gold continued to attract attention, reaching a three-month high, supported by weakness in the U.S. dollar and expectations surrounding U.S. Treasury buyback plans.
The combination of a softer U.S. dollar and lower Treasury yields can be supportive for gold. However, traders should remain alert to changes in real yields, inflation expectations and the direction of the U.S. dollar, as these factors can quickly alter the precious-metals trade.
Oil Remains a Key Risk Factor
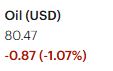
Oil prices moved lower on Monday as markets awaited further details regarding the escalating U.S.-Iran situation.
Brent crude declined approximately 1.7%, trading around the $91-per-barrel area.
For equity investors, the direction of crude oil remains important. A sustained rise in oil prices could increase inflationary pressure and complicate the interest-rate outlook, potentially limiting the upside for broader equity indexes. For now, the decline in crude prices removes some immediate inflation pressure from the market.
Energy stocks consequently lagged the broader market on Monday, falling 0.45% as a group.
Earnings Calendar: BMO and BNS in Focus
Earnings remain an important source of individual-stock volatility, particularly for traders positioning ahead of major financial-sector reports.
Bank of Montreal (BMO) and Bank of Nova Scotia (BNS) are scheduled to report Q3 2026 earnings before the market opens on Tuesday, August 25.
National Bank of Canada (NA) is scheduled to report on Wednesday, August 26.
Given the importance of financial stocks to the TSX, these earnings releases could influence both individual bank shares and the broader Financials sector. Traders should watch not only the headline earnings numbers but also credit quality, provisions for credit losses, net interest margins, capital levels and management guidance.
Stocks on the Radar
Gold and precious-metals stocks continued to dominate the list of notable TSX performers.
Among Monday’s notable gainers:
- Lundin Gold Inc. (LUG): +3.95%, closing at $104.78, with approximately 677,000 shares traded.
- Seabridge Gold Inc. (SEA): +10.48%, closing at $45.86, with approximately 209,000 shares traded.
- Franco-Nevada Corporation (FNV): +2.24%, closing at $374.01, with approximately 348,000 shares traded.
- Wheaton Precious Metals Corporation (WPM): +2.24%, closing at $221.94, with approximately 1.16 million shares traded.
The continued outperformance of gold-related equities is consistent with the strength in gold prices and the leadership of the Basic Materials sector.
Outside the mining sector, Aritzia Inc. (ATZ) and Thomson Reuters Corporation (TRI) also deserve attention. Aritzia gained 2.36% to close at $134.29, on approximately 770,000 shares, while Thomson Reuters advanced 3.32% to $150.21, with approximately 524,000 shares traded.
These names may be worth keeping on traders’ and investors’ watchlists for continued momentum and confirmation in subsequent sessions.
Key Takeaways for Traders and Investors
- The TSX remains technically bullish. The index has posted two consecutive gains and remains well above its 25-, 50- and 200-day moving averages.
- Market internals are more encouraging than the advance/decline ratio suggests. Decliners outnumbered advancers, but new 52-week lows fell by almost 50% while new highs remained elevated.
- New-high/new-low momentum improved materially. Monday’s ratio was nearly 2:1, a significant improvement from Friday’s approximately 6:5 ratio.
- Sector participation was broad. Seven of ten major sectors advanced, reducing concerns that the TSX’s gains are being driven exclusively by a small group of stocks.
- Basic Materials remains the sector to watch. Its third consecutive day of leadership, combined with strength in gold miners, keeps the precious-metals complex firmly on the radar.
- Gold remains a major momentum trade. Traders should monitor gold, the U.S. dollar and Treasury yields for confirmation or reversal signals.
- Oil remains a potential macro headwind. A sustained move higher in crude could revive inflation concerns and pressure equity valuations.
- Bank earnings could drive near-term volatility. BMO and BNS report Tuesday, followed by National Bank on Wednesday.
- For momentum traders, watch the leaders—but demand confirmation. Strong price performance accompanied by rising volume and continued relative strength would provide a stronger signal than a one-day move alone.
Bottom Line
Monday’s session was constructive but not decisively bullish. The TSX’s 0.26% advance was accompanied by broad sector participation, continued strength in the Basic Materials complex, a sharp reduction in new 52-week lows and a market index trading comfortably above its key moving averages.
The negative advance/decline ratio is worth monitoring, but the stronger new-high/new-low statistics suggest that the underlying uptrend remains healthy for now.
For traders, the key question heading into Tuesday is whether the TSX can maintain its upward momentum while market leadership broadens and the internals continue to improve. For investors, the combination of strong technical positioning, resilient market internals and continued leadership from materials provides a constructive backdrop, although bond yields, oil prices and upcoming bank earnings remain important risks to watch.
.
The US Markets
Monday’s U.S. Market Indexes
U.S. equity indexes finished mixed on Monday as investors navigated a heavy week of potentially market-moving developments. The Dow Jones Industrial Average rose 140.15 points, or 0.26%, to 53,417.16, while the S&P 500 declined 21.51 points, or 0.28%, to 7,652.86. The Nasdaq Composite fell 200.26 points, or 0.76%, to 25,980.19, while the Russell 2000 dropped 22.79 points, or 0.76%, to 2,995.08.

The divergence between the indexes was notable. The Dow managed to finish higher, while the more growth- and risk-sensitive Nasdaq Composite and Russell 2000 both came under pressure. This suggests that investors were more defensive Monday, with selling concentrated in areas of the market that are generally more sensitive to changes in interest rates, economic expectations and risk sentiment.
A Heavy Week of Market-Moving Events
Monday’s trading was influenced by developments surrounding the U.S.-Iran conflict and the latest U.S.-Canada tariff negotiations, which concluded over the weekend without a firm signed agreement. The lack of resolution leaves an additional layer of uncertainty for investors and traders.
The remainder of the week is packed with potential catalysts.
One of the most important events will be Nvidia Corporation’s earnings report, scheduled for release after the market closes on Wednesday. Given Nvidia’s enormous influence on the technology sector and its importance to the artificial-intelligence trade, the results and, perhaps more importantly, management’s forward guidance could have a significant impact on the Nasdaq and broader technology stocks.
Investors will also be watching the annual Jackson Hole Economic Symposium, where Federal Reserve officials traditionally provide important insights into monetary policy and the economic outlook. Comments from the Fed Chair can be particularly market-moving because they can quickly alter expectations for interest rates.
With geopolitics, trade negotiations, major corporate earnings and Federal Reserve policy all competing for investors’ attention, uncertainty is likely to remain elevated throughout the week.
.
Technical Picture: Nasdaq Shows Early Signs of Pressure
Monday’s weakness in the Nasdaq deserves attention from technical traders.
The Nasdaq Composite slipped just below its 25-day moving average, although it remains comfortably above both its 50-day and 200-day moving averages. The loss of the 25-day average is therefore not yet a major technical breakdown, but it is a short-term warning signal that traders should monitor.
The S&P 500 remains well above its 50-day and 200-day moving averages, preserving its broader bullish structure despite Monday’s modest decline.
The Russell 2000 is currently hugging its 25-day moving average. Because small-cap stocks tend to be more sensitive to economic and financial conditions, the Russell’s ability to hold this level could provide an important indication of near-term risk appetite.
What Monday’s Action Means for Traders and Investors
The market did not experience a broad-based breakdown on Monday, but the relative weakness of the Nasdaq and Russell 2000 is worth watching.
The key issue is whether Monday’s declines represent a temporary pause ahead of several major catalysts or the beginning of a deeper short-term correction.
For now, the broader technical picture remains constructive because the major indexes continue to trade above their 50-day and 200-day moving averages. However, the Nasdaq’s move below its 25-day average and the Russell 2000’s proximity to that level suggest that short-term momentum has weakened.
Key Takeaways for Traders and Investors
- The U.S. market is entering a high-risk event week. Geopolitical developments, tariff negotiations, Nvidia earnings and Federal Reserve commentary could all generate significant volatility.
- The Dow showed relative strength, finishing higher while the Nasdaq and Russell 2000 declined 0.76%.
- The Nasdaq is the main short-term technical concern. It has slipped below its 25-day moving average but remains above its 50-day and 200-day averages.
- The Russell 2000 is at an important technical level, currently testing or closely tracking its 25-day moving average.
- The S&P 500 remains technically healthy, with the index still well above its 50-day and 200-day moving averages.
- Nvidia earnings could be a major market catalyst Wednesday evening. Traders should expect the possibility of substantial volatility in technology and AI-related stocks.
- Federal Reserve communication at Jackson Hole could reshape interest-rate expectations. Changes in rate expectations could have an outsized effect on growth stocks and small caps.
- Geopolitical and trade uncertainty remain significant risks. Investors should be prepared for sharp moves in either direction as new developments emerge.
Bottom Line
Monday’s mixed close does not, by itself, signal a major change in the U.S. market’s broader uptrend. The S&P 500 remains well positioned technically, while the Nasdaq and Russell 2000 are showing some short-term weakness.
The more important test comes later this week. Nvidia earnings, Jackson Hole and Federal Reserve commentary, along with developments involving the U.S.-Iran conflict and U.S.-Canada trade negotiations, could determine whether Monday’s weakness develops into a broader correction or proves to be nothing more than a temporary pause.
For traders, risk management and position sizing are particularly important this week. For investors, the key levels to monitor are the major indexes’ 25-day moving averages in the short term and their 50-day moving averages should selling pressure intensify.
.
Monday’s U.S. Market Statistics
NYSE Market Internals: Market breadth on the New York Stock Exchange was negative but not severely deteriorated on Monday. Declining issues outnumbered advancing issues, with 2,330 decliners versus 2,151 advancers and 543 issues unchanged. This produced a decliner-to-advancer ratio of 1.08 to 1, meaning there were only slightly more decliners than advancers.
The NYSE recorded 158 new 52-week highs and 116 new 52-week lows, compared with 214 new highs and 118 new lows on Friday.
The new-high/new-low ratio therefore weakened to approximately 4:3, compared with roughly 9:5 on Friday. The decline in new highs is worth noting, although the number of new lows fell only marginally. This indicates that the market’s internal strength softened somewhat but did not experience a major deterioration.
Total NYSE volume reached 4.53 billion shares, approximately 1% below Friday’s 4.59 billion shares. With the NYSE index declining while trading volume remained essentially unchanged, there was no major increase in selling participation.
NYSE Takeaway: The NYSE’s market breadth was poor, but the broader internal picture remains constructive rather than bearish. The principal change from Friday was the reduction in new 52-week highs and the resulting deterioration in the new-high/new-low ratio. Traders should monitor whether this weakness continues over the next few sessions or proves to be a temporary pause.
NASDAQ Market Internals: The NASDAQ showed more pronounced weakness than the NYSE. There were 2,934 decliners versus 1,955 advancers, with 436 issues unchanged. The resulting decliner-to-advancer ratio was 1.50 to 1, or approximately three decliners for every two advancers.
This represents relatively poor market breadth and confirms that Monday’s weakness was more pronounced among technology and growth-oriented stocks.
The NASDAQ recorded 141 new 52-week highs and 139 new 52-week lows, compared with 152 new highs and 110 new lows on Friday.
The number of new highs declined approximately 7%, while new lows increased materially from Friday. Consequently, the new-high/new-low relationship moved much closer to 1:1. This is less encouraging than the NYSE’s 4:3 ratio and suggests that the NASDAQ’s internal momentum weakened more noticeably.
Nevertheless, the broader internal picture remains reasonably healthy. The NASDAQ has recovered from the sharp sell-off earlier in the week, and Monday’s decline has not yet resulted in a decisive breakdown in its underlying market structure.
NASDAQ trading volume totaled 7.53 billion shares, approximately 1% below Friday’s 7.61 billion shares. Given the relatively small change in volume, Monday’s decline did not attract a significant increase in trading activity. The lack of a meaningful volume expansion suggests that investor conviction did not change dramatically from the previous session.
NASDAQ Takeaway: The NASDAQ displayed weaker breadth and less favorable new-high/new-low statistics than the NYSE, consistent with the 0.76% decline in the Composite Index. However, the virtually unchanged trading volume suggests that Monday’s selling was not accompanied by a significant surge in participation.
For traders, the key question is whether the NASDAQ can stabilize around its short-term technical levels and whether new 52-week highs begin to expand again. A continued decline in new highs accompanied by increasing new lows would be a more meaningful warning signal.
Key Takeaways for Traders and Investors
- Market breadth was negative on both exchanges, with the NASDAQ showing considerably greater weakness than the NYSE.
- NYSE breadth was only mildly negative, with a 1.08:1 decliner-to-advancer ratio.
- NASDAQ breadth was weaker, with a 1.50:1 ratio, or roughly three decliners for every two advancers.
- NYSE internals remain broadly constructive, although the new-high/new-low ratio deteriorated from approximately 9:5 to 4:3.
- NASDAQ internals softened more noticeably, with new highs and new lows nearly equal at 141 versus 139.
- Trading volume was essentially unchanged on both exchanges, declining only about 1% from Friday. This is important because Monday’s market weakness was not accompanied by a major increase in selling volume.
- The internal picture has weakened but has not turned decisively bearish. The next few sessions will be important in determining whether Monday’s deterioration is simply consolidation or the beginning of a broader loss of momentum.
- The NASDAQ deserves closer monitoring. Its weaker breadth and near 1:1 new-high/new-low ratio make it more vulnerable if selling pressure increases.
- The NYSE remains relatively healthier, supported by a still-positive new-high/new-low balance and stable trading volume.
Bottom Line
Monday’s market statistics point to moderating internal strength rather than a confirmed bearish reversal.
The NYSE experienced poor breadth, but its new-high/new-low ratio remained positive at approximately 4:3. The NASDAQ was weaker, with a 1.50:1 decliner-to-advancer ratio and nearly equal numbers of new 52-week highs and lows.
The most reassuring feature of Monday’s statistics is that volume remained virtually unchanged despite the declines in the major indexes. There was no significant expansion in selling activity.
For now, the market remains in a cautiously bullish but increasingly selective environment. Traders should watch the next few sessions for three things: expanding new lows, deteriorating breadth and a meaningful increase in downside volume. A combination of all three would provide considerably stronger evidence that the current pullback is becoming a broader correction.
.
NOTICE TO READERS
The Canadian Vanguard Stock Market is about empowering you to build and manage your wealth by yourself. There is certainly no magic in managing finances or wealth but one needs to know what to do and commit to doing what is needed. When you are ready to start the journey to Take Charge and Put Your Destiny In Your Own Hands, start with reading The Canadian Vanguard every market day. If and when you need more related information or to advertise your business products or services in The Canadian Vanguard, Contact Us
Our readers are strongly advised to conduct their own research into individual stocks before making a purchase decision. In addition, investors are advised that past stock performance is no guarantee of future price appreciation. Any recommendation is not a guarantee of any particular stock’s future prices, and The Canadian Vanguard accepts no responsibility or liability for investors’ or readers’ purchases.
Stocks In The News/ Stocks To Watch and Market Strategy will soon be available only to Paying Subscribers. The dollar sign “$” in the Toronto Market section in the articles only stands for Canadian dollar and in the US market section “$” stands for US dollar.
(c) This article is published by The Canadian Vanguard on August 24, 2026



