
Major Indexes Under Pressure as Bond Yields Surge Despite Slightly Lower Oil Prices
The Canadian Vanguard Stock Market Report Tuesday, September 29, 2026, Edition
.
The Toronto Market
Tuesday’s Toronto Market Index
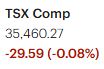
The S&P/TSX Composite Index declined 29.59 points, or 0.08%, on Tuesday to close at 35,460.27.
The TSX spent most of the session in negative territory, reflecting a modestly bearish tone across the market. Market breadth was also negative, indicating that the weakness was relatively broad rather than concentrated in a small number of index components.
The session low was established within the first half hour of trading, after which the index recovered a portion of its early decline. The fact that the TSX finished well above its intraday low suggests that selling pressure moderated as the session progressed, although the recovery was not sufficient to return the index to positive territory.
From a technical perspective, the short-term trend has weakened further. The TSX is now trading below both its 25-day and 50-day moving averages, placing the index in a less constructive near-term technical position. However, the index remains at a clear distance above its 200-day moving average, leaving the longer-term trend comparatively intact.
The current setup therefore reflects a divergence between weakening short-term momentum and a still-supportive longer-term trend. A sustained move below the 50-day moving average would warrant attention, while the 200-day moving average remains an important reference point for the broader market trend.
Tuesday’s TSX Market Statistics
Market breadth on the TSX was decisively negative on Tuesday, with 1,388 declining issues compared with 878 advancing issues and 121 issues unchanged. This produced a decliner-to-advancer ratio of 1.58 to 1, meaning there were approximately three declining issues for every two advancing issues.
The deterioration in the market’s internal indicators was also evident in the 52-week statistics. The TSX recorded 29 new 52-week highs and 286 new 52-week lows, compared with 27 new highs and 213 new lows on Monday. The new-high-to-new-low ratio therefore weakened significantly, falling to approximately 1:10 from 1:8 on Monday. More importantly, new 52-week lows continued to substantially outnumber new 52-week highs.
The number of new 52-week highs increased only marginally from the previous session, while new 52-week lows increased by approximately 34%. This widening imbalance indicates that weakness remains broad beneath the surface of the index and suggests that the deterioration is not limited to a small group of TSX constituents.
Trading volume, however, did not confirm an increase in selling intensity. Total TSX volume was approximately 405.7 million shares, down 14% from the 466.9 million shares traded on Monday. The combination of a modest decline in the index, weaker breadth, and a substantial expansion in new 52-week lows points to continued deterioration in the market’s internal structure, rather than a high-volume liquidation session.
Overall, the TSX’s internal indicators remain weak. The negative advance-decline balance and, in particular, the growing disparity between new 52-week lows and new 52-week highs warrant a more cautious approach to the market in the near term. While one session does not establish a trend on its own, the breadth and new-low data suggest that the market’s underlying technical condition has weakened further.
Tuesday’s Toronto TSX Market Wrap-Up Report
Tuesday was a challenging session for the Toronto market, with the S&P/TSX Composite Index closing down 29.59 points, or 0.08%, at 35,460.27. The index spent most of the session in negative territory, although it recovered meaningfully from the session low established during the first half hour of trading.
Market breadth remained weak. Declining issues outnumbered advancing issues by 1,388 to 878, producing a decliner-to-advancer ratio of 1.58 to 1. This indicates that the market weakness was relatively broad and was not simply the result of weakness in a handful of large-cap stocks.
The TSX’s internal indicators also deteriorated further. There were only 29 new 52-week highs compared with 286 new 52-week lows, producing a new-high-to-new-low ratio of approximately 1:10. By comparison, Monday recorded 27 new highs and 213 new lows. The particularly notable development was the 34% increase in new 52-week lows, while new highs increased only marginally.
Trading volume was approximately 405.7 million shares, 14% below Monday’s 466.9 million shares. Consequently, Tuesday was not a high-volume liquidation session. Nevertheless, the combination of negative breadth, a growing number of new 52-week lows, and the TSX trading below its 25-day and 50-day moving averages points to a weakening short-term market structure.
Sector Performance
Sector performance was mixed, but the leadership was concentrated in a relatively small number of areas.
Technology was the strongest-performing major sector, gaining 0.84%. Consumer Discretionary Goods & Services followed with a gain of 0.69%, while Durable Consumer Goods & Services advanced 0.16%. Retail-related stocks were among the stronger areas of the market.
Financials, which had advanced during the previous two sessions, reversed lower on Tuesday and declined 0.70%. The weakness in the Financials sector was notable given its substantial representation in the TSX and its importance to the overall direction of the Canadian market.
Basic Materials was the session’s weakest sector, falling a substantial 3.43%. Given the significant presence of resource-oriented companies within the TSX, pronounced weakness in Basic Materials can place considerable pressure on the broader index.
The contrast between relatively strong performance in Technology and Consumer-related stocks and significant weakness in Basic Materials and Financials contributed to the mixed character of Tuesday’s session.
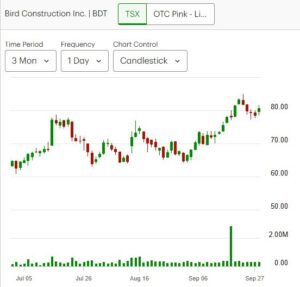
Shopify and Bird Construction Inc. Remain Technically Strong
Shopify Inc. (SHOP) was one of the notable individual performers on Tuesday. The stock gained 2.86% on approximately 1.8 million shares of volume, extending its advance to a second consecutive session.
More importantly from a technical perspective, Shopify remains above its 25-day, 50-day, and 200-day moving averages. This places the stock in a considerably stronger technical position than the broader TSX, which is currently trading below its 25-day and 50-day moving averages.
The stock’s ability to maintain its position above these key moving averages while the broader market remains under pressure is worth monitoring. Continued strength would provide additional evidence that the stock is displaying relative strength within the current market environment.
Canadian Banks Under Pressure
The major Canadian banks continued to underperform on Tuesday, with all six of the large-cap banks closing lower.
The weakness in the Financials sector is worth monitoring because of the sector’s considerable influence on the TSX. After two consecutive sessions of gains, Tuesday’s decline represents a reversal in short-term momentum.
There are several factors that investors may be considering when evaluating the banks, including the broader economic environment and ongoing uncertainty surrounding trade and tariff developments. However, the most immediate market observation is technical: the banking group was unable to sustain its recent strength and contributed to Tuesday’s weakness in the broader Financials sector.
Market Technical Picture
From a technical standpoint, Tuesday’s session added to the evidence of weakening short-term momentum.
The TSX is now below both its 25-day and 50-day moving averages. At the same time, the index remains well above its 200-day moving average, meaning that the longer-term trend has not deteriorated to the same extent as the short-term trend.
The internal market statistics are less constructive. The advance-decline balance was negative, new 52-week lows substantially outnumbered new highs, and the number of new lows increased significantly from the previous session.
This divergence between the index’s position relative to its long-term moving average and the weakness evident in market breadth is important. The index itself remains above its longer-term trend indicator, but a growing number of individual stocks are experiencing substantial deterioration beneath the surface.
Key Takeaways for Traders and Investors
- Short-term momentum has weakened. The TSX is below both its 25-day and 50-day moving averages, indicating deterioration in the near-term technical picture.
- Market breadth remains a concern. Decliners outnumbered advancers by 1.58 to 1, confirming that Tuesday’s weakness was relatively broad.
- New lows are the most significant internal warning signal. There were 286 new 52-week lows versus only 29 new highs. The number of new lows also increased approximately 34% from Monday.
- The longer-term trend remains more constructive than the short-term picture. The TSX continues to trade clearly above its 200-day moving average, which remains an important longer-term technical reference point.
- Basic Materials bears watching. The sector’s 3.43% decline was particularly significant given the resource-heavy composition of the Canadian market.
- Financials warrant attention. All six major Canadian banks declined, while the Financials sector gave back some of its recent gains.
- Relative strength remains important. Shopify’s ability to gain 2.86% and remain above its 25-day, 50-day, and 200-day moving averages stands in contrast to the broader market’s weaker technical condition.
- Tuesday was not a high-volume selloff. Overall TSX volume declined 14% from Monday. The market’s internal weakness therefore appears more significant in breadth and new-low statistics than in outright trading volume.
Bottom Line
Tuesday’s session reinforced the message that the TSX’s short-term market condition is weakening, even though the longer-term trend remains above the 200-day moving average. For traders, the deterioration in breadth and the sharp increase in new 52-week lows are important signals to monitor. For investors, the key issue is whether this short-term weakness develops into a broader deterioration in the longer-term trend.
The market’s next few sessions will be particularly important in determining whether Tuesday’s weakness represents a temporary pullback or the beginning of a more sustained deterioration in market internals.
.
The US Markets
Monday’s U.S. Market Indexes
U.S. equities opened the week on a broadly weaker note, with all four major indexes finishing lower on Monday. The Dow Jones Industrial Average declined 131.59 points, or 0.26%, to close at 51,349.92. The S&P 500 slipped 12.85 points, or 0.17%, to 7,670.84, while the Nasdaq Composite edged lower by 22.84 points, or 0.09%, to 26,797.54. The Russell 2000 was the weakest of the four major indexes, falling 9.99 points, or 0.35%, to 2,807.92.
The session reflected a generally difficult trading environment, with weakness extending across large-cap, technology-oriented, and small-cap equities. Small-cap stocks continued to underperform, with the Russell 2000 posting the largest percentage decline among the major indexes.
Rising Treasury Yields Remain a Headwind
The continued rise in Treasury yields remains an important consideration for equity investors, particularly in the small-cap segment. Smaller companies tend to be more sensitive to borrowing costs and financial conditions, making higher interest rates and elevated yields a potential headwind to earnings growth and valuations.
The combination of higher Treasury yields and elevated oil prices is creating an increasingly challenging macroeconomic backdrop for equities. Higher yields can tighten financial conditions, while higher energy prices can increase operating and transportation costs for businesses and put additional pressure on consumers.
For the Russell 2000, the interest-rate environment is particularly important. The index remains considerably weaker technically than the Nasdaq and S&P 500, and a sustained period of elevated Treasury yields could continue to constrain the recovery in small-cap stocks.
Technical Position of the Major Indexes
Despite Monday’s declines, the S&P 500 and Nasdaq Composite remain technically well positioned. Both indexes continue to trade comfortably above their 25-day, 50-day, and 200-day moving averages. Their short-term pullback therefore has not, by itself, materially altered their broader technical structure.
The Dow Jones presents a less constructive short-term picture. The index remains below both its 25-day and 50-day moving averages, although it continues to trade above its 200-day moving average. The narrowing distance between the Dow and its 200-day moving average is worth monitoring, as a sustained move toward or below this longer-term trend indicator would represent a more significant deterioration in its technical position.
The Russell 2000 remains the weakest of the four major indexes from a technical perspective. It continues to trade well below its 25-day and 50-day moving averages. Although the index remains above its 200-day moving average, the gap between the Russell 2000 and its 200-day moving average continues to narrow.
Relative Strength Remains Concentrated
Monday’s performance highlights an important divergence within the U.S. equity market. The Nasdaq and S&P 500 continue to maintain substantial distance above their key moving averages, while the Dow and particularly the Russell 2000 show greater technical weakness.
This suggests that market strength remains concentrated in the stronger areas of the large-cap market rather than being broadly distributed across all segments of U.S. equities. The continued underperformance of small caps is particularly important to monitor because broader participation from smaller companies would generally provide a different market signal than strength concentrated primarily in large-cap indexes.
Key Takeaways for Traders and Investors
- All four major indexes declined Monday, confirming a broadly weaker session.
- The Russell 2000 remained the weakest major index, continuing to lag the large-cap benchmarks.
- Treasury yields remain an important headwind, particularly for small-cap equities that are generally more sensitive to borrowing costs.
- The S&P 500 and Nasdaq remain technically strong, trading above their 25-day, 50-day, and 200-day moving averages.
- The Dow’s short-term trend remains weaker, with the index below its 25-day and 50-day moving averages and moving closer to its 200-day moving average.
- The Russell 2000 remains technically vulnerable, trading below its 25-day and 50-day moving averages while its distance above the 200-day moving average continues to narrow.
- Market participation remains an important issue. Continued divergence between large-cap indexes and small caps suggests that the strength of the broader market should be monitored closely.
Bottom Line
Monday’s session did not materially damage the technical structure of the S&P 500 or Nasdaq, but it reinforced the divergence between the major U.S. equity indexes. Large-cap benchmarks remain comfortably above their longer-term trend indicators, while the Dow and especially the Russell 2000 are showing greater technical deterioration.
For traders and investors, the relationship between Treasury yields, small-cap performance, and the major equity indexes remains an important area to monitor. A continued rise in yields accompanied by further weakness in the Russell 2000 and a narrowing gap between the Dow and its 200-day moving average would indicate increasing pressure beneath the surface of the U.S. equity market
Tuesday’s U.S. Market Statistics
New York Stock Exchange (NYSE): Market breadth on the New York Stock Exchange remained negative on Tuesday, although several internal indicators showed modest improvement from Monday.
There were 2,859 declining issues compared with 1,722 advancing issues, while 480 issues were unchanged. This produced a decliner-to-advancer ratio of 1.66 to 1, or approximately three declining issues for every two advancing issues. The breadth figures therefore continued to indicate broad-based weakness across NYSE-listed stocks.
The 52-week statistics provided a mixed but somewhat improved picture. The NYSE recorded 71 new 52-week highs and 796 new 52-week lows, compared with 65 new highs and 847 new lows on Monday.
The number of new highs increased by approximately 9%, while new lows declined by approximately 6%. As a result, the new-high-to-new-low ratio improved modestly. Nevertheless, new highs represented only about 9% of new lows, leaving a substantial imbalance in favour of stocks making new lows.
The persistence of nearly 800 new 52-week lows is particularly noteworthy. While the internals improved from Monday’s exceptionally weak reading, the absolute number of new lows remains elevated and indicates that considerable weakness continues beneath the surface of the broader market.
NYSE trading volume reached approximately 5.21 billion shares, down about 2% from Monday’s 5.29 billion shares. The relatively small change in volume is within the range of normal day-to-day variation and does not, by itself, provide a significant directional signal.
Overall, Tuesday’s NYSE internals were less negative than Monday’s but remained weak. The improvement in new-high/new-low statistics is encouraging from a short-term perspective, but the continued dominance of new lows and negative market breadth argue for continued caution.
NASDAQ: NASDAQ market breadth was also negative on Tuesday. There were 2,902 declining issues compared with 2,005 advancing issues, with 409 issues unchanged. The resulting decliner-to-advancer ratio was 1.44 to 1, meaning that approximately three stocks declined for every two that advanced.
The NASDAQ recorded 58 new 52-week highs and 487 new 52-week lows, compared with 54 new highs and 529 new lows on Monday.
The improvement in the NASDAQ’s 52-week statistics was somewhat more pronounced than on the NYSE. New highs increased by approximately 7%, while new lows declined by approximately 8%. This resulted in a modest improvement in the new-high-to-new-low balance.
However, the absolute imbalance remains significant. The NASDAQ produced more than eight times as many new 52-week lows as new highs. Consequently, despite the improvement from Monday, the market’s internal technical condition remains weak.
NASDAQ trading volume reached approximately 7.54 billion shares, an increase of about 2% from Monday’s 7.39 billion shares. A change of this magnitude is relatively small and should generally be viewed as normal day-to-day variation rather than a meaningful change in trading intensity.
Market Internals Remain Weak
Tuesday’s data presents a market that improved at the margin but remains technically unhealthy beneath the surface.
Both the NYSE and NASDAQ continued to record substantially more new 52-week lows than new highs. Market breadth was also negative on both exchanges, with decliners clearly outnumbering advancers.
The most constructive development was the improvement in the new-high/new-low statistics: NYSE new lows declined from Monday while new highs increased, and NASDAQ new lows also declined while new highs increased. This represents a measurable improvement in market internals.
However, the improvement should be viewed in context. The number of new lows remains exceptionally large relative to new highs, meaning that the underlying deterioration has not yet been reversed.
Key Takeaways for Traders and Investors
- Market breadth remained negative on both exchanges. Decliners outnumbered advancers by approximately 1.66 to 1 on the NYSE and 1.44 to 1 on the NASDAQ.
- The new-high/new-low picture improved modestly. NYSE new highs increased while new lows declined; the NASDAQ showed a similar pattern.
- New lows remain overwhelmingly dominant. The NYSE recorded 796 new lows versus only 71 new highs, while the NASDAQ recorded 487 new lows versus 58 new highs.
- Tuesday was an improvement, but not a reversal. The internal statistics moved in a somewhat more constructive direction, but they remain too weak to suggest that the underlying market deterioration has been resolved.
- Trading volume provided little additional information. Volume changes of approximately 2% on both exchanges are relatively minor and do not represent a significant shift in participation.
- Caution remains warranted. The combination of negative breadth and a persistent imbalance toward new 52-week lows indicates that weakness remains widespread beneath the major indexes.
Bottom Line
Tuesday’s U.S. market internals improved somewhat from Monday, particularly in the new-high/new-low statistics. However, the improvement was incremental rather than decisive. Both the NYSE and NASDAQ continued to show negative breadth, while new 52-week lows remained substantially higher than new highs.
For traders and investors, the key issue is whether this modest improvement develops into a sustained recovery in market breadth and a meaningful reduction in new 52-week lows. Until that occurs, the internal data continues to point to a market environment in which selectivity and risk management remain important.
.
Tuesday’s U.S. Market Wrap-Up Report
U.S. equities remained under pressure on Tuesday, although the major indexes posted smaller declines than Monday. All four major indexes finished lower as elevated Treasury yields continued to weigh on risk assets. At the same time, the decline in crude oil prices provided some relief on the inflation front.
The 10-year Treasury yield rose 1.5 basis points to approximately 5.26% after briefly reaching 5.29%, its highest intraday level in roughly 19 years. The 30-year Treasury yield also remained elevated, reaching its highest level in more than two decades. Shorter-term Treasury yields moved lower as expectations surrounding the Federal Reserve’s next policy decision remained uncertain.
The combination of elevated bond yields and still-high energy prices continues to create a challenging environment for equities. Higher yields can place pressure on equity valuations and financing conditions, while elevated oil prices can add to inflationary pressures and operating costs.
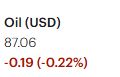
Crude oil prices nevertheless moved in a more favorable direction on Tuesday. U.S. crude fell approximately 3.5% to $89.38 a barrel, its lowest settlement of September. A sustained decline in oil prices would reduce some of the inflationary pressure associated with the recent energy-price increase, although one session does not establish a trend.
Major Indexes Remain Under Pressure
All four major U.S. indexes declined on Tuesday, but the losses were less severe than Monday’s declines.
The Dow Jones Industrial Average fell 0.26%, the S&P 500 declined 0.17%, the Nasdaq Composite slipped 0.09%, and the Russell 2000 fell 0.35%.
The Russell 2000 again underperformed the large-cap indexes, highlighting the continued sensitivity of small-cap stocks to the elevated interest-rate environment.
From a technical perspective, the S&P 500 and Nasdaq remain in considerably stronger positions than the Dow and Russell 2000. The S&P 500 and Nasdaq continue to trade above their 25-day, 50-day, and 200-day moving averages.
The Dow remains below its 25-day and 50-day moving averages but above its 200-day moving average. The distance between the Dow and its 200-day moving average continues to narrow and therefore remains an important technical level to monitor.
The Russell 2000 remains the weakest of the four major indexes from a moving-average perspective. It continues to trade below its 25-day and 50-day moving averages, while remaining above its 200-day moving average. The narrowing gap between the Russell 2000 and its 200-day moving average warrants continued attention.
Sector Performance
Sector leadership remained narrow on Tuesday, with only three of the major sectors finishing higher.
Utilities led the market, gaining 1.04%. Industrials advanced 0.47%, while Technology gained 0.15%.
The gains in Technology are notable because the sector recovered modestly following Monday’s broader technology-related weakness. However, the relatively small gain indicates that the recovery was limited rather than a broad-based technology rally.
Financials declined 0.33%, while Basic Materials fell 0.35%. Energy was weaker, falling 1.08%, in line with the decline in crude oil prices.
Telecommunications Services was the session’s weakest sector, declining 1.15%.
The overall sector picture therefore remained defensive, with Utilities leading while several economically sensitive sectors and Energy came under pressure.
Market Internals Remain Weak
The underlying market statistics continued to show weakness beneath the major indexes.
On the NYSE, 2,859 stocks declined compared with 1,722 advancing stocks, producing a decliner-to-advancer ratio of 1.66 to 1. On the NASDAQ, 2,902 stocks declined versus 2,005 advancing stocks, producing a ratio of 1.44 to 1.
The 52-week statistics were somewhat more encouraging than Monday’s figures. The NYSE recorded 71 new highs and 796 new lows, while the NASDAQ recorded 58 new highs and 487 new lows.
Although new highs increased and new lows declined on both exchanges compared with Monday, the imbalance remains substantial. New 52-week lows continued to outnumber new highs by a wide margin.
This is an important distinction for traders and investors: the major indexes are declining only modestly, but the market’s internal structure remains considerably weaker than the headline index performance suggests.
Trading volume provided little additional directional information. NYSE volume declined approximately 2%, while NASDAQ volume increased approximately 2%. Changes of this magnitude are generally within normal day-to-day variation.
Company News and Stocks to Watch
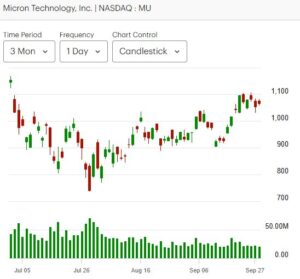
Micron Technology: Micron Technology (MU) is scheduled to report its latest earnings after the close on Wednesday. The report represents a potentially important catalyst for semiconductor and memory stocks because of the relationship between memory-chip demand and the continued expansion of artificial-intelligence infrastructure.
Beyond Micron itself, investors may watch the reaction across other memory and storage-related companies, including SanDisk (SNDK), SK Hynix, Seagate Technology (STX), and Silicon Motion Technology (SIMO).
The earnings report and management’s outlook for memory demand, pricing, margins, and AI-related demand could therefore have implications beyond Micron itself.
Bloom Energy: Bloom Energy gained approximately 11% on Tuesday and was among the stronger performers in the S&P 500.
The advance followed news that the company purchased a 158,000-square-foot facility in Fremont, California, to expand its operations. The expansion provides investors with another data point regarding the company’s growth plans and demand environment.
Given the market’s continuing focus on power requirements associated with data centers and AI infrastructure, developments involving companies positioned within the broader power-and-AI infrastructure theme remain worth monitoring.
Nvidia: Nvidia (NVDA) declined approximately 0.3% on Tuesday, giving back a portion of Monday’s gain.
Nvidia had advanced strongly on Monday following the announcement of an additional $150 billion authorization for its share-repurchase program and updates related to AI safety software.
Despite Tuesday’s modest decline, Nvidia remains an important barometer for the broader AI and semiconductor trade. Its price action, along with the upcoming Micron earnings report, could provide additional information about the current strength of the technology and AI-related groups.
Key Takeaways for Traders and Investors
- All four major indexes declined, although Tuesday’s losses were smaller than Monday’s.
- Treasury yields remain a significant market headwind, with the 10-year yield approaching 5.30%.
- The Russell 2000 continues to underperform, reflecting the greater sensitivity of small-cap stocks to elevated interest rates and financial conditions.
- The S&P 500 and Nasdaq remain technically stronger, continuing to trade above their 25-day, 50-day, and 200-day moving averages.
- The Dow and Russell 2000 remain technically weaker, particularly relative to their shorter-term moving averages.
- Market breadth remained negative on both the NYSE and NASDAQ, despite the relatively modest index declines.
- New 52-week lows continue to dominate new highs. The improvement from Monday is constructive at the margin but does not yet represent a reversal in market internals.
- Energy stocks weakened alongside crude oil, while Utilities provided the strongest sector leadership.
- Technology stabilized modestly, but the sector’s gain was relatively small.
- Micron’s earnings report Wednesday could provide an important near-term catalyst for semiconductor and memory stocks.
- Oil prices moved lower, which could provide some relief from inflationary pressure if the decline proves sustained.
Bottom Line
Tuesday’s session provided a mixed message. The major indexes experienced only modest declines, crude oil prices moved lower, and Technology managed a small recovery. However, elevated Treasury yields continued to weigh on the market, while small-cap stocks remained under pressure.
More importantly, the market internals remain weak. Both the NYSE and NASDAQ recorded substantially more declining issues than advancing issues, and new 52-week lows continued to overwhelm new highs.
The result is a market in which the headline indexes have not yet experienced a major technical breakdown, but the breadth statistics indicate considerably less participation beneath the surface. For traders and investors, the next developments in Treasury yields, market breadth, new 52-week lows, and the ability of the major indexes to hold their key moving averages will be important in assessing whether the current weakness remains contained or broadens further.
.
NOTICE TO READERS
The Canadian Vanguard Stock Market is about empowering you to build and manage your wealth by yourself. There is certainly no magic in managing finances or wealth but one needs to know what to do and commit to doing what is needed. When you are ready to start the journey to Take Charge and Put Your Destiny In Your Own Hands, start with reading The Canadian Vanguard every market day. If and when you need more related information or to advertise your business products or services in The Canadian Vanguard, Contact Us
Our readers are strongly advised to conduct their own research into individual stocks before making a purchase decision. In addition, investors are advised that past stock performance is no guarantee of future price appreciation. Any recommendation is not a guarantee of any particular stock’s future prices, and The Canadian Vanguard accepts no responsibility or liability for investors’ or readers’ purchases.
Stocks In The News/ Stocks To Watch and Market Strategy will soon be available only to Paying Subscribers. The dollar sign “$” in the Toronto Market section in the articles only stands for Canadian dollar and in the US market section “$” stands for US dollar.
(c) This article is published by The Canadian Vanguard on September 29, 2026