
Rising Treasury Yields and Oil Prices Deliver a Double Blow to Stocks, Weighing on Major Market Indexes
The Canadian Vanguard Stock Market Report Wednesday, September 23, 2026, Edition
.
The Toronto Market
Wednesday’s Toronto Market Index
The Toronto S&P/TSX Composite Index dropped 584.18 points, or 1.61%, to close at 35,751.43 on Wednesday.
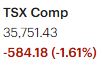

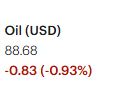
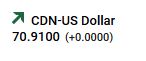
The TSX fell sharply, reversing last week’s streak of three consecutive sessions of gains. It significantly underperformed most other major North American indexes, with the Russell 2000 also posting a notable decline.
The session was particularly weak. The index opened lower, remained below the previous session’s close throughout the trading day, and finished at its lowest level of the day. Overall, it was a very poor market session for the TSX.
From a technical perspective, the decline pushed the TSX through both its 25-day and 50-day moving averages. However, the index continues to maintain a substantial gap above its 200-day moving average, leaving its longer-term position considerably stronger than its short-term performance would suggest.
Wednesday’s TSX Market Statistics
At the TSX, declining issues significantly outnumbered advancing issues. There were 1,819 decliners and 431 advancers, producing a decliner-to-advancer ratio of 4.22 to 1—approximately four declining issues for every advancing issue. A total of 101 issues were unchanged.
The exchange recorded 38 new 52-week highs and 155 new 52-week lows, compared with 97 new 52-week highs and 46 new 52-week lows on the previous trading day.
Market breadth deteriorated significantly today. The ratio of new 52-week highs to new 52-week lows declined to approximately 1:4, a considerable deterioration from yesterday’s much stronger reading. New 52-week lows clearly dominated the market. The number of new 52-week highs decreased by approximately 60%, while the number of new 52-week lows increased by approximately 237% compared with yesterday.
Overall, the TSX’s internal market indicators weakened considerably compared with earlier in the week, reflecting broad-based deterioration beneath the index.
Total trading volume on the TSX reached 438,973,759 shares, approximately 6% lower than yesterday’s volume of 466,877,332 shares.
Although the TSX index declined sharply, the decline occurred alongside a modest decrease in trading volume. This may suggest that the sell-off has not yet been accompanied by a significant increase in trading participation or downside momentum. However, volume should be interpreted alongside other market indicators, and a single trading session is not sufficient to establish a market trend.
Wednesday’s Toronto TSX Market Wrap-Up Report
The Toronto S&P/TSX Composite Index had a sharp reversal on Wednesday, falling 584.18 points, or 1.61%, to close at 35,751.43. The decline ended the index’s three-session winning streak and produced one of its weakest trading sessions in recent memory.
The selling was broad-based and persistent. The TSX opened lower, remained below Tuesday’s close throughout the session, and finished at the low of the day, indicating sustained selling pressure into the close. The index also underperformed most major North American equity indexes, with the exception of the Russell 2000.
Only three of the ten major TSX sectors finished higher. Industrials led the advancing sectors with a gain of 0.40%, followed by Energy at 0.20% and Telecommunications Services at 0.17%. The gains were modest and did little to offset the widespread weakness elsewhere in the market.
The downside was led by Basic Materials, which fell 3.60%. Technology declined 2.12%, while Financials fell 1.76%. The weakness in these major sectors was significant because Financials, Technology and Basic Materials represent important components of the Canadian market and their simultaneous declines contributed substantially to the broader TSX sell-off.
Market Breadth Deteriorated Sharply
The internal market statistics reinforced the weakness visible in the index.
There were 1,819 declining issues compared with only 431 advancing issues, producing a decliner-to-advancer ratio of 4.22 to 1. In other words, there were more than four declining stocks for every advancing stock. Another 101 issues finished unchanged.
The new 52-week high/low statistics also deteriorated considerably. The TSX recorded just 38 new 52-week highs and 155 new 52-week lows, compared with 97 new highs and 46 new lows on Tuesday.
The number of new 52-week highs therefore fell by approximately 60%, while new 52-week lows increased by approximately 237% from the previous session. The resulting new-high-to-new-low ratio was approximately 1 to 4, with new lows clearly dominating.
Taken together, the breadth statistics indicate that Wednesday’s weakness was broad rather than concentrated in a small number of large-cap stocks. The deterioration in advancing/declining issues and the sharp expansion in new 52-week lows point to a significant weakening of the TSX’s internal market conditions.
Financial Sector Under Pressure
The financial sector was particularly weak, with all six major Canadian banks declining during Wednesday’s session.
Bank of Nova Scotia fell 1.63%, making it the least-declining of the major six banks. National Bank of Canada declined 2.19%, Toronto-Dominion Bank fell 2.44%, and Canadian Imperial Bank of Commerce declined 2.76%.
The broad weakness among the major banks was consistent with the 1.76% decline in the Financials sector and contributed to the pressure on the overall TSX.
Stock Movers
The TSX’s top-performing stocks were distributed across several sectors rather than being dominated by the mining stocks that frequently feature prominently among the market’s strongest performers.
Thomson Reuters was among the notable gainers, rising 3.08% to $131.82 on volume of approximately 798,100 shares.
Methanex Corp. gained 2.67% and closed at $83.55, while Suncor Energy advanced 1.75% to $95.76, with approximately 6.4 million shares changing hands.
The presence of individual gainers despite the broad market decline illustrates that Wednesday was not a uniformly negative session across every TSX-listed stock. However, the overall breadth statistics show that declining issues substantially outnumbered advancing issues.
Trading Volume and Market Participation
Total TSX volume reached approximately 438.97 million shares, down about 6% from Tuesday’s 466.88 million shares.
The combination of a 1.61% index decline and slightly lower trading volume is noteworthy. While the decline was severe, it was not accompanied by a substantial increase in aggregate volume. This may be relevant when assessing whether Wednesday represented the beginning of a more persistent change in market momentum.
However, volume from a single session should not be interpreted in isolation. Traders and investors should look for confirmation from subsequent sessions, particularly through price action, volume, market breadth and the behaviour of the major sectors.
.
Technical Picture
From a technical perspective, Wednesday’s decline pushed the TSX below both its 25-day and 50-day moving averages, marking a deterioration in the index’s short-term technical position.
At the same time, the index remains well above its 200-day moving average. Consequently, Wednesday’s sharp decline represents a significant deterioration in short-term conditions, while the longer-term position remains separated from the 200-day trend measure.
The interaction between the index and these moving averages will therefore be important in the sessions ahead. A sustained move below the shorter-term averages would provide additional evidence of weakening short-term momentum, while the 200-day moving average remains an important longer-term reference point.
Key Takeaways for Traders and Investors
- Wednesday was a broad-based sell-off. The 4.22-to-1 decliner/advancer ratio shows that weakness extended across a large portion of the TSX rather than being confined to a handful of large-cap stocks.
- Market breadth deteriorated significantly. New 52-week lows outnumbered new highs by more than four to one, a substantial reversal from Tuesday’s much stronger breadth.
- Financials were a major source of pressure. All six major Canadian banks declined, while the Financials sector fell 1.76%.
- Basic Materials and Technology were among the weakest major sectors. Their declines of 3.60% and 2.12%, respectively, added significant pressure to the index.
- The TSX broke below its 25-day and 50-day moving averages. This is an important change in the index’s short-term technical picture.
- The index remains above its 200-day moving average. The longer-term technical structure therefore has not been invalidated by Wednesday’s decline alone.
- Volume did not expand with the sell-off. Trading volume was approximately 6% lower than Tuesday’s level. This is a factor to monitor, but one session of volume is insufficient to establish whether a sustained momentum shift has occurred.
- Confirmation from subsequent sessions will be important. Traders and investors may wish to monitor whether the TSX can stabilize, how advancing and declining issues behave, whether new lows continue to expand, and whether volume increases on additional declines or rebounds.
- Overall, Wednesday’s session marked a significant deterioration in the TSX’s short-term market internals and technical position. The combination of a sharp index decline, very weak breadth, a surge in new 52-week lows and weakness across several major sectors warrants close observation. At the same time, the TSX remains above its 200-day moving average, and Wednesday’s data alone does not establish a new longer-term market trend.
.
The US Markets
Wednesday’s U.S. Market Indexes
All four major U.S. equity indexes finished Wednesday’s session in negative territory, with small-cap stocks experiencing the sharpest decline.
The Dow Jones Industrial Average fell 352.10 points, or 0.68%, to close at 51,511.59. Although the Dow underperformed the S&P 500, Nasdaq Composite and Russell 2000 in terms of percentage decline, it was still the best-performing major index on Wednesday.
The S&P 500 declined 58.61 points, or 0.75%, closing at 7,706.03. The Nasdaq Composite dropped 308.24 points, or 1.13%, to finish at 26,936.04. The Nasdaq’s decline ended a four-session winning streak during which the index had posted strong gains.

The Russell 2000 was the weakest of the four major indexes, falling 51.26 points, or 1.77%, to close at 2,838.66. The relatively large decline in the small-cap index indicates that smaller companies experienced particularly strong selling pressure during Wednesday’s session.
Technical Picture: Despite Wednesday’s decline, the S&P 500 and Nasdaq Composite remain well above their 25-day and 50-day moving averages. Their short-term technical positions therefore remain above these key moving-average levels despite the day’s setback.
The Dow Jones Industrial Average presents a considerably weaker technical picture. The index is currently below its 25-day, 50-day and 200-day moving averages, indicating weakness across the short-, intermediate- and longer-term moving-average measures.
The Russell 2000 remains below both its 25-day and 50-day moving averages, but it continues to trade above its 200-day moving average. This places the small-cap index in a mixed technical position: its shorter-term trend measures remain under pressure, while it has retained its position above the longer-term 200-day average.
Overall, Wednesday’s session was a broad retreat across the major U.S. indexes. However, the technical picture remains different from one index to another. The Nasdaq and S&P 500 remain above their shorter-term moving averages, while the Dow is below all three major moving-average levels and the Russell 2000 remains caught between its shorter-term and longer-term trend measures.
Wednesday’s U.S. Market Statistics
New York Stock Exchange (NYSE): Market breadth on the New York Stock Exchange deteriorated sharply on Wednesday, with declining issues substantially outnumbering advancing issues. There were 3,688 decliners, 938 advancers and 412 unchanged issues, producing a decliner-to-advancer ratio of 3.93 to 1—approximately four declining stocks for every advancing stock.
The NYSE recorded 90 new 52-week highs and 723 new 52-week lows, compared with 180 new highs and 253 new lows on Tuesday.
The deterioration in the 52-week indicators was particularly significant. The number of new 52-week highs fell by 50%, while new 52-week lows increased by approximately 186% compared with the previous session. New 52-week lows therefore outnumbered new highs by approximately 8 to 1, with new highs representing only about 12% of the number of new lows.
This represents a substantial reversal from the improving market internals seen during the previous two sessions. Wednesday’s statistics showed broad-based deterioration, with declining issues dominating advancing issues and new 52-week lows overwhelmingly exceeding new highs.
Total NYSE trading volume reached approximately 5.24 billion shares, about 4% lower than Tuesday’s volume of 5.44 billion shares.
The combination of sharply negative breadth and a dramatic increase in new 52-week lows indicates that Wednesday’s weakness extended well beyond the major indexes. At the same time, the modest decline in trading volume means that the significance of the session should be assessed alongside subsequent market action rather than treating one day’s statistics as confirmation of a new longer-term trend.
Nasdaq: The Nasdaq also experienced significantly negative market breadth on Wednesday. There were 3,818 declining issues, 1,113 advancing issues and 379 unchanged issues, producing a decliner-to-advancer ratio of 3.43 to 1.
This means that there were more than three declining stocks for every advancing stock, demonstrating broad participation in the market decline.
The Nasdaq recorded 83 new 52-week highs and 437 new 52-week lows, compared with 148 new highs and 180 new lows on Tuesday.
The number of new 52-week highs declined by approximately 44%, while new 52-week lows increased by approximately 143% from the previous session. New 52-week lows therefore outnumbered new highs by more than 5 to 1.
This represented a sharp deterioration in Nasdaq market internals. The market had shown stronger internal conditions recently, but Wednesday’s session reversed that improvement, with new 52-week lows once again dominating new highs.
Total Nasdaq trading volume reached approximately 8.91 billion shares, approximately 8% lower than Tuesday’s volume of 9.72 billion shares.
The Nasdaq therefore experienced a significant decline in both price and market breadth while trading volume decreased from the previous session. The lower volume is noteworthy, but it does not by itself establish whether Wednesday’s decline represents the beginning of a new trend or a reaction to a specific market event.
Market Internals: Key Observations
Wednesday’s U.S. market statistics showed a substantial deterioration in internal market conditions on both major exchanges.
- NYSE breadth: 3.93 decliners for every advancer.
- Nasdaq breadth: 3.43 decliners for every advancer.
- NYSE new highs/lows: 90 new highs versus 723 new lows.
- Nasdaq new highs/lows: 83 new highs versus 437 new lows.
- NYSE volume: approximately 4% lower than Tuesday.
- Nasdaq volume: approximately 8% lower than Tuesday.
The most notable feature of Wednesday’s session was the dramatic expansion in new 52-week lows on both exchanges. This indicates that weakness was not limited to the major indexes or a small group of large-cap stocks; a substantial number of individual stocks were also trading at or near their lowest levels of the past year.
However, the decline occurred with lower overall trading volume on both exchanges. Traders and investors should therefore monitor the next several sessions for confirmation. In particular, the behaviour of advancing and declining issues, new 52-week highs and lows, trading volume, and the major indexes will help determine whether Wednesday’s deterioration was a temporary reversal or part of a more persistent change in market conditions.
Wednesday’s U.S. Market Wrap-Up Report
U.S. equity markets came under significant pressure on Wednesday as rising oil prices and a sharp increase in Treasury yields weighed on stocks. All four major indexes finished lower, with small-cap stocks experiencing the heaviest selling pressure.
The Dow Jones Industrial Average declined 352.10 points, or 0.68%, to 51,511.59. The S&P 500 fell 58.61 points, or 0.75%, to 7,706.03, while the Nasdaq Composite dropped 308.24 points, or 1.13%, to 26,936.04. The Russell 2000 was the weakest of the major indexes, falling 51.26 points, or 1.77%, to 2,838.66.
The Nasdaq’s decline ended a four-session winning streak, while the Russell 2000’s larger decline highlighted the particular pressure on small-cap stocks.
Rising Yields and Oil Weigh on Equities: The sharp rise in Treasury yields was one of the major drivers of Wednesday’s market weakness. The 10-year Treasury yield reached 5.135% intraday, its highest level since 2007, while the two-year yield also reached its highest level since 2024. Reuters reported that oil prices rose almost 4% during the session, adding another source of inflationary pressure.
The combination of higher energy prices and higher bond yields created a difficult environment for equities. Rising yields can increase the relative attractiveness of fixed-income securities and raise financing costs, while higher oil prices can add to inflation concerns.
The increase in Treasury yields was also supported by stronger-than-expected U.S. business activity data. The September flash PMI composite reading rose to 58.4, its highest level since July 2021, reinforcing concerns that economic strength could keep inflation and interest rates elevated.
Sector Performance: The session was broadly negative across the major sectors. Only two of the eleven major S&P 500 sectors finished higher.
Energy led the advancing sectors, gaining 0.87%, as oil prices moved higher. Telecommunication Services also gained, although by only 0.21%.
On the downside, Basic Materials was the weakest sector, falling 2.00%. Utilities declined 1.59%, Financials fell 1.39%, and Technology lost 1.03%.
The sector performance reflected the broader risk-off tone, although the strength in Energy demonstrated that higher oil prices did not affect all parts of the equity market equally.
Technology Stocks Showed Mixed Performance
Technology stocks generally weakened, particularly semiconductor companies. Chip-related stocks came under pressure during the session, with the Philadelphia Semiconductor Index declining and several major semiconductor names moving lower.
However, the technology sector was not uniformly weak. Cybersecurity stocks were notable outperformers, demonstrating that investors continued to show selective interest within technology despite the broader market decline.
Meta Platforms (META) gained approximately 1%, while its trading volume increased significantly from the previous session.
Palo Alto Networks (PANW) rose 5.0% to $393.30, with approximately 6.3 million shares traded.
Fortinet (FTNT) advanced 2.57% to $178.74, with approximately 3.4 million shares traded.
CrowdStrike Holdings (CRWD) gained 4.97% to $262.49, with approximately 13.2 million shares traded.
The strong performance of cybersecurity stocks contrasted sharply with the weakness in semiconductor stocks and illustrates the importance of looking beneath the headline technology-sector numbers.
Market Breadth Deteriorated Sharply
The market internals were considerably weaker on Wednesday.
On the NYSE, there were 3,688 declining issues compared with 938 advancing issues, producing a decliner-to-advancer ratio of 3.93 to 1. The exchange also recorded just 90 new 52-week highs versus 723 new 52-week lows.
On the Nasdaq, there were 3,818 decliners and 1,113 advancers, producing a decliner-to-advancer ratio of 3.43 to 1. The Nasdaq recorded 83 new 52-week highs compared with 437 new 52-week lows.
The sharp deterioration in new-high/new-low statistics was particularly notable. On the NYSE, new highs fell approximately 50% while new lows increased by approximately 186% from Tuesday. On the Nasdaq, new highs declined approximately 44%, while new lows increased by approximately 143%.
These statistics indicate that Wednesday’s weakness extended well beyond the headline indexes. A large number of individual stocks participated in the decline.
Trading Volume
Trading volume, however, did not increase alongside the market decline.
NYSE volume reached approximately 5.24 billion shares, about 4% below Tuesday’s 5.44 billion shares. Nasdaq volume reached approximately 8.91 billion shares, about 8% below Tuesday’s 9.72 billion shares.
The combination of sharply negative breadth and lower aggregate volume is worth monitoring. It does not, by itself, establish whether Wednesday represents the beginning of a new market trend. Traders and investors will need to watch subsequent sessions for confirmation through price action, volume and market breadth.
Technical Picture
Wednesday’s decline produced a mixed technical picture across the major U.S. indexes.
The S&P 500 and Nasdaq Composite remain above their 25-day and 50-day moving averages, despite Wednesday’s losses. Their short-term technical structures therefore remain above these important reference levels.
The Dow Jones Industrial Average is in a weaker technical position, trading below its 25-day, 50-day and 200-day moving averages.
The Russell 2000 remains below its 25-day and 50-day moving averages but continues to trade above its 200-day moving average.
This divergence between the major indexes is important. Wednesday’s sell-off weakened the overall market, but the technical damage was not uniform across the major indexes.
.
Key Takeaways for Traders and Investors
- Wednesday was a broad market decline. All four major indexes finished lower, while market breadth deteriorated sharply on both the NYSE and Nasdaq.
- Small caps were hit hardest. The Russell 2000 fell 1.77%, considerably more than the Dow, S&P 500 or Nasdaq.
- The rise in Treasury yields was a major market factor. The 10-year yield reached 5.135% intraday, its highest level since 2007, while the two-year yield reached its highest level since 2024.
- Oil moved higher at the same time that yields surged. The combination added to inflation and interest-rate concerns and coincided with the broad equity-market decline.
- Market internals weakened substantially. Decliners outnumbered advancers by almost 4-to-1 on the NYSE and more than 3-to-1 on the Nasdaq.
- New 52-week lows dominated. The NYSE recorded 723 new lows versus only 90 new highs, while the Nasdaq recorded 437 new lows versus 83 new highs.
- Technology was not uniformly weak. Semiconductor stocks struggled, while cybersecurity stocks such as Palo Alto Networks, Fortinet and CrowdStrike posted strong gains.
- The major indexes have different technical profiles. The S&P 500 and Nasdaq remain above their 25-day and 50-day moving averages; the Russell 2000 remains above its 200-day average but below its shorter-term averages; and the Dow is below all three.
- Volume did not confirm an increase in selling participation. Both NYSE and Nasdaq volume declined from Tuesday, so additional sessions will be important in determining whether Wednesday’s weakness develops into a more persistent trend.
Overall, Wednesday was a significant deterioration in U.S. market breadth and short-term sentiment, driven in part by the simultaneous rise in oil prices and Treasury yields. The technical picture remains mixed rather than uniformly damaged, making the behaviour of the major indexes, Treasury yields, oil prices and market internals in the next several sessions particularly important to monitor.
.
NOTICE TO READERS
The Canadian Vanguard Stock Market is about empowering you to build and manage your wealth by yourself. There is certainly no magic in managing finances or wealth but one needs to know what to do and commit to doing what is needed. When you are ready to start the journey to Take Charge and Put Your Destiny In Your Own Hands, start with reading The Canadian Vanguard every market day. If and when you need more related information or to advertise your business products or services in The Canadian Vanguard, Contact Us
Our readers are strongly advised to conduct their own research into individual stocks before making a purchase decision. In addition, investors are advised that past stock performance is no guarantee of future price appreciation. Any recommendation is not a guarantee of any particular stock’s future prices, and The Canadian Vanguard accepts no responsibility or liability for investors’ or readers’ purchases.
Stocks In The News/ Stocks To Watch and Market Strategy will soon be available only to Paying Subscribers. The dollar sign “$” in the Toronto Market section in the articles only stands for Canadian dollar and in the US market section “$” stands for US dollar.
(c) This article is published by The Canadian Vanguard on September 23, 2026