
AI Rally Powers Market Rebound as S&P 500 Sets New High
The Canadian Vanguard Stock Market Report Tuesday, October 6, 2026, Edition
.
The Toronto Market
Tuesday’s Toronto Market Index
The S&P/TSX Composite Index rose 130.96 points, or 0.37%, to close at 35,649.51.
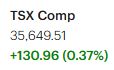
The TSX has now recorded three consecutive sessions of gains. The index improved on Monday’s close, although today’s performance remained below Friday’s level. The decline in oil prices today also weighed somewhat on the market. Friday’s strong decline had been significant enough to erase the gains from the previous three sessions.
Market breadth was positive today, representing a clear improvement from Monday’s performance.
The TSX remains below both its 25-day and 50-day moving averages, but it is steadily closing the gap. The index appears to be recovering gradually, and if the gains continue over the next few sessions, the TSX looks increasingly likely to move back above both its 25-day and 50-day moving averages.
The index remains comfortably above its 200-day moving average, maintaining a positive longer-term technical position.
Tuesday’s TSX Market Statistics
At the TSX, advancing issues significantly outnumbered declining issues today. There were 1,422 advancers and 796 decliners, producing an advancer-to-decliner ratio of 1.78 to 1 — approximately nine advancers for every five decliners. A total of 128 issues were unchanged.
The exchange recorded 167 new 52-week highs and 65 new 52-week lows, compared with 128 new 52-week highs and 116 new 52-week lows on Friday. Market breadth was clearly positive today.
The ratio of new 52-week highs to new 52-week lows improved significantly to approximately 3 to 1. The number of new 52-week highs continued to exceed the number of new 52-week lows, extending the improvement that began on Friday.
More importantly, today’s performance appears to mark a significant change in the market’s internal trend. For approximately two weeks, new 52-week lows had consistently and substantially outnumbered new 52-week highs. That pattern was decisively reversed today, with new highs exceeding new lows by a wide margin.
The improvement in market internals is encouraging. The breadth indicators are strengthening, and a new, moderately bullish trend appears to be emerging. Advancing stocks are now clearly outnumbering declining stocks, and this improvement is supported by a substantially higher number of new 52-week highs.
Trading volume also increased slightly. A total of 437,750,178 shares changed hands on the TSX today, about 1% higher than the 433,664,617 shares traded yesterday. The combination of stronger market breadth, more new 52-week highs and a modest increase in trading volume provides additional support for the improving market outlook.
Investors should nevertheless continue to exercise some caution when trading. While the market’s internal indicators have strengthened considerably, the recent improvement should be monitored over the coming sessions to determine whether this emerging bullish trend can be sustained.
Tuesday’s Toronto TSX Market Wrap-Up Report
The Toronto market continued its recovery on Tuesday, with the S&P/TSX Composite Index advancing 130.96 points, or 0.37%, to close at 35,649.51. The TSX has now posted three consecutive sessions of gains, extending the improvement that began after last week’s sharp decline.
Technology stocks once again dominated the market, making it two consecutive sessions in which the technology sector has been the leading force behind the TSX’s advance. Technology gained 1.20% today after surging 3.74% on Monday. Telecommunications Services also performed strongly, advancing 1.04%, while Utilities gained 0.92%.
Basic Materials rose 0.66%, and Financials gained approximately 0.28%. These gains helped reinforce the broad-based nature of today’s advance.
Not every sector participated. Energy declined 0.10%, Industrials fell 0.21%, and Consumer Durables & Services dropped 0.55%. The weakness in Energy is notable, particularly given the decline in oil prices today.
Market Breadth Shows Significant Improvement
The most encouraging feature of today’s market was not simply the TSX’s 0.37% gain, but the substantial improvement in its internal market indicators.
Advancing issues decisively outnumbered declining issues, with 1,422 advancers versus 796 decliners. This produced an advancer-to-decliner ratio of 1.78 to 1, or approximately nine advancing stocks for every five declining stocks. Another 128 issues were unchanged.
The new-high/new-low data was even more encouraging. The TSX recorded 167 new 52-week highs compared with only 65 new 52-week lows, producing a ratio of approximately 3 to 1.
This represents a significant change from the pattern seen over the previous two weeks, when new 52-week lows had consistently and substantially outnumbered new 52-week highs. The reversal today was decisive and suggests that the deterioration in market internals may have ended.
The combination of strong market breadth and a much higher number of new 52-week highs provides increasingly convincing evidence that the market’s internal strength is improving.
Trading volume also edged higher. Total TSX volume reached 437.75 million shares, approximately 1% above the 433.66 million shares traded on Monday. The modest increase in volume, combined with the strong advance/decline statistics, provides additional support for today’s market move.
Canadian Banks
The Canadian big six banks generally outperformed the broader market today, although performance within the group was mixed.
Canadian Imperial Bank of Commerce (CIBC) was the strongest of the major banks, rising 0.89% to close at $158.65 on approximately 967,500 shares.
National Bank of Canada gained 0.77% to $202.22 on approximately 989,800 shares, while Royal Bank of Canada advanced 0.58% to $279.19 on approximately 3.3 million shares.
The weaker performers were Bank of Nova Scotia, which declined 0.39% to $128.24 on approximately 3.5 million shares, and Bank of Montreal, which fell 0.68% to $234.65 on approximately 1.6 million shares.
Overall, the financial sector remained positive despite the mixed performance among the individual banks.
Shopify Continues Its Strong Run
Shopify (SHOP) continues to be one of the strongest large-cap technology names on the Toronto market.
Shopify advanced another 2.44% today, closing at $233.73 on approximately 1.8 million shares. The stock has now gained for seven consecutive sessions.
The latest advance is particularly notable because Shopify has moved back above the $225 level, a price it had not closed above since January.
The continued strength in Shopify is also consistent with the broader outperformance of the technology sector. Traders should nevertheless monitor whether the stock can maintain its momentum after such a strong seven-session advance.
Bird Construction
Following up on Friday’s report, Bird Construction Inc. (BDT) declined another 0.30% today, closing at $83.21 on approximately 233,600 shares.
BDT has now declined for two consecutive sessions. The stock’s recent weakness contrasts with the broader improvement in the TSX and is worth monitoring to determine whether the decline represents a short-term pullback or the beginning of a more significant reversal.
Technical Outlook
The TSX remains below both its 25-day and 50-day moving averages, but the index is steadily closing the gap. Three consecutive sessions of gains have improved the short-term technical picture, and several additional positive sessions could push the index back above these two moving averages.
The longer-term picture remains more constructive. The TSX is still comfortably above its 200-day moving average, leaving the index in a stronger long-term position despite its recent pullback.
The improvement in market breadth is particularly important. A market advance supported by a large number of advancing stocks and a rising number of new 52-week highs is generally healthier than an advance driven by only a small group of large-cap stocks.
Today’s market therefore provides an encouraging combination: the TSX is recovering, advancing issues are substantially outnumbering declining issues, new 52-week highs are decisively exceeding new lows, and trading volume has increased modestly.
Key Takeaways for Traders and Investors
- Market momentum is improving. The TSX has now gained for three consecutive sessions and is steadily recovering from its recent decline.
- Market breadth is a major positive. The 1,422-to-796 advance/decline count indicates that today’s rally was broad rather than concentrated in a handful of stocks.
- The new-high/new-low picture has changed significantly. With 167 new 52-week highs versus only 65 new lows, the ratio has shifted to approximately 3 to 1 in favour of new highs. This is one of the strongest signs that market internals are improving.
- Technology remains the leadership group. Technology has led the market for two consecutive sessions, with another 1.20% gain today following Monday’s 3.74% advance.
- Shopify remains a stock to watch. Seven consecutive sessions of gains and a close above $225 demonstrate strong short-term momentum, although traders should remain alert to the possibility of a pullback following the extended advance.
- The TSX has not yet cleared all of its technical hurdles. The index remains below its 25-day and 50-day moving averages. A sustained move above both would provide additional confirmation that the recovery is gaining strength.
- The 200-day moving average remains an important positive. The TSX continues to trade well above this longer-term moving average, preserving the broader bullish structure.
- Caution is still warranted. The market’s internal indicators have improved substantially, but traders should look for confirmation over the next several sessions. A continuation of strong breadth, rising new highs and improving volume would strengthen the case for a more durable recovery.
Bottom Line
Tuesday’s session was considerably more encouraging than a simple 0.37% gain in the TSX would suggest. The real story was the improvement beneath the surface.
Advancing stocks significantly outnumbered declining stocks, new 52-week highs decisively exceeded new lows, technology continued to lead, and trading volume increased slightly. These developments suggest that the market’s internal weakness of the past two weeks may be giving way to a new, moderately bullish trend.
The TSX still has work to do before the recovery can be considered fully established. A move above the 25-day and 50-day moving averages, supported by continued positive breadth and expanding new highs, would provide a much stronger technical confirmation.
For now, the market outlook is improving, and traders and investors have increasing reason to become more constructive — while continuing to manage risk carefully.
.
The US Markets
Tuesday’s U.S. Market Indexes
U.S. equities extended their recovery on Tuesday, with three of the four major indexes we track advancing. The Dow Jones Industrial Average rose 253.38 points, or 0.49%, to close at 51,521.38. The S&P 500 gained 44.98 points, or 0.58%, finishing at 7,818.93. The Nasdaq Composite advanced 122.58 points, or 0.45%, to close at 27,599.89.
The Russell 2000 was the notable exception, falling 16.84 points, or 0.59%, to close at 2,830.30.

The major U.S. indexes have now recorded three consecutive sessions of gains. This developing three-session advance suggests that a potential change in the market trend may be underway. However, the continued weakness in small-cap stocks indicates that the recovery is not yet broad-based across all segments of the market.
Nasdaq Continues to Show Strength: The Nasdaq once again delivered a relatively strong performance and remains the strongest of the major indexes from a technical perspective.
The index is now trading comfortably above its 25-day, 50-day and 200-day moving averages. This is an encouraging technical configuration and indicates that the Nasdaq’s recent recovery has developed considerable momentum.
The continued strength of technology-oriented stocks is also significant because the Nasdaq has been one of the key drivers of the broader market recovery.
S&P 500 Improving: The S&P 500 gained 0.58% today and continues to show a constructive technical picture.
The index remains below its 25-day moving average, but it is trading above both its 50-day and 200-day moving averages. A sustained move back above the 25-day moving average would provide additional evidence that the recent recovery is gaining strength.
For now, the S&P 500’s position above its 50-day and 200-day moving averages remains encouraging for the medium- and longer-term outlook.
Dow Jones Still Facing Technical Resistance: The Dow Jones gained 0.49% today but remains below both its 25-day and 50-day moving averages.
The index is still slightly above its 200-day moving average, although the gap between the Dow and its 200-day moving average has been narrowing during recent sessions. This is an area traders should watch closely.
A sustained decline below the 200-day moving average would weaken the Dow’s longer-term technical picture. Conversely, a recovery above the 25-day and 50-day moving averages would significantly improve its short-term technical position.
Small-Cap Stocks Remain Under Pressure: Small-cap stocks were the weakest part of the U.S. market today. The Russell 2000 declined 0.59%, substantially underperforming the Dow, S&P 500 and Nasdaq.
The Russell 2000 remains well below both its 25-day and 50-day moving averages and is only slightly above its 200-day moving average.
This divergence between the major large-cap indexes and small-cap stocks is important. While the Nasdaq and S&P 500 are showing signs of technical improvement, small-cap stocks continue to struggle.
For a more convincing broad-based market recovery, traders would ideally want to see the Russell 2000 stabilize and begin moving back above its short-term moving averages.
Treasury Yields and Oil: The 10-year U.S. Treasury yield rose three basis points today to 5.31%. Higher Treasury yields remain an important factor for equity investors because they can place pressure on stock valuations, particularly growth and technology stocks.
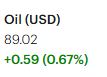
Oil prices declined today, largely following the announcement that G7 countries had agreed to release a substantial amount of oil from their strategic reserves. Lower oil prices can have mixed implications for the equity market, benefiting some consumers and businesses while putting pressure on energy-related stocks.
Key Takeaways for Traders and Investors
- The U.S. market has now gained for three consecutive sessions. This is an encouraging development and could represent the early stages of a change in the short-term market trend.
- The Nasdaq remains the technical leader. It is trading above its 25-day, 50-day and 200-day moving averages, giving it the strongest technical configuration among the major indexes.
- The S&P 500 is improving but has one more hurdle. The index is above its 50-day and 200-day moving averages but remains below its 25-day moving average. A move above the 25-day average would strengthen the recovery signal.
- The Dow remains more vulnerable. It is below both its 25-day and 50-day moving averages, while its distance above the 200-day moving average continues to shrink.
- Small-cap stocks are a significant concern. The Russell 2000 fell 0.59% today and remains well below its 25-day and 50-day moving averages. The weakness in small caps suggests that the current recovery is not yet fully broad-based.
- Higher Treasury yields remain a headwind. The 10-year yield reaching 5.31% is something traders should continue to monitor, particularly given the potential impact on equity valuations.
Bottom Line: Tuesday’s session was another positive day for the U.S. equity market, but the details beneath the headline gains remain mixed.
The three-session advance is encouraging, and the Nasdaq’s position above all three major moving averages is particularly constructive. The S&P 500 is also showing signs of improvement. However, the Dow has yet to regain its short-term moving averages, while the Russell 2000 continues to lag significantly.
The emerging trend therefore appears moderately bullish but not yet fully confirmed. For traders, the next important signal will be whether the S&P 500 and Dow can reclaim their short-term moving averages while the Russell 2000 begins to participate in the recovery.
Until that broader confirmation develops, maintaining a constructive but cautious approach remains appropriate.
Tuesday’s U.S. Market Statistics
Tuesday’s market statistics provide some of the most encouraging evidence so far that U.S. market internals are undergoing a significant improvement. Breadth was positive on both the NYSE and Nasdaq, while the number of new 52-week highs increased and the number of new 52-week lows declined sharply on both exchanges.
The most important development was the dramatic change in the new-high/new-low picture. For much of the past two weeks, new 52-week lows had consistently and substantially outnumbered new 52-week highs. That pattern is now showing clear signs of reversal.
New York Stock Exchange (NYSE): The NYSE posted strong positive breadth on Tuesday. There were 3,052 advancing issues compared with 1,578 declining issues, while 442 issues were unchanged.
This produced an advancer-to-decliner ratio of 1.93 to 1 — approximately two advancing stocks for every declining stock. The breadth reading was therefore not only positive but quite strong.
The new-high/new-low statistics were even more encouraging. The NYSE recorded 258 new 52-week highs and 219 new 52-week lows, compared with 220 new highs and 439 new lows on Monday.
The number of new 52-week highs increased by approximately 17% from Monday, marking the second consecutive session of increasing new highs. At the same time, new 52-week lows were cut almost in half, falling from 439 to 219.
For the first time in several weeks, new 52-week highs exceeded new 52-week lows. The 258 new highs were approximately 18% higher than the 219 new lows.
This is more than a modest improvement. It represents a reversal in the market’s internal trend.
For the past couple of weeks, new 52-week lows had consistently exceeded new highs, often by a substantial margin. That negative trend appears to have ended, and today’s figures provide much stronger evidence that the market’s internal condition is changing.
The improvement is particularly significant because it has developed over several sessions rather than appearing as an isolated one-day event. New highs are rising, new lows are falling, and market breadth is strong.
Trading volume on the NYSE totaled approximately 5.13 billion shares, down about 15% from Monday’s 6.01 billion shares. Although volume declined, the lower volume does not negate the significant improvement in breadth and the new-high/new-low relationship.
NYSE Assessment
The NYSE’s internal indicators have improved rapidly over the past several sessions. Today’s statistics provide the strongest confirmation so far that the previous deterioration in market internals may have ended.
The market is not yet at the point where the new trend can be considered fully confirmed, but the evidence is becoming increasingly compelling. A few more sessions of strong breadth, rising new highs and subdued new lows would provide additional confirmation.
NASDAQ: The Nasdaq also recorded positive breadth, although the improvement was considerably less convincing than on the NYSE.
There were 2,471 advancing issues and 2,413 declining issues, with 425 issues unchanged. This produced an advancer-to-decliner ratio of 1.02 to 1 — approximately six advancing stocks for every five declining stocks.
The Nasdaq therefore had positive breadth, but only narrowly so.
The new-high/new-low statistics, however, showed substantial improvement. The exchange recorded 211 new 52-week highs and 228 new 52-week lows, compared with 168 new highs and 350 new lows on Monday.
New 52-week highs increased by approximately 25%, while new 52-week lows declined by approximately 35%.
This is the second consecutive session in which the number of new highs has increased while the number of new lows has declined. That simultaneous improvement is an important development in assessing the health of the market.
The Nasdaq still has slightly more new 52-week lows than new highs, so its internal indicators cannot yet be described as fully strong. However, the difference has narrowed dramatically.
The previous pattern of new lows substantially exceeding new highs is rapidly disappearing. With 211 new highs versus 228 new lows, the two figures are now relatively close.
Trading volume on the Nasdaq reached approximately 8.72 billion shares, about 7% higher than the previous session’s 8.15 billion shares. The combination of a rising Nasdaq index and increased trading volume is constructive.
Nasdaq Assessment
The Nasdaq’s internal indicators remain weaker than those of the NYSE, but they are clearly strengthening.
The simultaneous increase in new 52-week highs, decrease in new 52-week lows and increase in trading volume provides evidence that the Nasdaq’s internal condition is improving.
The Nasdaq is also technically in an uptrend, and the improvement in its internal indicators provides additional support for that trend.
Market Internals Are Changing
The most important message from today’s statistics is the change in direction of the market internals.
For several weeks, the dominant pattern was:
- New 52-week lows substantially exceeded new 52-week highs.
- Market breadth was weaker.
- Internal indicators were deteriorating.
That pattern is now changing:
- New 52-week highs are increasing.
- New 52-week lows are falling sharply.
- Breadth has turned positive.
The gap between new highs and new lows has narrowed dramatically.
- On the NYSE, new highs have now moved above new lows.
- Nasdaq trading volume increased as the index advanced.
This is precisely the type of internal improvement traders should watch when attempting to identify a potential change in market trend.
Key Takeaways for Traders and Investors
- The market internals are improving rapidly. Tuesday’s statistics provide considerably stronger evidence of an internal market recovery than the headline index gains alone suggest.
- The NYSE has delivered the strongest signal. New 52-week highs exceeded new lows for the first time in several weeks, while advancing stocks outnumbered declining stocks by nearly 2 to 1.
- The new-high/new-low reversal is significant. The sharp decline in new lows combined with the increase in new highs suggests that the previous deterioration in market internals may have ended.
- The Nasdaq is improving but needs confirmation. New highs rose 25% while new lows declined 35%. The gap has narrowed substantially, but new lows still slightly exceed new highs.
- Volume is supportive on the Nasdaq. The Nasdaq advanced while trading volume increased approximately 7%, adding credibility to the recent upward move.
- The trend change is not fully confirmed yet. Traders should watch the next several sessions closely. Continued positive breadth, increasing new highs and declining new lows would provide much stronger confirmation.
- Risk management remains important. The evidence is becoming increasingly bullish, but it is still preferable to increase exposure progressively as the new trend becomes confirmed rather than move to full exposure based on a single session.
Bottom Line
Tuesday’s market statistics represent a meaningful improvement in U.S. market internals.
The NYSE has now moved from a pattern dominated by new 52-week lows to one in which new highs exceed new lows. The Nasdaq is following the same path, although it has not yet completed the reversal.
The combination of strong NYSE breadth, rising new highs, sharply declining new lows and improving Nasdaq internals suggests that a significant change in the underlying market trend may be underway.
We are not yet declaring the new trend fully confirmed. However, the evidence is increasingly pointing in that direction. If the market produces several more sessions with strong breadth, expanding new highs and declining new lows, the case for a sustained bullish trend will become considerably stronger.
For traders and investors, the message is becoming increasingly constructive: the market’s internal foundation is strengthening, and the conditions for increasing market exposure are improving.
Tuesday’s U.S. Market Wrap-Up Report
U.S. stocks extended their recovery on Tuesday, with the major indexes posting a third consecutive session of gains. The session was broadly positive, although the performance across market segments remained uneven.
The Dow Jones Industrial Average rose 253.38 points, or 0.49%, to close at 51,521.38. The S&P 500 gained 44.98 points, or 0.58%, finishing at 7,818.93, while the Nasdaq Composite advanced 122.58 points, or 0.45%, to 27,599.89. The Russell 2000 was the exception, declining 0.59% and highlighting the continued weakness in small-cap stocks.
The S&P 500 was the strongest of the three major large-cap indexes today, while the Nasdaq continued to show relatively strong performance. Growth and large-cap stocks remained the principal beneficiaries of the current market recovery.
AI Buildout Stocks Continue to Lead
Artificial intelligence infrastructure and data-center buildout companies were among the strongest performers again today. Investors continued to favour companies positioned to benefit from the enormous capital spending associated with AI infrastructure.
The strength in these stocks provided an important boost to the technology sector and helped support the Nasdaq’s advance.
Among the notable performers:
- Ciena Corporation (CIEN) surged 13.85% to close at $443.65, with approximately 6.4 million shares traded.
- Fabrinet (FN) gained 7.78% to $489.16 on approximately 1.4 million shares.
- Corning Inc. (GLW) advanced 6.02% to $168.97 on approximately 8.9 million shares.
- Lumentum Holdings (LITE) rose 3.82% to $1,133.40 on approximately 4.3 million shares.
The continued strength of AI infrastructure stocks is becoming an important theme in the current market. Traders should nevertheless distinguish between companies with strong underlying business momentum and stocks that have already experienced very large advances.
Sector Performance Broadly Positive: The sector picture was broadly constructive, with healthcare the only major sector to finish the session in negative territory.
Consumer-related stocks performed particularly well. Consumer Discretionary gained 2.98%, while Consumer Durables & Services advanced 0.86%.
Industrials rose 0.77%, Basic Materials gained 0.66%, and Financials advanced 0.49%.
Technology also remained a major source of strength, gaining approximately 2.10%. Healthcare was the weakest sector, declining 0.44%.
The broad participation across sectors is encouraging because it suggests that Tuesday’s advance was not limited exclusively to technology and AI-related stocks.
Disk Drive Stocks Under Pressure: Disk-drive manufacturers were among the most notable individual-stock losers today.
Seagate Technology Holdings (STX) fell sharply, declining 9.18% to close at $805.63, a loss of $81.46. Western Digital Corp. (WDC) also came under significant selling pressure, falling 6.93% to $411.04.
The weakness followed renewed concerns surrounding developments in disk-drive technology and competitive positioning.
The recent trading action in Seagate has been particularly volatile. The stock fell sharply on Friday following concerns about Toshiba potentially gaining market share, then recovered a substantial portion of that decline on Monday. Tuesday’s renewed selling indicates that investors remain uncertain about the industry’s competitive outlook.
For traders, this is a reminder that stocks exposed to rapidly changing technology and competitive dynamics can experience very large price swings even when the broader market is rising.
Biomedical Stocks Under Pressure: Biomedical stocks were generally weaker today, with investors appearing to take profits following recent gains in parts of the sector.
Biomedical stocks are well known for their volatility, and profit-taking can be particularly aggressive after sharp advances. The weakness in the group did not prevent the broader market from advancing, but traders should continue to expect significant price volatility in individual biotechnology and biomedical names.
Market Internals Provide an Important Confirmation
One of the most encouraging aspects of Tuesday’s session was the improvement in market internals.
On the New York Stock Exchange, 3,052 stocks advanced compared with 1,578 decliners, producing an advancer-to-decliner ratio of approximately 1.93 to 1.
More importantly, the NYSE recorded 258 new 52-week highs against 219 new 52-week lows. This was a major improvement from Monday, when there were only 220 new highs compared with 439 new lows.
The reversal in the new-high/new-low relationship is particularly significant. For the past several weeks, new 52-week lows had consistently and substantially exceeded new highs. Tuesday marked an important change, with new highs finally moving above new lows.
The Nasdaq also showed improvement. There were 2,471 advancing issues versus 2,413 declining issues. New 52-week highs increased to 211 from 168, while new lows fell to 228 from 350.
The Nasdaq’s internal indicators therefore remain weaker than those of the NYSE, but they are improving rapidly.
This combination of rising new highs, falling new lows and positive market breadth suggests that the underlying market condition is changing.
Technical Picture Improving
The technical picture is also becoming more constructive.
The Nasdaq is now trading well above its 25-day, 50-day and 200-day moving averages, giving it the strongest technical position among the major indexes.
The S&P 500 remains below its 25-day moving average but is above both its 50-day and 200-day moving averages. A move back above the 25-day moving average would provide additional confirmation of the recent recovery.
The Dow remains below its 25-day and 50-day moving averages, although it is still slightly above its 200-day moving average. The shrinking gap between the Dow and its 200-day moving average is something investors should continue to monitor.
The Russell 2000 remains the weakest of the major indexes. Small-cap stocks declined today and remain well below their 25-day and 50-day moving averages, while trading only slightly above the 200-day moving average.
The weakness in small caps remains one of the main reasons to maintain some caution despite the improving large-cap market.
Treasury Yields and Oil: The U.S. 10-year Treasury yield eased to approximately 5.27%, providing some relief for equity valuations. Lower Treasury yields can be particularly supportive for growth and technology stocks, where valuations are more sensitive to interest-rate expectations.
Oil prices also declined by approximately 1%. The decline followed the decision by G7 countries to release a substantial amount of oil from strategic reserves.
Lower oil prices can have mixed implications for the market. They can benefit consumers and many businesses by reducing energy costs, although they can put pressure on energy-sector companies.
Key Takeaways for Traders and Investors
- The market has now gained for three consecutive sessions. The recovery is becoming increasingly credible, although it is not yet fully confirmed.
- Market breadth is strongly positive. The NYSE produced almost two advancing stocks for every declining stock, indicating that the rally is broader than the headline index gains alone suggest.
- The new-high/new-low reversal is the most important development. On the NYSE, new 52-week highs finally exceeded new lows after several weeks of the opposite pattern.
- The Nasdaq remains the technical leader. It is above its 25-day, 50-day and 200-day moving averages and continues to benefit from strong demand for technology and AI-related stocks.
- AI infrastructure remains a powerful market theme. Ciena, Fabrinet, Corning and Lumentum were among the notable winners today, demonstrating continued investor enthusiasm for companies involved in the AI data-center buildout.
- Small-cap weakness remains a warning sign. The Russell 2000 continues to lag significantly. A broader and more convincing bull-market signal would require participation from small-cap stocks.
- Lower Treasury yields are helping growth stocks. The decline in the 10-year yield provides some support for technology and other rate-sensitive sectors.
- Individual-stock volatility remains high. The sharp declines in Seagate and Western Digital demonstrate that strong market conditions do not protect individual stocks from company- or industry-specific selling pressure.
Bottom Line
Tuesday’s U.S. market session was encouraging for both traders and investors.
The major indexes have now advanced for three consecutive sessions, technology and AI infrastructure stocks remain strong, market breadth is positive, and — most importantly — the new-high/new-low indicators are showing a potentially significant reversal.
The NYSE has already moved into a more favourable internal configuration, while the Nasdaq is rapidly following. This suggests that the improvement is becoming broader and more deeply rooted.
However, the recovery is not yet fully confirmed. The Russell 2000 remains weak, the Dow is still below its short-term moving averages, and the S&P 500 has yet to reclaim its 25-day moving average.
For now, the evidence supports a constructive but still cautious stance. If the market produces several more sessions of strong breadth, rising new highs, declining new lows and broader participation from small-cap stocks, the probability of a durable bullish trend will increase substantially.
The market is showing signs of a trend change. Traders and investors should be paying close attention to the next few sessions because confirmation of these improving internals could provide an important signal to increase market exposure.
.
NOTICE TO READERS
The Canadian Vanguard Stock Market is about empowering you to build and manage your wealth by yourself. There is certainly no magic in managing finances or wealth but one needs to know what to do and commit to doing what is needed. When you are ready to start the journey to Take Charge and Put Your Destiny In Your Own Hands, start with reading The Canadian Vanguard every market day. If and when you need more related information or to advertise your business products or services in The Canadian Vanguard, Contact Us
Our readers are strongly advised to conduct their own research into individual stocks before making a purchase decision. In addition, investors are advised that past stock performance is no guarantee of future price appreciation. Any recommendation is not a guarantee of any particular stock’s future prices, and The Canadian Vanguard accepts no responsibility or liability for investors’ or readers’ purchases.
Stocks In The News/ Stocks To Watch and Market Strategy will soon be available only to Paying Subscribers. The dollar sign “$” in the Toronto Market section in the articles only stands for Canadian dollar and in the US market section “$” stands for US dollar.
(c) This article is published by The Canadian Vanguard on October 6, 2026