
TSX Slips While U.S. Markets Edge Higher as Bond Yields Ease and Oil Prices Rise
The Canadian Vanguard Stock Market Report Thursday, October 1, 2026, Edition
.
The Toronto Market
Thursday’s Toronto Market Index
The S&P/TSX Composite Index declined 81.11 points, or 0.23%, on Thursday, closing at 35,154.76.

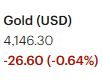


The TSX opened below the previous session’s close and remained in negative territory throughout the trading day. Market breadth was also negative, reflecting broader weakness across the market. The index established its session low within the first half-hour of trading before recovering steadily from that level, although the rebound was not sufficient to push the index back into positive territory.
This early-session pattern has become increasingly evident over the past several trading sessions. The TSX has been opening sharply lower, establishing an early low, and then recovering a portion of those losses while still closing in negative territory. The repeated intraday recovery suggests that buyers have been stepping in at lower levels, even as the broader short-term trend remains under pressure.
From a technical perspective, the TSX continues to trade below both its 25-day and 50-day moving averages, indicating that short- and intermediate-term momentum remains weak. The index, however, remains comfortably above its 200-day moving average, leaving the longer-term trend in a considerably stronger position than the recent short-term price action would suggest.
Tuesday’s TSX Market Statistics
Market breadth on the TSX was negative, with declining issues outnumbering advancing issues. There were 1,209 decliners compared with 990 advancers, producing a decliner-to-advancer ratio of 1.22 to 1—approximately six decliners for every five advancers. A total of 134 issues were unchanged.
The weakness in breadth extended to the market’s 52-week highs and lows. The exchange recorded 37 new 52-week highs and 201 new 52-week lows, compared with 51 new highs and 197 new lows in the previous session. The ratio of new highs to new lows therefore deteriorated, with new lows continuing to substantially outnumber new highs. This remains an important indication of weakness in the market’s internal structure.
Market breadth has now been negative for four consecutive sessions. The number of new 52-week highs declined from the previous session, while new 52-week lows increased by approximately 2%. Although the increase in new lows was relatively modest, the continued imbalance between new highs and new lows suggests that the market’s internal indicators remain under pressure. The deterioration in these measures warrants continued monitoring before concluding that the recent weakness has run its course.
Trading volume provided a contrasting signal. Total TSX volume reached 413,324,869 shares, 5.5% higher than the 391,608,735 shares traded in the previous session. The increase in volume indicates greater participation as the index declined, while the combination of negative breadth, a substantial excess of new lows over new highs, and higher volume points to continued weakness beneath the surface of the index.
Taken together, the market internals remain weak. While individual indicators can improve from session to session, the broader pattern has yet to provide convincing evidence of a sustained improvement in the TSX’s internal condition. For the time being, the deterioration in breadth and the persistent dominance of new 52-week lows warrant a cautious approach to trading the Toronto market.
Tuesday’s Toronto TSX Market Wrap-Up Report
The Toronto market remained under pressure on Tuesday, with the S&P/TSX Composite Index declining for a fourth consecutive session. The index fell 81.11 points, or 0.23%, to close at 35,154.76.
The trading pattern continues to warrant attention. The TSX opened below the previous session’s close and remained in negative territory throughout the day, but established its session low within the first half-hour before recovering a portion of the early decline. This pattern of an early sell-off followed by an intraday recovery has appeared repeatedly over the past several sessions. While buyers have demonstrated an ability to provide support at lower levels, they have not yet generated sufficient momentum to push the index back into positive territory.
From a technical perspective, the TSX remains below both its 25-day and 50-day moving averages, keeping short- and intermediate-term momentum under pressure. The longer-term picture remains different, however, as the index continues to trade comfortably above its 200-day moving average.
Market Internals Remain Weak
The market’s internal indicators continue to provide a less encouraging picture than the index itself.
Declining issues outnumbered advancing issues by 1,209 to 990, producing a decliner-to-advancer ratio of 1.22 to 1. This means that approximately six stocks declined for every five that advanced, with 134 issues unchanged.
The new-high/new-low data also continued to reflect underlying weakness. The TSX recorded only 37 new 52-week highs against 201 new 52-week lows. In the previous session, there were 51 new highs and 197 new lows. The deterioration in the high-to-low ratio, together with the continued dominance of new lows, indicates that weakness remains relatively broad beneath the surface of the index.
Market breadth has now been negative for four consecutive sessions. Until the number of advancing issues and new 52-week highs begin to improve on a sustained basis, the internal market picture remains weakened.
Trading volume increased at the same time. Total TSX volume reached 413.3 million shares, approximately 5.5% above the 391.6 million shares traded in the previous session. The combination of higher volume, negative breadth and a substantial excess of new 52-week lows over new highs is an important consideration for traders monitoring the market’s underlying condition.
Sector Performance
Sector performance was mixed, but the overall picture remained defensive.
Technology and Energy were the strongest-performing sectors on Tuesday, gaining 1.05% and 1.01%, respectively. These gains provided some support to the broader market and helped limit the TSX’s overall decline.
The Financials sector, however, continued to underperform. Financials declined 0.32% and have now underperformed for four consecutive sessions. Given the significant weighting of financial stocks within the Canadian market, continued weakness in this group remains important to the overall direction of the TSX.
Only three TSX sectors finished higher on the day. Healthcare declined 0.84%, while Basic Materials was the weakest-performing sector, falling 1.26%. Continued weakness across materials and other resource-related areas remains an important factor for investors monitoring the composition of the market decline.
Stocks in Focus
Shopify Inc. (TSX: SHOP) continued its recent advance, rising 0.56% on Tuesday on volume of approximately 1.69 million shares. The stock has now advanced for two consecutive sessions.
The recent price action in Shopify is worth monitoring within the broader context of a technology sector that was among Tuesday’s stronger-performing groups. Traders may want to watch whether the stock can maintain its recent momentum and whether the technology sector continues to provide leadership while other major areas of the TSX remain under pressure.
Aecon Group Inc. (TSX: ARE) also remains a stock of interest in light of the Canadian government’s focus on infrastructure and major development projects. Any expansion of infrastructure spending could create opportunities for companies positioned to participate in such projects. Investors should, however, distinguish between potential industry benefits and the company’s actual financial and operating performance when evaluating the stock.
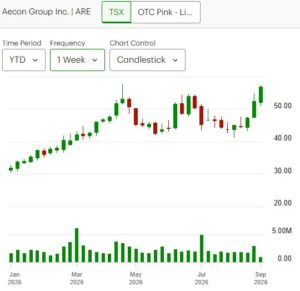
Aecon is also scheduled to release its third-quarter 2026 financial results after market close on Thursday, October 29, followed by a conference call. Investors following ARE should have the reporting date on their calendar, as the results and subsequent management commentary could provide a more direct assessment of the company’s current operating position.
Canadian Banks Remain Under Pressure
The Canadian banking group remained weak, with all six of the country’s largest banks declining on Tuesday.
The continued weakness in the major banks is notable given their importance to the TSX and the financial sector’s significant representation in the index. Market uncertainty surrounding tariffs and other economic and trade developments may be contributing to investor caution toward the financial sector, although the precise drivers of the individual stocks’ movements cannot be established from the day’s price action alone.
For traders and investors, the continued underperformance of the banks is therefore an important trend to monitor rather than an isolated one-day move.
Key Takeaways for Traders and Investors
- The TSX remains in a short-term downtrend. The index has declined for four consecutive sessions and remains below its 25-day and 50-day moving averages.
- The longer-term trend remains above the 200-day moving average. This creates an important distinction between the current short-term weakness and the broader trend.
- Market breadth remains weak. Decliners outnumbered advancers by 1.22 to 1, and breadth has now been negative for four consecutive sessions.
- New lows continue to dominate new highs. Tuesday produced 37 new 52-week highs versus 201 new lows, highlighting continued weakness beneath the index.
- Volume increased as the market declined. The 5.5% increase in volume adds significance to Tuesday’s negative session and warrants monitoring.
- Sector leadership remains narrow. Technology and Energy provided relative strength, while Financials, Healthcare and Basic Materials remained under pressure.
- The major Canadian banks remain a key area to watch. Continued weakness in the financial sector could remain relevant to the TSX’s overall performance.
- Stock-specific opportunities still exist. Shopify’s recent strength and Aecon’s upcoming earnings announcement provide individual situations for traders and investors to monitor, even while the broader market internals remain weak.
- The market internals warrant caution. A sustained improvement in breadth, new highs and the performance of major sectors would provide more evidence that the current weakness is beginning to ease.
.
The US Markets
Thursday’s U.S. Market Indexes
U.S. equities recovered modestly on Thursday following the previous session’s weakness, with all four major indexes finishing higher. The gains, however, were relatively limited, with none of the major indexes advancing by more than 0.35%.

The Dow Jones Industrial Average rose 20.51 points, or 0.04%, to close at 50,926.56. The S&P 500 gained 14.91 points, or 0.19%, finishing at 7,666.45. The Nasdaq Composite edged higher by 10.53 points, or 0.04%, to close at 26,871.60. The Russell 2000 was the strongest performer, advancing 9.76 points, or 0.35%, to finish at 2,806.63.
The broad improvement from Wednesday’s session was notable, although the magnitude of the gains remained modest. The S&P 500 recovered most of its previous session’s 0.25% decline, while the Dow and Nasdaq posted only marginal gains. The fact that all four major indexes finished higher provided some relief following Wednesday’s market weakness, but the relatively small advances suggest that investors remain cautious.
One factor supporting the market was a modest easing in Treasury yields. The 10-year Treasury yield declined somewhat after recently reaching its highest level in approximately 24 years. The retreat in yields provided some relief to equity markets, particularly smaller-cap stocks, and may have contributed to the Russell 2000’s relative strength on Thursday. Oil prices also moved modestly higher.
The market therefore received some support from slightly more favourable conditions in interest rates and commodities. However, the response in equities was restrained, with gains across all four major indexes remaining below 0.35%. This suggests that Thursday’s advance represented a modest recovery rather than a decisive change in market momentum.
Technical Picture
The technical picture remains mixed across the major U.S. indexes.
The Nasdaq Composite and S&P 500 remain comfortably above both their 50-day and 200-day moving averages, preserving their longer-term technical strength. Their positions relative to the 25-day moving average, however, have diverged.
The Nasdaq has moved back above its 25-day moving average, while the S&P 500 remains below its 25-day moving average. This divergence is worth monitoring because the 25-day moving average provides a useful indication of short-term market momentum.
The Dow Jones remains below both its 25-day and 50-day moving averages, although it continues to trade above its 200-day moving average. The increasingly narrow gap between the Dow and its 200-day moving average is also worth watching, as a further decline would bring the index closer to an important longer-term technical reference point.
The Russell 2000 continues to show the weakest technical positioning among the four major indexes. It remains below both its 25-day and 50-day moving averages and is only modestly above its 200-day moving average. Although the Russell 2000 produced the strongest gain on Thursday, its broader technical structure remains considerably weaker than that of the Nasdaq and S&P 500.
Overall, Thursday’s session provided some relief following the previous day’s decline, but the relatively small gains and mixed technical signals suggest that the U.S. equity market remains at an important short-term juncture. The behaviour of Treasury yields, the ability of the major indexes to reclaim or hold their shorter-term moving averages, and the continued relative performance of the Russell 2000 will be important areas to monitor in the sessions ahead.
Thursday’s U.S. Market Statistics
New York Stock Exchange (NYSE): Market breadth on the New York Stock Exchange improved on Thursday, with advancing issues outnumbering declining issues. There were 2,617 advancers compared with 2,128 decliners, while 468 issues were unchanged. This produced an advancer-to-decliner ratio of 1.23 to 1, or approximately six advancing stocks for every five declining stocks.
Despite the positive breadth, the new-high/new-low statistics continued to point to considerable underlying weakness. The NYSE recorded 97 new 52-week highs and 744 new 52-week lows, compared with 104 new highs and 498 new lows in the previous session.
The number of new 52-week highs declined by approximately 7% from Wednesday, while new 52-week lows increased by approximately 49%. Consequently, new 52-week lows outnumbered new highs by more than 7 to 1. New highs represented only about 13% of the number of new lows.
This remains an important distinction for traders and investors. Although daily breadth was positive, the much larger number of new 52-week lows indicates that the underlying market structure remains weak. A single session of positive breadth does not, by itself, establish a sustained improvement in market internals.
NYSE trading volume reached approximately 5.97 billion shares, about 2% higher than the previous session’s 5.84 billion shares. Volume was also close to its 50-day average, suggesting that Thursday’s advance occurred with relatively normal levels of participation.
Overall, the NYSE’s internal indicators improved in one important respect—daily breadth—but the new-high/new-low data remained decidedly weak. The continued dominance of new 52-week lows is an indication that market weakness remains broad beneath the surface.
NASDAQ: NASDAQ market breadth was also positive on Thursday, although only modestly so. There were 2,532 advancing issues compared with 2,360 declining issues, with 483 issues unchanged. This produced an advancer-to-decliner ratio of 1.07 to 1, meaning that there were only slightly more advancing stocks than declining stocks.
The new-high/new-low statistics remained considerably weaker. The NASDAQ recorded 68 new 52-week highs against 528 new 52-week lows, compared with 84 new highs and 370 new lows on Wednesday.
New 52-week highs therefore declined by approximately 19% from the previous session, while new 52-week lows increased by approximately 43%. The resulting imbalance—528 new lows versus only 68 new highs—continues to indicate significant weakness in the NASDAQ’s internal market structure.
NASDAQ trading volume totaled approximately 7.61 billion shares, compared with 9.20 billion shares in the previous session. Despite the higher NASDAQ index close, trading volume therefore declined by approximately 17%.
The combination of a modestly positive advance-decline ratio and substantially lower trading volume suggests that Thursday’s recovery did not yet represent a decisive change in market momentum. The index may be attempting to stabilize, but the internal indicators have not yet confirmed a broad-based recovery.
Market Internals: What Traders Should Watch
Thursday’s statistics present a mixed picture. Daily breadth improved on both the NYSE and NASDAQ, and all of the major U.S. indexes finished higher. However, the new-high/new-low figures remained heavily skewed toward new lows on both exchanges.
This divergence is important. The indexes can stabilize or advance even while a significant number of individual stocks remain under pressure. For traders and investors, the continued expansion of new 52-week lows suggests that the broader market has not yet achieved a convincing improvement in internal strength.
The modest recovery in the major indexes also occurred alongside a retreat in Treasury yields. Lower yields can provide support to equity valuations, particularly growth-oriented and smaller-cap stocks. Whether this support persists will depend in part on the direction of interest rates in the coming sessions.
For now, the market appears to be in a period of transition rather than having established a clear new trend. Traders should monitor whether the number of advancing issues continues to exceed declining issues, whether new 52-week lows begin to contract meaningfully, and whether new highs begin to expand. A sustained improvement across these measures would provide stronger evidence that market internals are recovering.
Until then, the continued imbalance between new highs and new lows warrants a measured approach to risk, particularly when evaluating individual stocks that are moving against the broader market trend.
Thursday’s U.S. Market Wrap-Up Report
U.S. equities recovered modestly on Thursday as Treasury yields eased from recently elevated levels, providing some relief to stocks. The advance came despite another rise in crude oil prices, with investors appearing to place greater emphasis on the movement in bond yields than on the increase in oil.
The Dow Jones Industrial Average rose 20.51 points, or 0.04%, to close at 50,926.56. The S&P 500 gained 14.91 points, or 0.19%, to finish at 7,666.45. The Nasdaq Composite edged higher by 10.53 points, or 0.04%, closing at 26,871.60. The Russell 2000 was the strongest of the four major indexes, rising 9.76 points, or 0.35%, to 2,806.63.
Although all four major indexes finished higher, the gains were modest. The session therefore represented a recovery from Wednesday’s weakness rather than a decisive change in market direction.
Treasury Yields Remain a Key Market Driver
Treasury yields continued to be an important influence on equity trading. The 10-year Treasury yield eased by approximately five basis points to 5.24%, following a sustained period of rising yields and recently reaching levels not seen in roughly 24 years.
The retreat in yields provided some breathing room for equities, particularly growth-oriented stocks. The relationship between Treasury yields and stock prices remains an important factor for traders to monitor because another sustained rise in long-term yields could once again place pressure on equity valuations.
Crude oil moved in the opposite direction. Oil prices rose on Thursday, with the global crude benchmark advancing 4.4% to $102.31 per barrel. Despite the increase in energy prices and continuing geopolitical uncertainty, the major U.S. indexes were able to finish higher.
The combination of higher oil prices and lower Treasury yields produced a mixed macroeconomic backdrop. For Thursday’s session, the decline in yields appeared to provide greater support to equities than the rise in crude prices provided resistance.
Market Breadth and Internals
Market breadth improved on Thursday. On the NYSE, 2,617 stocks advanced compared with 2,128 decliners, producing an advancer-to-decliner ratio of 1.23 to 1. NASDAQ breadth was also positive, although considerably less so, with 2,532 advancers versus 2,360 decliners and an advancer-to-decliner ratio of 1.07 to 1.
The positive breadth was encouraging, but the new-high/new-low statistics remained a significant concern.
The NYSE recorded 97 new 52-week highs against 744 new 52-week lows. On the NASDAQ, there were only 68 new 52-week highs compared with 528 new 52-week lows. The substantial imbalance between new highs and new lows indicates that weakness remains widespread among individual stocks, even though the major indexes managed to advance.
Trading volume was also mixed. NYSE volume reached approximately 5.97 billion shares, about 2% higher than Wednesday. NASDAQ volume, however, declined approximately 17%, from 9.20 billion shares to 7.61 billion shares.
Consequently, Thursday’s improvement in the indexes should be viewed within the context of still-weakened market internals. A sustained improvement would be more convincing if it were accompanied by expanding new highs, declining new lows and stronger participation across individual stocks.
Sector Performance
Sector leadership was relatively narrow. Only four of the major sectors finished higher.
Energy was the strongest-performing sector, gaining 1.48%, followed by Utilities, which rose 0.93%. Technology advanced 0.51%, while Industrials gained 0.40%.
The strength in Energy was consistent with the day’s increase in crude oil prices. Technology’s gain was particularly relevant given the sector’s sensitivity to Treasury yields. The retreat in the 10-year yield provided some relief to growth-oriented equities and helped the broader technology group recover.
Stocks in Focus
Nike: Nike reported its quarterly results after Thursday’s market close, and the initial reaction was negative. The company reported quarterly sales of approximately $11.2 billion, down 4% from the prior year, and forecast a high-single-digit percentage decline in fiscal 2027 revenue. Nike also announced additional restructuring and job cuts as part of a plan intended to generate $2.5 billion in savings through fiscal 2031. Shares declined sharply in after-hours trading following the announcement.
For traders, the immediate focus will be on Friday’s regular-session reaction and whether the weakness remains confined to Nike or spreads to other consumer and retail stocks.
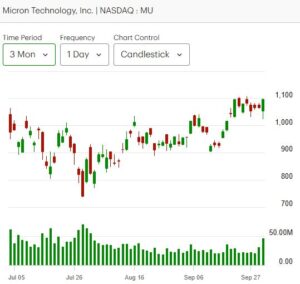
Micron Technology and the Memory-Semiconductor Group: Micron Technology remained an important stock to watch following its fiscal fourth-quarter results released Wednesday. The company reported record quarterly revenue of $54.23 billion and provided a strong outlook for the next quarter, supported by continued demand for memory products associated with artificial intelligence infrastructure.
Micron’s stock initially opened lower following the earnings announcement but subsequently reversed and finished substantially higher. The strength extended into other memory and semiconductor stocks.
SanDisk rose 2.75%, while Tower Semiconductor gained 6.10%. Intel declined marginally by 0.19%. NVIDIA also advanced 1.09%, with approximately 98.6 million shares changing hands.
The contrasting performance within the semiconductor group is worth monitoring. Strong reactions in memory and AI-related stocks can influence broader technology-sector sentiment, particularly when Treasury yields are moving lower.
Technical and Market Outlook
Thursday’s session provided some relief for U.S. equities, but the broader evidence remains mixed.
The Nasdaq and S&P 500 remain above their 50-day and 200-day moving averages, although they are positioned differently relative to their 25-day moving averages. The Nasdaq has moved back above its 25-day moving average, while the S&P 500 remains below it.
The Dow continues to trade below both its 25-day and 50-day moving averages, although it remains above its 200-day moving average. The narrowing distance between the Dow and its 200-day moving average is becoming increasingly important from a longer-term technical perspective.
The Russell 2000 remains below its 25-day and 50-day moving averages and only modestly above its 200-day moving average. Despite posting the largest percentage gain among the four major indexes on Thursday, its technical position remains comparatively weak.
Key Takeaways for Traders and Investors
- Thursday brought a modest recovery, not a decisive reversal. All four major indexes advanced, but none gained more than 0.35%.
- Treasury yields remain a critical market driver. The decline in the 10-year yield provided some relief to equities, particularly technology and growth stocks.
- Market breadth improved, but internal weakness persists. Both the NYSE and NASDAQ recorded more advancing than declining stocks, yet new 52-week lows continued to overwhelm new highs.
- The new-high/new-low imbalance remains significant. The NYSE recorded 744 new lows versus 97 new highs, while the NASDAQ recorded 528 new lows versus only 68 new highs.
- Technology remains sensitive to interest-rate movements. The retreat in Treasury yields coincided with a 0.51% gain in the Technology sector.
- Small-cap stocks remain technically vulnerable. The Russell 2000 produced Thursday’s strongest index gain but remains below its 25-day and 50-day moving averages.
- Semiconductor stocks remain an important area of market leadership. The reaction to Micron’s earnings and the strength in several memory-related stocks warrant continued monitoring.
- Nike’s earnings reaction provides a reminder of company-specific risk. Its disappointing sales outlook and restructuring announcement produced a sharp after-hours decline.
- Confirmation is still needed. A more convincing improvement in market conditions would be reflected by sustained positive breadth, fewer new 52-week lows, expanding new highs and stronger participation across individual stocks.
.
NOTICE TO READERS
The Canadian Vanguard Stock Market is about empowering you to build and manage your wealth by yourself. There is certainly no magic in managing finances or wealth but one needs to know what to do and commit to doing what is needed. When you are ready to start the journey to Take Charge and Put Your Destiny In Your Own Hands, start with reading The Canadian Vanguard every market day. If and when you need more related information or to advertise your business products or services in The Canadian Vanguard, Contact Us
Our readers are strongly advised to conduct their own research into individual stocks before making a purchase decision. In addition, investors are advised that past stock performance is no guarantee of future price appreciation. Any recommendation is not a guarantee of any particular stock’s future prices, and The Canadian Vanguard accepts no responsibility or liability for investors’ or readers’ purchases.
Stocks In The News/ Stocks To Watch and Market Strategy will soon be available only to Paying Subscribers. The dollar sign “$” in the Toronto Market section in the articles only stands for Canadian dollar and in the US market section “$” stands for US dollar.
(c) This article is published by The Canadian Vanguard on October 1, 2026