
Big Caps Lead as Tech-Heavy Nasdaq Slips Amid Middle East Tensions and Elevated Oil Prices
The Canadian Vanguard Stock Market Report – Monday October 12, 2026 Edition
.
The Toronto Market
The Canadian Markets were closed on Monday for the Thanksgiving Public Holiday
.
The US Markets
Monday’s U.S. Market Indexes
U.S. stock markets closed mixed on Monday. The Dow Jones Industrial Average advanced 195.60 points, or 0.38%, to close at 51,850.55. The S&P 500 slipped 4.30 points, or 0.06%, to finish at 7,807.24. The Nasdaq Composite fell 120.27 points, or 0.44%, to close at 27,245.90. Meanwhile, the Russell 2000 declined 12.50 points, or 0.45%, to end the session at 2,794.48.

The mixed performance ended the market’s two-session streak of broad index gains. Large-cap stocks regained the upper hand, with the Dow Jones emerging as the session’s strongest performer. The Russell 2000 and Nasdaq Composite were the weakest indexes, posting nearly identical percentage declines. Technology stocks, particularly semiconductor manufacturers, weighed on the Nasdaq.
The Nasdaq Composite and S&P 500 remain comfortably above their 25-day, 50-day, and 200-day moving averages, indicating that their broader technical trends remain positive. The S&P 500 continues to hold above its 25-day and 50-day moving averages following Friday’s advance.
The Dow Jones Industrial Average has moved back above its 25-day moving average but remains below its 50-day moving average, suggesting that its shorter-term momentum has improved while a key technical hurdle remains.
The Russell 2000, meanwhile, fell below both its 25-day and 50-day moving averages on Monday. However, the small-cap index remains above its 200-day moving average, although the gap narrowed during the session. This development points to weakening short-term momentum in small-cap stocks, even as the index remains above its longer-term trend indicator.
Monday’s U.S. Market Statistics
New York Stock Exchange (NYSE): Declining issues outnumbered advancing issues on the New York Stock Exchange (NYSE). The exchange recorded 2,328 decliners, 2,129 advancers, and 462 unchanged issues, resulting in a decliner-to-advancer ratio of 1.09 to 1. This translates to approximately eleven declining stocks for every ten advancing stocks, indicating negative and relatively weak market breadth.
The NYSE recorded 149 new 52-week highs and 272 new 52-week lows, compared with 141 new highs and 183 new lows on Friday. The number of new highs increased by approximately 5.7%, while new lows surged by approximately 48.6%.
Total NYSE trading volume reached 4,242,067,410 shares, approximately 12.8% below Friday’s volume of 4,865,646,199 shares.
Market internals weakened on Monday following Friday’s improvement. Although the number of new 52-week highs increased modestly, the sharp rise in new lows was a notable negative development. After briefly breaking the recent pattern of new 52-week lows substantially outnumbering new highs, the market reverted to that pattern on Monday, with 272 new lows against 149 new highs.
Overall, NYSE market internals remain weak. Monday’s deterioration raises questions about the sustainability of Friday’s improvement. Further trading sessions will be needed to determine whether market breadth and other internal indicators can strengthen on a more consistent basis.
NASDAQ: On the NASDAQ, declining stocks also outnumbered advancing stocks. The exchange recorded 3,008 decliners, 1,888 advancers, and 435 unchanged issues, producing a decliner-to-advancer ratio of 1.59 to 1. In other words, approximately three stocks declined for every two that advanced. This indicates negative market breadth and a deterioration in the exchange’s internal indicators.
The NASDAQ recorded 88 new 52-week highs and 398 new 52-week lows, compared with 72 new highs and 272 new lows on Friday. The number of new highs increased by approximately 22.2%, while new lows rose by approximately 46.3%.
Despite the increase in new highs, new lows continued to dominate. The ratio of new 52-week highs to new 52-week lows stood at approximately 0.22 to 1, meaning there was roughly one new high for every 4.5 new lows. This imbalance highlights the continued weakness beneath the surface of the NASDAQ market.
Total NASDAQ trading volume reached 6,599,019,353 shares, approximately 6.9% below Friday’s volume of 7,090,067,392 shares. The NASDAQ Composite declined on Monday while trading volume decreased, indicating that the pullback occurred on lighter volume than in the previous session.
Overall, NASDAQ market internals weakened on Monday. Although the number of new 52-week highs increased, the much larger rise in new lows and the continued dominance of decliners point to persistent underlying weakness. The market will need to demonstrate more sustained improvement in breadth and the balance between new highs and new lows before a meaningful recovery in internal indicators can be confirmed.
.
Monday’s U.S. Market Wrap-Up Report
Mixed Close Masks Underlying Market Weakness
U.S. stock markets closed mixed on Monday as rising oil prices amid escalating tensions in the Middle East weighed on investor sentiment. The bond market was closed for the Columbus Day holiday. The Dow Jones Industrial Average outperformed the broader market, while technology stocks, particularly semiconductor manufacturers, came under renewed selling pressure. Small-cap stocks also weakened, leaving the Nasdaq Composite and Russell 2000 as the session’s laggards.
The Dow Jones Industrial Average advanced 195.60 points, or 0.38%, to close at 51,850.55. The S&P 500 slipped 4.30 points, or 0.06%, to finish at 7,807.24. The Nasdaq Composite fell 120.27 points, or 0.44%, to close at 27,245.90, while the Russell 2000 declined 12.50 points, or 0.45%, to end at 2,794.48.
Monday’s mixed performance interrupted the market’s recent advance. Although the Dow demonstrated relative strength, the broader market struggled to maintain its upward momentum. The weakness in technology and small-cap stocks suggests that the market’s advance remains uneven.
Sector Performance: Telecommunications and Energy Lead
Six of the eleven S&P 500 sectors finished higher on Monday. Telecommunications Services led the gainers, advancing 1.31%, followed by Energy, which rose 1.25%. Durable Consumer Goods & Services gained 1.19%, while Financials advanced 0.35% and Utilities added 0.32%.
Energy stocks benefited from rising oil prices amid escalating geopolitical tensions in the Middle East. Meanwhile, the relative strength in Telecommunications Services and other defensive areas helped offset weakness in technology-related stocks.
The sector performance reflected a divided market, with strength in selected areas failing to translate into broad-based gains across the major indexes.
Semiconductor Stocks Extend Their Losing Streak
Semiconductor stocks remained under significant selling pressure on Monday, extending their declines to a third consecutive session. Several prominent chipmakers recorded notable losses, weighing on the Nasdaq Composite.
- SanDisk Corp. (SNDK) fell 5.97% to close at $1,487.33, with 8.8 million shares traded.
- Micron Technology Inc. (MU) declined 3.88% to finish at $989.04, with 23.9 million shares traded.
- Intel Corp. (INTC) dropped 3.20% to close at $101.35, with 72.2 million shares traded.
- Nvidia Corp. (NVDA) slipped 1.29% to finish at $226.32, with 70.7 million shares changing hands.
The continued weakness in semiconductor stocks was a significant drag on technology shares. AI-related stocks also declined on Monday, adding to the pressure on the technology-heavy Nasdaq.
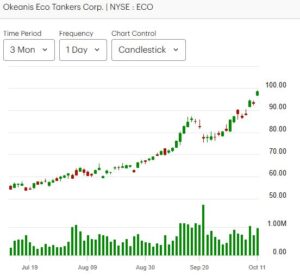
Oil price keeps rising. Refiners and Oil Shipper company stocks are the stocks to follow for now.
- Okeanis ECO Tankers Corp (ECO) rose 5.93% with 953.6 thousand shares traded
- Tsakos Energy Navigation (TEN) rose 6.19%, closed at $54.58 with 779.7 thousand shares traded
- Scorpio Tankers Inc. rose 2.76%, closed at $87.49 with 1.2 million shares changing hands
- Marathon Petroleum Corp (MPC) rose 0.83%, closed at $458.81 with 1.5 million shares traded
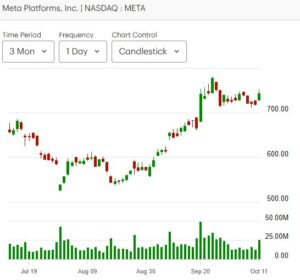
Outside of Oil and Oil shipping, META Platforms (META) and some financials continued to outperform.
- Meta Platforms (META) rose 3.38%, closed at $746.92 with 24.9 million shares traded.
- Fair Isaac Inc. (FICO) rose 10.85%, closed at $740.00 with 2.0 million shares traded
The three-session decline in semiconductor stocks warrants close attention from traders. Investors should monitor whether the selling pressure begins to ease or spreads further across the broader technology sector. A sustained recovery in chipmakers could help stabilize the Nasdaq, while continued weakness could weigh on the index’s near-term performance.
Market Internals: A Deteriorating Picture Beneath the Surface
Market breadth weakened on both the New York Stock Exchange (NYSE) and the Nasdaq, reinforcing concerns about the durability of the broader market advance.
On the NYSE, declining issues totaled 2,328, compared with 2,129 advancing issues, producing a decliner-to-advancer ratio of 1.09 to 1. The exchange recorded 149 new 52-week highs and 272 new 52-week lows. Compared with Friday, new highs increased by approximately 5.7%, but new lows surged by approximately 48.6%.
The Nasdaq displayed greater weakness. Declining issues reached 3,008, against 1,888 advancing issues, resulting in a decliner-to-advancer ratio of 1.59 to 1. The exchange registered 88 new 52-week highs and 398 new 52-week lows. Although new highs increased by approximately 22.2% from Friday, new lows rose by approximately 46.3%.
The sharp increase in new lows on both exchanges is particularly noteworthy. It suggests that weakness is extending across a substantial number of individual stocks, even as some major indexes remain near elevated levels.
Trading volume declined on both exchanges. NYSE volume fell approximately 12.8% to 4.24 billion shares, while Nasdaq volume decreased approximately 6.9% to 6.60 billion shares. Lower volume on a declining-index day may indicate reduced trading activity, but it does not independently confirm that selling pressure has run its course.
Overall, market internals deteriorated on Monday following Friday’s improvement. The increase in new 52-week highs was encouraging, but the much sharper rise in new lows remains a concern. Additional sessions will be needed to determine whether Friday’s improvement was the beginning of a sustained recovery or merely a temporary interruption in the weakening trend.
Technical Outlook: Large Caps Hold Up Better
Despite Monday’s mixed close, the Nasdaq Composite and S&P 500 remain above their 25-day, 50-day, and 200-day moving averages. Their positions above these widely followed technical indicators suggest that their broader trends remain constructive, although deteriorating market breadth warrants caution.
The Dow Jones Industrial Average has moved above its 25-day moving average but remains below its 50-day moving average. This indicates improving short-term momentum, although the index has yet to reclaim an important intermediate-term technical level.
The Russell 2000 suffered a more notable setback, falling below both its 25-day and 50-day moving averages. The index remains above its 200-day moving average, but the narrowing gap indicates that its longer-term technical cushion is diminishing.
The divergence between large-cap indexes and small-cap stocks remains important. While the Dow continues to demonstrate relative strength, weakness in the Russell 2000 and deteriorating market breadth suggest that the rally lacks uniform participation.
Financials in Focus as Big Banks Begin Reporting Earnings
Financial stocks will be in focus this week as major U.S. banks begin reporting quarterly earnings on Tuesday. Investors will be watching earnings results, management guidance, loan growth, credit quality, and commentary on the economic outlook.
Stronger-than-expected results and constructive guidance could support financial stocks and help improve sentiment across the broader market. Conversely, disappointing earnings or cautious commentary could introduce additional volatility.
Traders should pay particular attention to how financial stocks respond to earnings announcements rather than relying solely on headline results. Market reactions will help reveal whether investors are willing to reward strong fundamentals or remain cautious amid broader market uncertainty.
Key Takeaways for Traders and Investors
1. Do not confuse index resilience with broad market strength.
The Dow’s advance and the S&P 500’s relatively small decline may suggest stability at the index level. However, negative breadth on both exchanges and the sharp increase in new 52-week lows indicate that many individual stocks are struggling. Traders should assess market breadth alongside index performance.
2. Monitor semiconductor stocks for signs of stabilization.
The third consecutive session of declines among major chipmakers and continued weakness in AI-related stocks are potential headwinds for the Nasdaq. A sustained recovery in semiconductor stocks could help restore technology-sector momentum. Further declines could deepen the pressure on growth-oriented stocks.
3. Watch the Russell 2000 closely.
The Russell 2000’s fall below its 25-day and 50-day moving averages signals deteriorating short-term momentum. Its ability to hold above the 200-day moving average will be an important technical development to monitor.
4. Treat the new-high/new-low data as a warning signal.
New 52-week lows substantially outnumbered new highs on both exchanges. Until this imbalance improves over several sessions, traders should be cautious about interpreting isolated index gains as evidence of a broad market recovery.
5. Prepare for earnings-driven volatility in financials.
Major bank earnings begin on Tuesday, bringing the potential for significant stock-specific moves and shifts in sector sentiment. Traders should monitor earnings surprises, forward guidance, and price action following announcements.
6. Keep geopolitical developments and oil prices on the radar.
Further escalation in the Middle East could push oil prices higher, potentially affecting inflation expectations, sector performance, and investor sentiment. Energy stocks may benefit from higher oil prices, while sustained increases could create headwinds for other parts of the market.
Bottom Line
Monday’s session delivered a mixed performance across the major U.S. indexes, but the underlying market statistics were less encouraging. The Dow demonstrated relative strength, while technology and small-cap stocks weakened. More importantly, declining issues outnumbered advancing issues on both the NYSE and Nasdaq, and new 52-week lows increased sharply.
Although the S&P 500 and Nasdaq remain above their key moving averages, deteriorating market internals suggest that investors should remain selective. The direction of semiconductor stocks, the Russell 2000’s technical position, the balance between new highs and new lows, and the market’s reaction to this week’s bank earnings will be important indicators to watch in the sessions ahead.
.
NOTICE TO READERS
The Canadian Vanguard Stock Market is about empowering you to build and manage your wealth by yourself. There is certainly no magic in managing finances or wealth but one needs to know what to do and commit to doing what is needed. When you are ready to start the journey to Take Charge and Put Your Destiny In Your Own Hands, start with reading The Canadian Vanguard every market day. If and when you need more related information or to advertise your business products or services in The Canadian Vanguard, Contact Us
Our readers are strongly advised to conduct their own research into individual stocks before making a purchase decision. In addition, investors are advised that past stock performance is no guarantee of future price appreciation. Any recommendation is not a guarantee of any particular stock’s future prices, and The Canadian Vanguard accepts no responsibility or liability for investors’ or readers’ purchases.
Stocks In The News/ Stocks To Watch and Market Strategy will soon be available only to Paying Subscribers. The dollar sign “$” in the Toronto Market section in the articles only stands for Canadian dollar and in the US market section “$” stands for US dollar.
(c) This article is published by The Canadian Vanguard on October 12, 2026