







Nasdaq Leads Friday’s Rebound as Small-Caps Advance, Despite Sharp Weekly Market Losses and Rising Bond Yields
The Canadian Vanguard Stock Market Report Friday, November 6, 2026, Edition
.
The Toronto Market
Friday’s Toronto Market Index
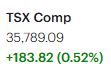
The S&P/TSX Composite Index gained 183.82 points, or 0.52%, to close at 35,789.09 on Friday.
The TSX recovered some of Thursday’s relatively sharp losses. The major news on Friday centered on the Canadian employment situation. According to Statistics Canada, the Canadian economy lost a net 4,700 jobs in October, while the unemployment rate rose for the second consecutive month, increasing by 0.2 percentage points to 6.7%.
The Bank of Canada’s focus has shifted toward the increased risks to the inflation outlook. However, in comments to lawmakers earlier this week, Governor Tiff Macklem reiterated that Canada’s economic growth outlook has improved despite ongoing U.S. trade actions. Following the latest unemployment figures, however, the prospect of further interest-rate increases appears less certain.
The TSX closed Friday below the psychologically important 36,000 level and remained comfortably below that threshold for the week. Market breadth was positive on Friday, suggesting that more stocks participated in the recovery.
Nevertheless, investors should remain cautious and continue taking appropriate steps to protect their capital. Until a sustainable market turnaround is established and confirmed, investors may wish to consider limiting their market exposure to approximately 15% to 30% of their portfolio value, depending on their individual risk tolerance and investment objectives. Capital preservation should remain a priority in the current market environment.
Technically, the TSX closed Friday slightly below both its 25-day and 50-day moving averages. However, the index continues to trade comfortably above its 200-day moving average, suggesting that its longer-term technical position remains relatively stronger than its short-term trend.
Friday’s TSX Market Statistics
At the TSX, advancing issues (advancers) significantly outnumbered declining issues (decliners) on Friday. Specifically, there were 1,505 advancing issues and 775 declining issues, producing an advancer-to-decliner ratio of 1.94:1, or approximately two advancers for every decliner. An additional 150 issues remained unchanged.
Overall, market breadth was positive on Friday. However, despite the positive advance-decline figures, the market’s internal indicators continued to show signs of weakness, suggesting that the underlying market condition remains fragile.
The exchange recorded 7 new 52-week highs and 12 new 52-week lows, compared with 11 new 52-week highs and 45 new 52-week lows on Thursday.
The ratio of new 52-week highs to new 52-week lows improved considerably from Thursday. On Friday, the ratio stood at 7:12, or approximately 0.58 (58%), compared with 11:45, or approximately 0.24 (24%), on Thursday. This improvement suggests a reduction in the number of stocks reaching new lows relative to those reaching new highs.
Nevertheless, the number of stocks establishing new 52-week highs and lows declined compared with the previous session. While this represents some improvement in the market’s new-high/new-low statistics, the broader market internals remain relatively weak and warrant continued monitoring.
Total trading volume on the TSX reached approximately 535,811,000 shares on Friday, representing a decline of about 25.4% from Thursday’s volume of 718,134,000 shares.
Market volatility remains a significant concern, and there are few indications that it will disappear anytime soon, particularly given the uncertainty surrounding the recent U.S. midterm elections.
Investors and traders should continue monitoring the market’s internal indicators closely. These indicators can provide valuable early clues about a potential market turnaround. However, identifying early signs of improvement is not the same as confirming a sustainable reversal. It is therefore prudent to wait for stronger technical confirmation before committing substantial additional capital to the market.
Friday’s Toronto Stock Market (TSX) Wrap-Up Report
A Positive Session for the TSX, but Caution Remains Warranted
The Toronto Stock Exchange (TSX) experienced a broadly positive trading session on Friday, recovering some of Thursday’s relatively sharp losses. The S&P/TSX Composite Index gained 183.82 points, or 0.52%, to close at 35,789.09. Despite Friday’s recovery, the index remained below the psychologically important 36,000 level and closed the week beneath that threshold.
Although market breadth was positive, with 1,505 advancing issues against 775 declining issues, the broader market internals continued to show signs of weakness. The advance-to-decline ratio stood at a healthy 1.94:1, indicating that advancing stocks outnumbered declining stocks by almost two to one.
The number of new 52-week lows also declined considerably. The exchange recorded 7 new highs and 12 new lows, compared with 11 new highs and 45 new lows on Thursday. This represented an improvement in the new-high-to-new-low ratio, which increased to 0.58 from 0.24 in the previous session.
Nevertheless, trading volume declined to approximately 535.8 million shares, down about 25.4% from Thursday’s 718.1 million shares. The combination of positive market breadth, improving new-high/new-low statistics, and declining trading volume suggests that Friday’s recovery was encouraging, but further confirmation is needed before concluding that a sustainable market turnaround is underway.
Sector Performance: Technology and Retail Lead the Advance
Technology Services was Friday’s strongest-performing sector, gaining an impressive 13.83%. Retail Trade followed with an 11.76% advance, while Communications rose 11.53%. Utilities and Health Technology also finished among the stronger-performing sectors.
The Financial sector posted a more modest gain of 2.63%. Distribution Services and Electronic Technology were among the session’s lagging sectors.
The strength in Technology Services, Retail Trade, and Communications suggests that buying interest was concentrated in selected growth-oriented areas of the market. However, traders should monitor whether these gains attract sustained buying interest in subsequent sessions or prove to be short-term rebounds following Thursday’s selloff.
Canadian Big Six Banks: Mixed Performance
The Canadian Big Six banks delivered a mixed performance on Friday. Four banks finished higher, while two ended the session in negative territory.
Bank of Nova Scotia was the strongest performer, gaining 0.75%. Canadian Imperial Bank of Commerce advanced 0.44%, National Bank of Canada gained 0.31%, and Toronto-Dominion Bank rose 0.21%.
In contrast, Royal Bank of Canada declined 0.59%, while Bank of Montreal slipped 0.12%.
The mixed performance suggests that buying interest across Canada’s major financial institutions was selective rather than broad-based. Investors should continue monitoring the banking sector, given its significant influence on the overall TSX and its importance to the Canadian economy.
Gold Mining Stocks: Continued Strength
The major gold-related stocks performed well on Friday. Wheaton Precious Metals (WPM) advanced 3.34%, Franco-Nevada Corporation (FNV) gained 2.39%, and Agnico Eagle Mines (AEM) rose 2.23%.
The positive performance of these established precious-metals companies is worth monitoring, particularly as investors continue to assess economic uncertainty, interest-rate expectations, and developments in the global financial markets.
Traders interested in the gold sector should watch whether these stocks can maintain their upward momentum and sustain trading above their important technical support levels.
Individual Stock Highlights
Shopify Inc. (SHOP)
Shopify Inc. (SHOP) was among Friday’s notable large-cap performers, advancing 4.59%. Approximately 2 million shares changed hands, roughly in line with the stock’s 50-day average daily trading volume.
The stock recovered almost all of the losses incurred during Thursday’s sharp selloff. This recovery is encouraging and suggests that buyers were willing to step in following the previous session’s weakness.
However, traders should not interpret a single strong recovery session as confirmation that the stock has resumed a sustainable upward trend. SHOP deserves continued attention, particularly to see whether it can maintain Friday’s gains and attract additional buying interest.
MDA Space Ltd. (MDA)
MDA Space Ltd. (MDA), a Canadian space technology company, was among Friday’s notable small- and mid-cap performers. The stock advanced 7.15%, closing at $40.16, with approximately 3.55 million shares traded.
The strong price advance and trading activity make MDA an interesting candidate for traders and investors seeking exposure to the space technology sector.
For longer-term investors, MDA may be worth adding to a watchlist for further research, particularly given the potential growth opportunities associated with the space technology industry. Nevertheless, investors should assess the company’s fundamentals, valuation, business prospects, and risk factors before making an investment decision.
From a trading perspective, the important consideration is whether Friday’s strong advance can be followed by sustained buying interest rather than a quick reversal.
Aritzia Inc. (ATZ)
Aritzia Inc. (ATZ) continues to demonstrate notable relative strength compared with many other stocks that experienced substantial declines during the September-to-early-October market weakness.
Although Aritzia declined 1.52% on Friday, closing at $155.00 on approximately 592,200 shares traded, its recent performance remains impressive. The stock has advanced in 16 of the past 19 trading sessions.
From a technical perspective, ATZ continues to trade comfortably above its 21-day, 50-day, and 200-day moving averages. This configuration reflects a strong underlying upward trend and makes the stock particularly interesting to momentum-oriented traders and investors.
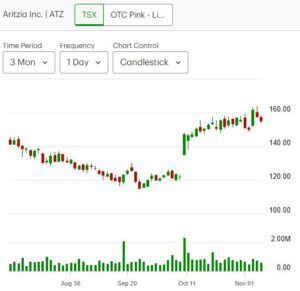
Friday’s modest decline does not necessarily undermine the stock’s broader technical strength. However, after such a sustained advance, investors should remain mindful of the possibility of short-term profit-taking or consolidation.
Traders may wish to monitor whether the stock finds support near its shorter-term moving averages before considering new positions. Longer-term investors should also evaluate whether its fundamental performance supports its current valuation.
Key Takeaways for Traders and Investors
Friday’s session provided some encouraging signs of recovery, but the broader technical picture remains mixed. The TSX is still trading below the psychologically important 36,000 level and slightly below its 25-day and 50-day moving averages, although it remains comfortably above its 200-day moving average.
The following are some important considerations for the coming trading sessions:
1. Do not mistake a one-day recovery for a confirmed market reversal.
Friday’s positive market breadth and improvement in new-high/new-low statistics are encouraging. However, traders should look for follow-through buying, improving market internals, and stronger participation before concluding that a sustainable recovery is underway.
2. Continue monitoring market breadth and trading volume.
The advance-to-decline ratio of 1.94:1 was positive, but overall trading volume declined considerably. A stronger recovery accompanied by improving volume and consistently positive market breadth would provide more convincing evidence of renewed buying interest.
3. Pay attention to sector rotation and individual stock strength.
Stocks such as SHOP, MDA, WPM, FNV, AEM, and ATZ deserve continued attention. However, their individual price movements and technical conditions should be assessed separately rather than assuming that strength in one stock represents a broader market recovery.
4. Maintain a disciplined approach to capital preservation.
Given the continuing uncertainty and market volatility, investors and traders should remain selective with new positions. Depending on individual risk tolerance and investment objectives, maintaining a relatively conservative market exposure, potentially in the range of 30% to 60% of portfolio value, may be worth considering until a more convincing market recovery is established.
5. Wait for technical confirmation before making major commitments.
The TSX needs to demonstrate sustained improvement, including a recovery above its shorter-term moving averages, stronger market internals, and continued buying participation. Until then, patience and disciplined risk management remain important.
Overall Market Outlook
Friday’s trading session was positive, but it was not yet sufficient to change the broader cautious assessment of the TSX.
The improvement in market breadth, the reduction in new 52-week lows, and the recovery in several important individual stocks are encouraging developments. However, the index remains below its 25-day and 50-day moving averages and has yet to reclaim the 36,000 level.
For now, traders and investors should remain watchful, selective, and disciplined. The priority should be protecting existing capital while monitoring the market’s internal indicators for early evidence of a sustained turnaround.
A confirmed improvement in the TSX’s technical position, supported by stronger market breadth and volume, would provide a more favourable environment for gradually increasing market exposure.
.
The US Markets
Friday’s U.S. Stock Market Indexes
Major U.S. Indexes Deliver a Mixed Performance
U.S. stock markets delivered a mixed performance on Friday, with three of the four major market indexes finishing higher. The Dow Jones Industrial Average was the exception, extending its weakness following Thursday’s sharp market selloff.
The Dow Jones Industrial Average declined 237.33 points, or 0.46%, to close at 51,285.73.
The S&P 500 gained 23.13 points, or 0.31%, finishing at 7,376.86. The Nasdaq Composite advanced 264.43 points, or 1.09%, to close at 24,579.43, making it the strongest performer among the major indexes. Meanwhile, the Russell 2000 gained 24.22 points, or 0.89%, to finish at 2,754.11.

Despite Friday’s recovery in three of the four major indexes, the broader market remains under considerable pressure. The S&P 500 recorded its largest weekly decline since the tariff-related market selloff in April 2025, underscoring the extent of the recent deterioration in market sentiment.
Although the Nasdaq posted a respectable gain, its upward momentum weakened somewhat toward the closing bell. Following Thursday’s substantial selloff and the significant losses accumulated during the week, some investors appeared reluctant to maintain aggressive buying positions heading into the weekend.
The mixed performance suggests that investors remain cautious and that Friday’s gains should not yet be interpreted as confirmation of a broader market recovery.
Technical Analysis of the Major U.S. Indexes
The technical condition of the four major indexes continues to raise concerns, particularly regarding the short- and intermediate-term market outlook.
Dow Jones Industrial Average: The Dow Jones had managed to recover above both its 21-day and 50-day moving averages on Thursday. However, Friday’s decline pushed the index back below both moving averages.
The index remains above its 200-day moving average, which is an important longer-term technical support indicator. Nevertheless, the inability to maintain its position above the shorter-term moving averages suggests that the recent recovery remains fragile.
Traders should monitor whether the Dow can regain these moving averages in the coming sessions. Failure to do so could expose the index to further downside pressure.
Nasdaq Composite: The Nasdaq’s technical position remains particularly concerning.
Despite Friday’s 1.09% advance, the index continues to trade clearly below its 21-day and 50-day moving averages. More importantly, it closed below its 200-day moving average on Friday.
A sustained move below the 200-day moving average would represent a significant deterioration in the Nasdaq’s longer-term technical condition. For traders and investors, this is an important warning signal that warrants increased caution, particularly when considering new positions in technology and growth-oriented stocks.
The index will need to recover above its key moving averages to provide stronger evidence that its technical condition is improving.
S&P 500: The S&P 500 managed a modest recovery on Friday, gaining 0.31%. However, the index remains considerably below its 25-day and 50-day moving averages.
More importantly, the index closed approximately at its 200-day moving average. This level deserves close attention because the 200-day moving average is widely followed by institutional investors and market participants as an important indicator of the longer-term market trend.
A sustained break below this level could further weaken market sentiment and increase selling pressure. Conversely, holding above it and subsequently recovering the shorter-term moving averages would be an encouraging technical development.
For now, the S&P 500 is at an important technical juncture.
Russell 2000: The Russell 2000 gained 0.89% on Friday, but its technical position remains weak.
The index continues to trade below its 25-day, 50-day, and 200-day moving averages. This indicates that weakness extends across its short-, intermediate-, and longer-term technical trends.
The inability of small-cap stocks to recover above these important moving averages is another reason for caution. Traders should monitor the Russell 2000 closely because sustained weakness in small-cap stocks can reflect concerns about economic growth, corporate earnings prospects, and investors’ willingness to take on additional market risk.
Key Takeaways for Traders and Investors
Friday’s recovery in three of the four major U.S. indexes was encouraging, but the overall technical picture remains weak. The market has yet to demonstrate convincing evidence that Thursday’s selloff marked the end of the recent downward movement.
Here are some important considerations for the coming trading sessions:
1. Do not assume Friday’s gains signal a market reversal.
The Nasdaq and Russell 2000 posted relatively strong gains, but both indexes remain in technically weak positions. Traders should look for sustained buying interest and improvements in the major indexes before increasing market exposure.
2. Watch the S&P 500’s 200-day moving average.
The S&P 500 closed near this important technical level. Its ability to hold above the 200-day moving average could be significant for the broader market outlook. A decisive breakdown would be a reason for additional caution.
3. Pay particular attention to the Nasdaq.
The Nasdaq’s close below its 200-day moving average is an important warning signal. Investors should be particularly selective when considering technology and growth stocks until the index demonstrates a meaningful technical recovery.
4. Monitor the Russell 2000 for signs of improving market participation.
Small-cap stocks remain technically weak. A recovery above their key moving averages would provide a more encouraging indication that investors are becoming more comfortable taking on market risk.
5. Prioritize capital preservation.
Given the recent market volatility and deterioration in the technical condition of the major indexes, traders and investors should remain disciplined. Avoid rushing into new positions simply because of a one-day market rebound. Position sizing, risk management, and capital preservation should remain priorities.
Overall U.S. Market Outlook
Friday’s trading session offered some relief following Thursday’s sharp selloff, but the broader U.S. market remains vulnerable.
The Dow Jones has fallen back below its 21-day and 50-day moving averages. The Nasdaq has closed below all three of its key moving-average reference levels, including the 200-day moving average. The S&P 500 is testing its 200-day moving average, while the Russell 2000 continues to trade below its major moving averages.
Taken together, these technical developments suggest that the U.S. stock market has not yet established a convincing recovery.
For now, traders and investors should maintain a cautious stance, monitor the major indexes and their internal market indicators, and wait for stronger technical confirmation before committing substantial additional capital.
The priority should remain capital preservation until the market demonstrates that a sustainable recovery is underway.
.
Friday’s U.S. Market Statistics
NYSE and NASDAQ Market Breadth, Internal Indicators and Trading Volume
1. New York Stock Exchange (NYSE)
Market Breadth: Positive, but Underlying Market Internals Remain Weak
On Friday, advancing issues on the New York Stock Exchange (NYSE) outnumbered declining issues. Specifically, there were 1,475 advancing stocks, 1,253 declining stocks, and 56 unchanged issues.
This produced an advance-to-decline ratio of approximately 1.16:1, meaning that there were roughly six advancing stocks for every five declining stocks. Overall, NYSE market breadth was positive during Friday’s trading session.
However, the positive advance-decline figures should not be interpreted as evidence that the underlying market condition has recovered. Other important market internals continued to show considerable weakness.
New 52-Week Highs and Lows
The NYSE recorded 23 new 52-week highs and 127 new 52-week lows on Friday, compared with 38 new highs and 128 new lows on Thursday.
Although the number of new 52-week lows declined slightly, the number of new highs also decreased considerably. The ratio of new 52-week highs to new 52-week lows deteriorated to 23:127, or approximately 0.18 (18%).
This compares unfavourably with Thursday’s ratio of 38:128, or approximately 0.30 (30%).
The declining new-high-to-new-low ratio indicates that relatively few stocks are establishing new highs compared with those reaching new lows. This is an important sign of underlying market weakness.
Trading Volume
Total NYSE trading volume reached approximately 5.74 billion shares on Friday, representing a decline of about 23.7% from Thursday’s volume of approximately 7.52 billion shares.
The lower trading volume suggests reduced overall trading activity compared with the previous session. Although Friday’s market breadth was positive, the decline in volume and continued weakness in the new-high/new-low statistics do not yet provide convincing evidence of a sustainable improvement in market conditions.
NYSE Market Internals: Caution Remains Necessary
The NYSE’s advance-decline figures offered some encouragement on Friday. However, the new-high/new-low ratio deteriorated, indicating that the underlying market internals remain weak.
Market internals have been under pressure for some time. Consequently, one or two positive trading sessions are unlikely to be sufficient to repair the damage already done to the broader market.
A sustained improvement will likely require several consecutive sessions of stronger market breadth, an improving new-high/new-low ratio, and greater participation among individual stocks.
For now, traders and investors should continue exercising considerable caution. Risk management should remain a priority, and traders should be prepared to reduce or close positions when the market moves against their expectations.
2. NASDAQ Stock Market
Market Breadth: Positive, but Underlying Market Internals Deteriorate Further
The NASDAQ also recorded positive market breadth on Friday, with advancing stocks significantly outnumbering declining stocks.
There were 2,903 advancing issues, 2,003 declining issues, and 165 unchanged issues. This produced an advance-to-decline ratio of approximately 1.45:1, or roughly three advancing stocks for every two declining stocks.
On the surface, these figures suggest that buying interest was relatively broad during Friday’s session.
However, the underlying market internals tell a considerably less encouraging story.
New 52-Week Highs and Lows: The NASDAQ recorded 63 new 52-week highs and 385 new 52-week lows on Friday, compared with 81 new highs and 311 new lows on Thursday.
This represents a further deterioration in the exchange’s new-high/new-low statistics.
The ratio of new 52-week highs to new 52-week lows declined to 63:385, or approximately 0.16 (16%), compared with approximately 0.26 (26%) on Thursday.
The number of stocks establishing new 52-week lows increased while the number of stocks reaching new highs declined.
More importantly, this represents the second consecutive session of deterioration in the NASDAQ’s new-high/new-low indicators.
The divergence between positive daily market breadth and deteriorating new-high/new-low statistics is particularly noteworthy. Although more stocks advanced than declined on Friday, a substantially larger number of stocks remained under pressure relative to those reaching new highs.
This suggests that the underlying condition of the NASDAQ remains considerably weaker than Friday’s index gain might imply.
Trading Volume: Total NASDAQ trading volume reached approximately 10.78 billion shares on Friday, compared with approximately 10.26 billion shares on Thursday.
This represents an increase of about 5.1%.
The NASDAQ’s 1.09% advance was therefore accompanied by higher trading volume, suggesting that the recovery attracted meaningful trading participation.
This is an encouraging development and provides some evidence of buying interest following Thursday’s severe selloff.
Nevertheless, higher volume accompanying an index advance does not automatically establish that a sustainable market recovery is underway. The deterioration in the new-high/new-low statistics indicates that the broader technical damage has not yet been repaired.
NASDAQ Market Internals: A Stronger Recovery Will Take Time
The NASDAQ’s underlying market condition remains a significant concern for traders and investors.
Thursday’s severe selloff inflicted considerable damage on the technical charts of many previously leading technology and growth stocks. Friday’s recovery was welcome, but the market will likely need several consecutive positive sessions to begin repairing that damage.
Investors should not expect the technical condition of the NASDAQ to return to normal after just one or two recovery sessions. Depending on market conditions, the repair process could take weeks or even months.
The immediate priority should be capital preservation rather than aggressive buying.
Based on our experience with market conditions of this nature, we believe retail investors should consider limiting their equity exposure to approximately 30% of their portfolio value at this stage, depending on their individual financial circumstances and risk tolerance.
This 30% guideline is not the result of a mathematical formula or scientific portfolio-allocation calculation. It is an experience-based risk-management recommendation intended to encourage caution during periods of significant market weakness.
An appropriate analogy would be advising a recently licensed driver not to accelerate into a sharp corner. The objective is not to avoid driving altogether, but to recognize the conditions, reduce the risk, and maintain sufficient control to respond if circumstances change.
For traders, this means avoiding aggressive position sizes, maintaining appropriate stop-loss discipline, and being prepared to exit positions when the market’s technical condition deteriorates further.
The NASDAQ needs time to repair its technical condition. Stronger market internals and confirmation of a new upward trend will be necessary before a more aggressive investment approach can be justified.
🔒 Premium Content
You must be a subscriber to access the remaining parts of this section. Current subscription rate is $60 CAD for a year
Login or Subscribe
.
Overall U.S. Market Outlook
Friday’s trading session provided some relief following Thursday’s severe market selloff. The Nasdaq and Russell 2000 led the recovery, and increased NASDAQ trading volume offered some encouragement.
However, the underlying market statistics remain concerning. Both exchanges continue to show weak new-high/new-low ratios, while the major indexes remain in technically vulnerable positions.
The Nasdaq’s close below its 200-day moving average is particularly noteworthy. The S&P 500 is also testing this important technical reference level, while the Russell 2000 remains below all three of its major moving averages.
Furthermore, the substantial weekly declines in SanDisk, Micron, and other technology-related stocks demonstrate that considerable technical damage has already occurred beneath the surface of the market.
The recovery process may take weeks or even months, depending on economic developments, interest-rate expectations, corporate earnings, and the willingness of investors to return to riskier assets.
For now, our assessment remains cautious.
Traders and investors should avoid aggressive buying, remain selective when considering new positions, and continue monitoring market internals for evidence of sustained improvement.
Capital preservation should remain the primary objective until the U.S. stock market demonstrates a convincing and technically confirmed recovery.
.
NOTICE TO READERS
The Canadian Vanguard Stock Market is about empowering you to build and manage your wealth by yourself. There is certainly no magic in managing finances or wealth but one needs to know what to do and commit to doing what is needed. When you are ready to start the journey to Take Charge and Put Your Destiny In Your Own Hands, start with reading The Canadian Vanguard every market day. If and when you need more related information or to advertise your business products or services in The Canadian Vanguard, Contact Us
Our readers are strongly advised to conduct their own research into individual stocks before making a purchase decision. In addition, investors are advised that past stock performance is no guarantee of future price appreciation. Any recommendation is not a guarantee of any particular stock’s future prices, and The Canadian Vanguard accepts no responsibility or liability for investors’ or readers’ purchases.
The dollar sign “$” in the Toronto Market section in the articles only stands for Canadian dollar and in the US market section “$” stands for US dollar.
(c) This article is published by The Canadian Vanguard on November 6, 2026