







Dow Jones Defies Market Weakness as S&P 500 and Nasdaq Retreat Amid Falling Oil Prices and Treasury Yields
The Canadian Vanguard Stock Market Report Monday, November 2, 2026, Edition
.
The Toronto Market
Monday’s Toronto Market Index
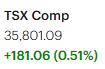
The S&P/TSX Composite Index advanced 181.06 points, or 0.51%, to close at 35,801.09 on Monday.
The TSX attempted to recover from Friday’s sharp decline but managed to recoup only about one-third of the previous session’s losses. The index opened sharply higher in the morning; however, momentum faded in the afternoon, and selling pressure pushed stocks lower.
Despite Monday’s gains, the index remained below the psychologically important 36,000 level, which it had fallen below on Friday. Technology stocks also came under pressure in the late afternoon, adding to concerns about the market’s near-term direction.
Given the current market volatility and uncertain direction, traders and investors should remain cautious and prioritize capital preservation. Consider reducing market exposure to approximately 50%–70% of portfolio value, depending on individual risk tolerance, investment objectives, and financial circumstances. Maintaining adequate cash reserves and limiting unnecessary market exposure may help protect capital until market conditions become more stable and volatility subsides.
From a technical perspective, the TSX closed Friday below both its 25-day and 50-day moving averages. However, the index continues to trade comfortably above its 200-day moving average, suggesting that its longer-term technical outlook has not yet deteriorated to the same extent as its short-term trend.
Monday’s TSX Market Statistics
At the TSX, advancing issues (advancers) outnumbered declining issues (decliners). Specifically, there were 1,389 advancing issues compared with 922 declining issues, producing an advancer-to-decliner ratio of approximately 1.50:1. In other words, there were roughly three advancing stocks for every two declining stocks. An additional 114 issues closed unchanged.
Overall, Monday’s market breadth was positive and showed a slight improvement. However, despite the positive breadth, the market’s internal indicators remain relatively weak, reflecting the underlying fragility of the market.
The exchange recorded 12 new 52-week highs and 49 new 52-week lows, compared with 75 new 52-week highs and 72 new 52-week lows in the previous session.
The number of new 52-week highs declined by approximately 84%, while new 52-week lows decreased by about 32% compared with the previous session. Although both figures declined, the reduction in new lows is a positive development. Nevertheless, new 52-week lows continued to outnumber new highs by a substantial margin. The ratio of new 52-week highs to new 52-week lows was approximately 1:4.08, indicating that the market’s longer-term internal strength remains weak.
Consequently, although there was some improvement in market internals on Monday, the overall picture remains concerning. A sustained improvement in market conditions will require the number of new 52-week highs to consistently exceed the number of new 52-week lows.
Total trading volume on the TSX reached 475,906,000 shares, approximately 16% below Friday’s volume of 566,426,000 shares.
Market volatility remains a significant concern and is unlikely to disappear in the immediate future. Investors should continue monitoring market internals closely to identify any emerging trends or potential changes in market direction as early as possible.
In particular, a reversal of the current negative trend in the 52-week highs-to-lows ratio would be an important signal of improving market conditions. Until new 52-week highs consistently outnumber new 52-week lows, investors should remain cautious and continue prioritizing capital preservation.
.
Monday’s Toronto TSX Market Wrap-Up Report
Market Performance and Sector Highlights
The Toronto Stock Exchange (TSX) finished Monday’s session higher, with the S&P/TSX Composite Index advancing 181.06 points, or 0.51%, to close at 35,801.09. However, despite the positive closing performance, the market struggled to maintain its early morning momentum. The index opened sharply higher but encountered selling pressure during the afternoon, leaving it below the psychologically important 36,000 level.
Sector performance was mixed, with considerable differences between the strongest and weakest groups.
Technology Services was the best-performing sector, surging 14.57%, followed by Retail Trade, which gained 10.66%. Utilities advanced 6.14%, while Energy Minerals rose 4.01%. Financials gained 3.26%, and Transportation added 2.02%.
On the downside, Distribution Services was the weakest-performing sector, declining 10.42%. Health Services fell 3.97%, Consumer Durables slipped 0.31%, while Electronic Technology plunged 22.88%, making it the worst-performing sector among those reported.
The financial sector provided some support to the broader market, with all six of Canada’s major banks advancing for the third consecutive session.
Meanwhile, most oil stocks declined as oil prices weakened. The energy sector’s positive performance therefore masked some underlying weakness among individual oil-related stocks.
Market Breadth and Internal Indicators
Although the TSX finished higher, market breadth provided a more encouraging picture of Monday’s trading session.
Advancing issues outnumbered declining issues, with 1,389 advancers against 922 decliners and 114 unchanged issues. This produced an advancer-to-decliner ratio of approximately 1.50:1, indicating that advancing stocks outnumbered declining stocks by a healthy margin.
However, the broader market’s internal indicators remain relatively weak.
The exchange recorded only 12 new 52-week highs compared with 49 new 52-week lows. Although the number of new lows declined from 72 in the previous session, new lows continued to substantially outnumber new highs.
This is an important distinction. While Monday’s positive market breadth suggests that more stocks participated in the advance, the continued dominance of new 52-week lows indicates that the underlying market remains vulnerable.
Trading volume also declined. Total TSX volume reached approximately 475.9 million shares, down 16% from Friday’s 566.4 million shares.
Taken together, Monday’s statistics suggest some improvement in short-term market participation, but not yet a convincing recovery in the market’s underlying technical strength.
Individual Stock Highlights and Company News
Shopify Inc. (SHOP)
Shopify shares declined and closed at $217.64, with approximately 1.2 million shares traded. Despite the decline, the stock has attracted positive analyst attention. Citigroup raised its price target on Shopify from $196 to $216. Investors should note that analyst price targets are estimates rather than guarantees of future share-price performance.
Agnico Eagle Mines Limited (AEM)
Agnico Eagle Mines advanced 0.92% to close at $238.41, with approximately 711,000 shares traded. The stock remained relatively firm during Monday’s session.
Precision Drilling Corporation (PD)
Precision Drilling declined to close at $136.76, with approximately 214,800 shares changing hands. Traders should continue monitoring the stock’s price action and trading volume for signs of stabilization or further weakness.
5N Plus Inc. (TSX: VNP)
5N Plus is a smaller-cap stock worth keeping on the watchlist for further research. The shares declined 0.32% on Monday to close at $26.10, with approximately 366,800 shares traded.
Although the stock experienced a modest decline, investors interested in smaller-cap opportunities may wish to monitor its subsequent price action, trading volume, and technical indicators before considering an entry.
.
Key Takeaways for Traders and Investors
Monday’s trading session delivered a positive headline result, but investors should be careful not to interpret the TSX’s 0.51% advance as confirmation that the market has resumed a sustainable upward trend.
Several considerations deserve attention:
- The 36,000 level remains important. The TSX continues to trade below this psychologically significant level. A sustained move back above it would be an encouraging development, but traders should look for confirmation rather than rely on a single-session advance.
- Market breadth improved, but internal strength remains weak. Advancers outnumbered decliners by approximately 1.50:1. However, the fact that new 52-week lows (49) continued to substantially exceed new highs (12) remains a warning sign.
- Watch the new 52-week highs-to-lows ratio. A sustained reversal, with new highs consistently exceeding new lows, would provide stronger evidence that the market’s underlying technical condition is improving.
- Be selective with individual stocks. Monday’s significant differences in sector performance highlight the importance of stock selection. Traders should pay attention to relative strength, price momentum, and trading volume rather than assuming that a rising index means all sectors and stocks are participating.
- Maintain a defensive portfolio posture. Given the elevated volatility, weakening short-term technical indicators, and uncertain market direction, capital preservation should remain a priority. Investors may consider limiting equity exposure to approximately 50%–70% of portfolio value, depending on their individual risk tolerance and investment objectives.
- Monitor the major moving averages. The TSX closed Friday below its 25-day and 50-day moving averages but remained comfortably above its 200-day moving average. This suggests that short-term technical momentum has weakened, although the longer-term trend has not yet suffered the same degree of deterioration.
Overall Market Outlook
Monday’s TSX performance was encouraging on the surface, but the broader technical picture remains mixed.
The index recovered 181.06 points following Friday’s sharp decline, but the recovery represented only approximately one-third of Friday’s losses. Furthermore, the inability to maintain its early morning gains and reclaim the 36,000 level suggests that selling pressure remains present.
While market breadth improved and several major sectors advanced, the continued imbalance between new 52-week highs and lows indicates that the market’s underlying strength has yet to recover convincingly.
For now, traders and investors should remain cautious, avoid excessive market exposure, and closely monitor market internals for evidence of a sustained improvement.
The priority remains capital preservation rather than aggressive portfolio expansion. A more constructive investment posture would be justified when the TSX demonstrates stronger price momentum, improved participation across sectors, and a sustained reversal in the relationship between new 52-week highs and new 52-week lows.
.
The US Markets
Monday’s US Market Indexes
Major Index Performance
The major US stock market indexes finished Monday’s trading session mixed, with the Dow Jones Industrial Average advancing while the S&P 500, Nasdaq Composite, and Russell 2000 declined.
The Dow Jones Industrial Average was the best-performing major index, gaining 213.67 points, or 0.41%, to close at 51,983.98.
In contrast, the S&P 500 declined 38.67 points, or 0.51%, to finish at 7,541.40. The Nasdaq Composite suffered a more substantial loss, falling 272.64 points, or 1.07%, to close at 25,164.36. The Russell 2000 also slipped, losing 5.97 points, or 0.21%, to finish at 2,805.88.

Market Analysis and Trading Activity
Monday’s trading session was particularly concerning, despite the Dow Jones managing to finish in positive territory.
All four major indexes opened higher and initially advanced during the first half-hour of trading. However, the early optimism quickly faded, and selling pressure gradually took control for the remainder of the session. By the closing bell, three of the four major indexes had moved into negative territory.
This intraday reversal is worth watching. The inability of the broader market to sustain its early gains suggests that sellers remain active and that investors are reluctant to commit aggressively to equities at current levels.
The Dow Jones demonstrated relative strength, supported by better performance among large-cap stocks. However, the weakness in the S&P 500 and, particularly, the Nasdaq Composite indicates that market leadership remains narrow and that technology and growth-oriented stocks continue to face considerable selling pressure.
The Nasdaq’s 1.07% decline was particularly disappointing. Its continued weakness raises concerns about the sustainability of the broader market recovery and suggests that investors should remain selective when considering technology and growth stocks.
Overall, Monday’s session was disappointing from an investment perspective. Elevated volatility, weakening market momentum, and the inability of the indexes to hold their early advances do not provide a particularly favourable environment for aggressive equity investing.
Technical Analysis: Major Indexes and Moving Averages
The technical picture across the four major US indexes remains mixed but generally concerning.
Dow Jones Industrial Average: The Dow Jones is now trading slightly below both its 25-day and 50-day moving averages. However, it continues to trade above its 200-day moving average.
This suggests that the index’s short-term momentum has weakened, although its longer-term technical trend remains relatively intact. The Dow’s ability to recover and move back above its shorter-term moving averages will be important to watch.
Nasdaq Composite: The Nasdaq Composite is trading clearly below both its 25-day and 50-day moving averages, indicating continued weakness in its short- and intermediate-term technical trends.
Although the index remains comfortably above its 200-day moving average, this is not sufficient to dismiss the current deterioration in market momentum. Continued weakness in the Nasdaq is particularly concerning because technology and growth stocks have historically played an important role in driving broader market advances.
S&P 500: The S&P 500 continues to trade below both its 25-day and 50-day moving averages while remaining comfortably above its 200-day moving average.
This configuration indicates that short- and intermediate-term momentum remain weak, even though the longer-term technical trend has not yet experienced a comparable breakdown.
The index needs to regain its shorter-term moving averages to provide investors with greater confidence that selling pressure is subsiding.
Russell 2000: The Russell 2000 remains the weakest technically among the four major indexes. It is trading below its 25-day, 50-day, and 200-day moving averages.
This is an especially concerning development because it indicates weakness not only in the short- and intermediate-term trends but also in the longer-term technical picture of smaller-cap stocks.
The inability of small-cap stocks to participate meaningfully in a market recovery is another indication that investor confidence remains fragile.
Overall US Market Outlook
Monday’s trading session provided little encouragement for investors hoping for a sustained recovery in US equities.
Although the Dow Jones advanced, the S&P 500 and Nasdaq Composite declined, while the Russell 2000 remained under pressure. More importantly, all four indexes opened higher but failed to maintain their early gains, suggesting that selling pressure continues to influence market direction.
The technical picture also warrants caution. Three of the four indexes remain below their 25-day and 50-day moving averages, while the Russell 2000 is below all three major moving averages.
The fact that the Dow Jones, S&P 500, and Nasdaq remain above their respective 200-day moving averages provides some longer-term technical support. Nevertheless, investors should not overlook the deterioration in short- and intermediate-term momentum.
For the time being, volatility and uncertainty remain dominant features of the US equity market. Traders and investors should avoid becoming overly aggressive, focus on capital preservation, and wait for stronger technical evidence before substantially increasing equity exposure.
The key issue is no longer simply whether the major indexes can produce another positive trading session. It is whether they can sustain their advances, regain their shorter-term moving averages, and demonstrate broader market participation. Until those conditions improve, a defensive investment posture remains warranted.
.
Monday’s US Market Statistics
1. New York Stock Exchange (NYSE)
Market Breadth
At the New York Stock Exchange (NYSE), advancing issues significantly outnumbered declining issues during Monday’s trading session. There were 1,727 advancing stocks compared with 989 declining stocks, while 82 issues closed unchanged.
This produced an advancer-to-decliner ratio of approximately 1.75:1, meaning that there were roughly seven advancing stocks for every four declining stocks.
Overall, NYSE market breadth was positive, indicating that a relatively broad group of stocks participated in the session’s advance. This was an encouraging development, particularly given the volatility affecting the broader US equity market.
New 52-Week Highs and Lows
The NYSE recorded 81 new 52-week highs and 96 new 52-week lows, compared with 47 new highs and 140 new lows in the previous session.
There was a notable improvement in these statistics:
- New 52-week highs increased by approximately 72% compared with the previous session.
- New 52-week lows decreased by approximately 31%.
The ratio of new 52-week highs to new 52-week lows improved to approximately 0.84, compared with 0.34 in the previous session.
This represents the strongest reading of the new-highs-to-new-lows ratio in several months, based on the figures being monitored.
This improvement is encouraging and suggests that the underlying market internals at the NYSE experienced a meaningful recovery on Monday. However, new 52-week lows continued to outnumber new highs, indicating that the market’s internal condition remains relatively weak.
We should therefore avoid interpreting a single session of improvement as confirmation that a sustainable positive trend has been established.
For the market’s internal indicators to become genuinely stronger, we need to see a consistent pattern in which new 52-week highs outnumber new 52-week lows over several consecutive trading sessions.
Trading Volume
Total NYSE trading volume reached approximately 5.81 billion shares, about 4% higher than the previous session’s volume of 5.58 billion shares.
The combination of positive market breadth, increased trading volume, a substantial increase in new 52-week highs, and a decline in new 52-week lows provides some encouraging evidence of improving market conditions.
Nevertheless, the overall market internals remain weak because new 52-week lows still exceed new highs.
NYSE Market Assessment
Monday’s NYSE statistics showed a meaningful improvement in market internals. The advancer-to-decliner ratio was positive, new 52-week highs increased considerably, and new 52-week lows declined.
However, this improvement needs to be sustained before we can conclude that the market’s internal strength has recovered sufficiently to support a more reliable upward trend.
For now, traders and investors should continue exercising considerable caution. Risk management, capital preservation, and close monitoring of market internals should remain priorities.
Traders should also be prepared to reduce or exit positions when their trading signals indicate that the market is moving against them. Until market internals demonstrate sustained improvement, aggressive positioning remains difficult to justify.
2. NASDAQ Market Statistics
Market Breadth
Unlike the NYSE, NASDAQ experienced negative market breadth on Monday, with declining issues outnumbering advancing issues.
There were 2,628 declining stocks compared with 2,336 advancing stocks, while 166 issues closed unchanged.
This produced a decliner-to-advancer ratio of approximately 1.13:1, meaning that there were roughly nine declining stocks for every eight advancing stocks.
The negative breadth indicates that selling pressure remained relatively widespread across NASDAQ-listed stocks.
This is consistent with the weakness in the Nasdaq Composite Index, which declined 1.07% during Monday’s trading session.
New 52-Week Highs and Lows
NASDAQ recorded 148 new 52-week highs and 421 new 52-week lows, compared with 107 new highs and 244 new lows in the previous session.
The changes were as follows:
- New 52-week highs increased by approximately 38%.
- New 52-week lows increased by approximately 72%.
Although the increase in new 52-week highs was encouraging, the much larger increase in new 52-week lows was a significant concern.
The ratio of new 52-week highs to new 52-week lows deteriorated to approximately 0.35, or 35%, compared with approximately 0.44, or 44%, in the previous session.
This means that for every 100 stocks reaching new 52-week lows, only about 35 stocks reached new 52-week highs.
Consequently, despite the increase in new highs, the overall balance between new highs and new lows actually deteriorated.
This is an important indication that NASDAQ’s underlying market internals remain weak.
The relatively high number of new 52-week lows suggests that considerable weakness continues to exist beneath the surface, particularly among individual technology and growth-oriented stocks.
Trading Volume
NASDAQ trading volume reached approximately 9.53 billion shares, compared with approximately 8.28 billion shares in the previous session, representing an increase of about 15%.
The combination of a declining Nasdaq Composite Index, negative market breadth, a substantial increase in new 52-week lows, and higher trading volume is concerning.
Higher trading volume during a declining market can indicate increased selling pressure and distribution. Although volume alone cannot establish the cause of the decline, the accompanying weakness in market breadth and new-high/new-low statistics reinforces the negative interpretation of Monday’s session.
NASDAQ Market Assessment
NASDAQ’s market internals remain weak, and Monday’s statistics did not provide convincing evidence of a meaningful recovery.
Although the number of new 52-week highs increased, the much larger increase in new 52-week lows resulted in a deterioration in the highs-to-lows ratio.
Furthermore, declining stocks outnumbered advancing stocks, and trading volume increased while the Nasdaq Composite declined.
These developments suggest that NASDAQ continues to struggle and that investors should remain particularly selective when considering technology and growth-oriented stocks.
There are some positive developments worth monitoring, but the market needs several consecutive sessions of improved breadth, declining numbers of new 52-week lows, and increasing numbers of new 52-week highs before we can conclude that its internal strength is recovering.
We should continue watching NASDAQ closely to determine whether the current weakness is beginning to stabilize or whether further deterioration is likely.
3. Overall US Market Internals: Key Takeaways for Traders and Investors
Monday’s market statistics revealed a significant difference between the internal conditions of the NYSE and NASDAQ.
The NYSE demonstrated meaningful improvement in market breadth and its new-high/new-low statistics. NASDAQ, however, continued to exhibit considerable weakness, with negative breadth and a deterioration in its new-high/new-low ratio.
The following observations deserve particular attention:
1. NYSE market internals are showing signs of improvement.
The substantial increase in new 52-week highs and decline in new 52-week lows are encouraging. However, new lows still outnumber new highs, and further improvement is necessary before the market can be considered technically healthy.
2. NASDAQ remains considerably weaker.
The increase in new 52-week lows, negative market breadth, and higher trading volume during a declining session suggest that selling pressure remains significant.
3. Watch the new 52-week highs-to-lows ratios.
These ratios are important indicators of the underlying strength or weakness of the market. A sustained improvement, particularly when new highs consistently exceed new lows, would provide stronger evidence of a healthier market environment.
4. Do not confuse a positive index performance with improving market internals.
An index can advance even when a substantial number of individual stocks are deteriorating. Monitoring market breadth and new 52-week highs and lows can help investors identify weaknesses that may not be immediately apparent from the headline index numbers.
5. Capital preservation should remain a priority.
Given the prevailing volatility and the continuing weakness in market internals, traders and investors should avoid excessive market exposure. Positions should be monitored closely, stop-loss strategies should be considered where appropriate, and investors should remain prepared to reduce exposure if market conditions deteriorate.
Overall Market Conclusion
Monday’s US market statistics presented a mixed picture.
The NYSE experienced a meaningful improvement in its internal indicators, offering some encouragement that underlying market conditions may be stabilizing. However, NASDAQ continued to struggle, with negative market breadth, more new 52-week lows, and increased trading volume accompanying its decline.
The divergence between the two exchanges is important. While some areas of the market are showing signs of recovery, others remain under considerable selling pressure.
For now, the overall market environment continues to call for caution. Traders and investors should resist the temptation to interpret isolated improvements as confirmation of a sustainable market recovery.
We need to see several consecutive sessions of stronger market breadth, fewer new 52-week lows, and a consistent improvement in the new-high/new-low ratios before becoming more confident about the market’s ability to sustain an upward trend.
Until then, protecting capital, managing risk, and remaining selective with new investments should take precedence over aggressive buying.
Monday’s US Market Wrap-Up Report
1. Overall Market Performance and Sector Highlights
Monday’s US stock market session was mixed and generally disappointing, despite some pockets of strength among individual stocks and sectors.
The Dow Jones Industrial Average advanced 213.67 points, or 0.41%, while the S&P 500 declined 0.51% and the Nasdaq Composite fell 1.07%. The Russell 2000 also finished lower, slipping 0.21%.
Although the major indexes opened higher and initially advanced during the first half-hour of trading, the early optimism quickly faded. Selling pressure gradually took control, and three of the four major indexes finished the session in negative territory.
The Dow Jones demonstrated relative strength, reflecting better performance among large-cap stocks. However, the weakness in the Nasdaq and S&P 500 indicates that the broader market continues to struggle.
Sector performance was mixed, with some notable gains in selected industries.
Technology Services was among the strongest-performing sectors, advancing 14.57%, followed by Retail Trade, which gained 10.66%. Industrial Services rose 7.39%, while Health Technology advanced 4.46%. Consumer Non-Durables gained 4.11%, Energy Minerals increased 4.01%, and Finance advanced 3.26%.
On the downside, Distribution Services was particularly weak, declining 10.42%. Consumer Services slipped approximately 0.48%, Consumer Durables declined, and Utilities and Transportation also experienced losses.
The wide differences in sector performance highlight the importance of selective stock picking in the current market environment. A rising sector or individual stock does not necessarily indicate that the broader market is improving.
2. Economic and Financial Market Developments
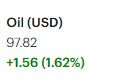
US crude oil futures declined sharply, falling almost 8% to approximately $96 per barrel. The significant decline in oil prices could provide some relief from energy-related inflationary pressures, although its broader implications will depend on the sustainability of the decline.
Meanwhile, the yield on the US 10-year Treasury note reached an intraday low of 4.87% before settling at approximately 4.91%.
Bond yields remain an important consideration for equity investors, particularly those investing in growth-oriented and technology stocks. Changes in Treasury yields can influence equity valuations, borrowing costs, and investor appetite for risk.
Given the current volatility in both equity and fixed-income markets, investors should continue monitoring developments in Treasury yields, oil prices, and inflation expectations.
3. Company News and Individual Stock Highlights
Marvell Technology (MRVL) and Lumentum Holdings (LITE)
Marvell Technology announced a planned acquisition of Lumentum Holdings, a manufacturer of optical and photonic networking components, in a transaction reportedly valued at $115 billion.
The announcement was poorly received by investors. Lumentum shares plunged 18.6%, while Marvell shares declined 12.7%.
The market reaction suggests that investors have concerns about the proposed transaction, its valuation, financing requirements, and potential implications for Marvell’s financial position.
The optical networking industry is attracting considerable attention because of its importance to artificial intelligence infrastructure and high-speed data-center connectivity. However, investors should not assume that every acquisition involving AI-related infrastructure will automatically create shareholder value.
Traders should monitor both companies for further developments, particularly management commentary, transaction financing, and the anticipated financial benefits of the proposed acquisition.
Palantir Technologies (PLTR)
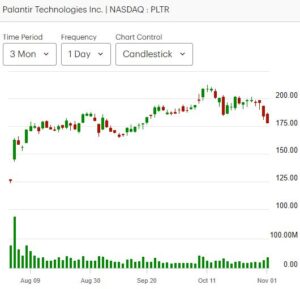
Palantir Technologies attracted considerable attention following its third-quarter earnings announcement.
The company reported adjusted earnings per share of $0.44, representing a 95% increase compared with the corresponding year-earlier period. Revenue increased 96% to approximately $2.313 billion.
The results highlighted the company’s continued strong business momentum, supported by demand for its artificial intelligence and data-analysis platforms.
One particularly important development was the continued expansion of Palantir’s commercial business.
US commercial revenue increased 148%, while public-sector revenue advanced 96%. The commercial business has therefore become an increasingly important growth driver for the company, helping Palantir diversify beyond its traditional reliance on government and public-sector contracts.
Palantir’s shares initially jumped following the earnings announcement but subsequently surrendered some of their gains.
The company’s strong reported growth is encouraging, but investors should also pay attention to valuation, future revenue guidance, and the sustainability of its exceptionally high growth rates.
For traders, the stock’s reaction following the earnings announcement will be particularly important. Strong financial results do not always translate into sustained share-price appreciation, especially when investor expectations are already elevated.
Other Notable Stock Performers
Despite the broader market weakness, several individual stocks demonstrated relative strength.
SharkNinja (SN)
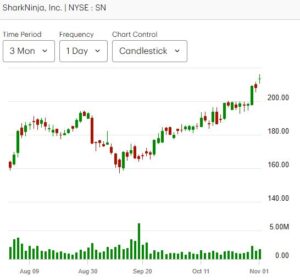
SharkNinja advanced to a record share price, demonstrating considerable relative strength during Monday’s session. The company’s performance is worth monitoring, particularly for traders looking for stocks capable of advancing independently of the broader market.
Mastercard (MA)
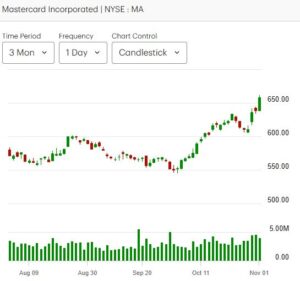
Mastercard gained approximately 3% during Monday’s session.
The stock is attracting attention as an alternative to some of the more heavily traded artificial intelligence and technology stocks. Its established payments business and potential for continued earnings growth make it an interesting company for investors seeking exposure outside the technology sector.
The reported institutional interest in Mastercard shares is also worth monitoring. However, institutional buying should be evaluated alongside price action, trading volume, and the company’s financial performance.
Hasbro (HAS)
Hasbro was another notable performer. Its shares have advanced during eight of the last ten trading sessions, suggesting improving short-term momentum.
Traders may wish to monitor whether this positive price action continues and whether the stock can maintain its relative strength in a volatile market.
Marriott International (MAR)
Marriott International is another company worth watching.
The company has attracted attention as its earnings growth accelerates, potentially making the stock an interesting alternative for investors seeking opportunities outside the crowded AI trade.
For traders, the important consideration is whether improving earnings momentum is being reflected in sustained share-price strength and increasing institutional interest.
4. Market Breadth and Internal Indicators: An Important Warning
Although Monday’s market statistics showed some encouraging developments on the NYSE, NASDAQ continued to demonstrate considerable underlying weakness.
At the New York Stock Exchange, advancing stocks outnumbered declining stocks by approximately 1.75 to 1. There were 1,727 advancers compared with 989 decliners.
Furthermore, the number of new 52-week highs increased from 47 to 81, while new 52-week lows declined from 140 to 96.
This represented a meaningful improvement in NYSE market internals. The ratio of new highs to new lows improved to approximately 0.84, its strongest reading in several months according to the figures being monitored.
However, new 52-week lows continued to outnumber new highs. Consequently, the improvement should be viewed as encouraging but not yet sufficient to confirm a sustainable recovery.
NASDAQ presented a considerably weaker picture.
Declining stocks outnumbered advancing stocks, with 2,628 decliners against 2,336 advancers. The exchange also recorded 421 new 52-week lows compared with only 148 new highs.
More concerning was the fact that new 52-week lows increased approximately 72% compared with the previous session.
NASDAQ trading volume also increased approximately 15%, even as the Nasdaq Composite declined 1.07%.
The combination of negative market breadth, a substantial increase in new 52-week lows, and higher trading volume during a declining session suggests that selling pressure remains significant.
This divergence between the NYSE and NASDAQ is important. While some areas of the market are demonstrating signs of improvement, technology and growth-oriented stocks continue to face considerable pressure.
5. Key Takeaways for Traders and Investors
Monday’s trading session offers several important lessons for traders and investors.
1. Do not mistake a positive Dow Jones performance for a healthy overall market.
The Dow advanced, but the S&P 500 and Nasdaq declined. The inability of the major indexes to sustain their early morning gains suggests that selling pressure remains significant.
2. Be particularly cautious with technology and AI-related stocks.
The Nasdaq’s 1.07% decline, together with the deterioration in its market internals, suggests that technology and growth stocks remain vulnerable.
Although companies such as Palantir continue to report impressive growth, investors should be careful about paying excessive valuations in an uncertain market.
3. Monitor the NYSE and NASDAQ market internals separately.
The NYSE demonstrated meaningful improvement, but NASDAQ’s internal indicators deteriorated.
A sustained recovery in both exchanges would provide considerably stronger evidence of improving market conditions.
4. Earnings season offers opportunities, but stock selection is critical.
Investors should closely monitor earnings reports, revenue growth, forward guidance, profit margins, and management commentary.
Companies reporting impressive financial results may still experience share-price declines if their results fall short of market expectations or if their valuations are excessive.
5. Consider opportunities outside the crowded AI trade.
Companies such as Mastercard and Marriott may provide interesting alternatives for investors seeking diversification beyond technology stocks. However, their financial fundamentals, valuations, and technical performance should be evaluated before making investment decisions.
6. Prioritize capital preservation.
Given the prevailing volatility, weakening market momentum, and fragile market internals, traders and investors should avoid excessive market exposure.
Maintaining a defensive portfolio posture, managing position sizes, and being prepared to reduce exposure when market conditions deteriorate should remain priorities.
6. Overall US Market Outlook
Monday’s US stock market performance was disappointing, despite some encouraging developments among individual stocks and selected sectors.
The Dow Jones managed to advance, but the S&P 500 and Nasdaq Composite declined. More importantly, all four major indexes opened higher but failed to maintain their early gains.
The technical picture remains concerning. The Dow, S&P 500, and Nasdaq are trading below their respective 25-day and 50-day moving averages, while the Russell 2000 remains below its 25-day, 50-day, and 200-day moving averages.
The fact that the Dow, S&P 500, and Nasdaq remain above their respective 200-day moving averages provides some longer-term technical support. Nevertheless, the weakening short- and intermediate-term trends should not be overlooked.
Market internals also remain mixed. The NYSE showed some meaningful improvement, but NASDAQ’s statistics suggest that underlying selling pressure remains substantial.
For the time being, traders and investors should remain cautious, selective, and disciplined.
The priority should be capital preservation rather than aggressive portfolio expansion. A more favourable investment environment will require sustained improvement in the major market indexes, stronger market breadth, and a consistent reversal in the relationship between new 52-week highs and new 52-week lows.
Until those conditions develop, investors should be prepared for continued volatility and the possibility of further market weakness.
.
.
NOTICE TO READERS
The Canadian Vanguard Stock Market is about empowering you to build and manage your wealth by yourself. There is certainly no magic in managing finances or wealth but one needs to know what to do and commit to doing what is needed. When you are ready to start the journey to Take Charge and Put Your Destiny In Your Own Hands, start with reading The Canadian Vanguard every market day. If and when you need more related information or to advertise your business products or services in The Canadian Vanguard, Contact Us
Our readers are strongly advised to conduct their own research into individual stocks before making a purchase decision. In addition, investors are advised that past stock performance is no guarantee of future price appreciation. Any recommendation is not a guarantee of any particular stock’s future prices, and The Canadian Vanguard accepts no responsibility or liability for investors’ or readers’ purchases.
The dollar sign “$” in the Toronto Market section in the articles only stands for Canadian dollar and in the US market section “$” stands for US dollar.
(c) This article is published by The Canadian Vanguard on November 2, 2026