







Markets Rally Despite Rising Oil Prices and Treasury Yields as Fed Holds Rates Steady
The Canadian Vanguard Stock Market Report Wednesday, October 28, 2026, Edition
.
The Toronto Market
Wednesday’s Toronto Market Index
The S&P/TSX Composite Index advanced 93.60 points, or 0.26%, to close at 36,265.09.
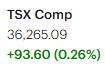
The TSX Composite Index extended its winning streak to three consecutive sessions, reclaiming the psychologically important 36,000 level and continuing to build strength above it.
The market largely shrugged off ongoing geopolitical tensions in the Middle East. Although diplomatic initiatives appear to be underway, recent news reports suggest that no concrete breakthrough is imminent. Traders and investors should remain alert to developments in the region and their potential impact on market sentiment and volatility before making trading decisions.
From a technical perspective, the TSX Composite Index continues to trade comfortably above its 25-day and 50-day moving averages, while maintaining a healthy margin above its 200-day moving average. This positioning suggests that the broader technical trend remains positive.
Tuesday’s TSX Market Statistics
Market breadth on the Toronto Stock Exchange (TSX) was negative on Tuesday, as declining issues outnumbered advancing issues. There were 1,155 decliners and 1,074 advancers, resulting in a decliner-to-advancer ratio of approximately 1.07:1, with 134 issues unchanged. Despite the negative breadth, the overall market session was positive. However, the predominance of declining stocks suggests that underlying market participation remained weak and that internal indicators showed limited improvement.
The exchange recorded 40 new 52-week highs and 46 new 52-week lows, compared with 75 new highs and 72 new lows in the previous session. The number of new 52-week highs fell by approximately 47%, while new 52-week lows declined by about 36%. Although both figures decreased, the decline in new highs was greater, and new 52-week lows continued to outnumber new highs. The ratio of new highs to new lows was approximately 0.87:1, compared with 1.04:1 in the previous session.
These figures suggest that market internals remain relatively weak, despite the reduction in the number of stocks reaching new yearly extremes. The decrease in both new highs and new lows may indicate a moderation in market activity, but it does not, by itself, confirm a meaningful improvement in market breadth. A sustained period in which new 52-week highs consistently outnumber new lows would provide a stronger indication of improving underlying market strength.
Total trading volume on the TSX reached 411,648,000 shares, up approximately 3.6% from the 397,432,992 shares traded in the previous session.
The Toronto market may be moving toward greater stability, but investors should continue to exercise caution. Volatility remains a concern, and a positive market session does not necessarily indicate broad-based strength. Monitoring market internals—including advancing and declining issues, new 52-week highs and lows, and trading volume—will be essential in identifying whether a sustainable trend is emerging. A consistent reversal in which new 52-week highs exceed new 52-week lows would provide a more convincing signal of strengthening market conditions.
Wednesday’s Toronto Stock Exchange (TSX) Market Wrap-Up Report
Market Overview: TSX Extends Its Winning Streak
The Toronto Stock Exchange delivered another positive session on Wednesday, with the S&P/TSX Composite Index advancing 93.60 points, or 0.26%, to close at 36,065.09. The index extended its winning streak to three consecutive sessions, reclaimed the psychologically important 36,000 level, and continued to strengthen above it.
The index’s recent performance suggests that bullish momentum remains intact. From a technical perspective, the TSX Composite continues to trade comfortably above its 25-day and 50-day moving averages and maintains a healthy margin above its 200-day moving average. This configuration supports a constructive medium-term technical outlook, although it does not rule out short-term pullbacks.
However, traders should distinguish between the index’s positive performance and the strength of the broader market. Market breadth can weaken even when a capitalization-weighted index advances, particularly when gains are concentrated in a limited number of sectors or large-cap stocks. Monitoring advancing and declining issues, new 52-week highs and lows, and trading volume remains essential to determining whether the rally is broadening.
Geopolitical tensions in the Middle East also remain a potential source of market volatility. Although diplomatic initiatives appear to be underway, a concrete breakthrough is not yet evident from the available reports. Unexpected developments could influence investor sentiment, commodity prices, and sector performance.
Sector Performance: Technology Leads the Advance
Sector performance was mixed, with Electronic Technology leading the market higher while Transportation and Health Services lagged.
| Sector | Change |
|---|---|
| Electronic Technology | +4.79% |
| Health Technology | +2.35% |
| Energy Minerals | +1.11% |
| Distribution Services | +1.09% |
| Consumer Durables | +0.62% |
| Financials | +0.29% |
| Utilities | -0.61% |
| Retail Trade | -0.85% |
| Health Services | -1.25% |
| Transportation | -1.53% |
Electronic Technology’s strong 4.79% advance was the standout performance of the session, followed by Health Technology, which gained 2.35%. Energy Minerals and Distribution Services also posted solid gains, while Financials advanced modestly.
On the downside, Transportation fell 1.53%, making it the weakest-performing sector in the group, followed by Health Services, which declined 1.25%. Retail Trade and Utilities also finished lower.
Trading perspective: Technology’s leadership points to strength in growth-oriented stocks, while the modest gain in Financials suggests that the market’s advance was not equally strong across all major areas. Traders should watch whether technology leadership broadens and whether lagging sectors begin to recover. A more balanced advance would provide stronger evidence of improving market participation.
Canadian Banks: All Big Six Advance Again
Canada’s six largest banks advanced for a second consecutive session, providing further support to the Financials sector.
| Bank | Ticker | Change |
|---|---|---|
| National Bank of Canada | NA | +0.85% |
| Bank of Montreal | BMO | +0.61% |
| Canadian Imperial Bank of Commerce | CM | +0.59% |
| Bank of Nova Scotia | BNS | +0.34% |
| Royal Bank of Canada | RY | +0.33% |
| Toronto-Dominion Bank | TD | +0.18% |
National Bank led the group with a gain of 0.85%, followed by BMO and CIBC. Royal Bank and TD recorded smaller advances, but the positive performance across all six institutions is noteworthy.
The consecutive gains suggest improving near-term sentiment toward Canada’s major banks. Nevertheless, the relatively modest advances in some names indicate that the move was measured rather than a broad, powerful surge.
Trading perspective: Bank traders may want to monitor whether the Big Six can sustain their upward momentum over subsequent sessions. Continued gains accompanied by stronger volume would offer more convincing evidence of follow-through buying. The current performance alone does not establish a sustained breakout.
Corporate Highlights: Stocks to Watch
Shopify Inc. (SHOP)
Shopify advanced 1.09% to close at $235.47, with approximately 1.2 million shares traded.
The stock outperformed the broader TSX Composite Index, supported by news that Citigroup raised its price target on Shopify’s U.S.-listed shares to US$216 from US$196 while maintaining a Buy rating.
The higher target reflects a more optimistic analyst outlook, but traders should remember that price targets are estimates rather than guarantees. Shopify’s performance should also be evaluated against its recent price trend, trading volume, and upcoming financial results.
What to watch: Whether SHOP can maintain its relative strength and attract follow-through buying. Traders should also distinguish the U.S.-dollar analyst target from the Canadian-dollar TSX closing price.
Agnico Eagle Mines Ltd. (AEM)
Agnico Eagle Mines gained 0.92% to close at $256.08, with approximately 711,000 shares traded.
The advance added to the session’s positive tone in selected resource-related stocks. For traders, the next step is to assess whether the stock can sustain its upward momentum rather than treating a single-session gain as confirmation of a longer-term trend.
What to watch: Follow-through price action, trading volume, and the performance of gold-related equities.
Precision Drilling Corporation (PD)
Precision Drilling was one of the stronger individual performers highlighted in Wednesday’s session, rising 5.45% to $147.65, with approximately 214,800 shares traded.
The sharp advance makes PD a potential watchlist candidate for momentum-oriented traders. However, a strong percentage gain in one session can also be followed by profit-taking or increased volatility.
What to watch: Whether the stock holds its gains, establishes a higher trading range, and attracts additional buying interest. Traders should identify potential entry levels and risk limits rather than chasing an extended move.
5N Plus Inc. (VNP)
5N Plus gained 0.32% to close at $28.39, with approximately 366,800 shares traded. Although the advance was modest compared with some of the session’s stronger performers, VNP remains a stock worth monitoring.
The company is scheduled to release its third-quarter 2026 financial results after the market closes on Monday, November 2, followed by a conference call on Tuesday, November 3. <Cite refs={[“turn295714search2″,”turn295714search10”]}/>
The approaching earnings announcement may increase trading interest and volatility as investors assess the company’s financial performance and outlook.
What to watch: Price action leading into the earnings release, changes in trading volume, and the market’s reaction to the reported results and forward guidance. Traders should also account for the risk of an earnings-related price gap.
VNP may be a useful addition to a watchlist for investors interested in specialty materials and semiconductor-related businesses, but its suitability depends on individual risk tolerance, valuation expectations, and investment objectives.
Key Takeaways for Traders and Investors
1. The TSX’s technical trend remains constructive.
The Composite Index has advanced for three consecutive sessions and is trading above its 25-day, 50-day, and 200-day moving averages. This supports a positive technical bias, but traders should look for continued follow-through before assuming the rally will persist.
2. Watch market breadth, not just the headline index.
An advancing index does not necessarily mean that most stocks are participating. Advancing-versus-declining issues and the balance between new 52-week highs and lows can help identify whether market strength is broadening or narrowing. The latest separate market-statistics report showed mixed internal signals, reinforcing the importance of tracking these measures over multiple sessions rather than drawing conclusions from one day’s figures.
3. Technology is leading, but sector rotation matters.
Electronic Technology and Health Technology delivered the strongest sector gains, while Transportation and Health Services lagged. Traders should monitor whether leadership persists and whether participation spreads to other sectors.
4. The Big Six banks are showing near-term strength.
All six major Canadian banks advanced for a second consecutive session. Continued positive price action could reinforce confidence in Financials, but confirmation through sustained gains and trading activity remains important.
5. Keep individual-stock catalysts on the radar.
Shopify’s higher analyst price target, Precision Drilling’s sharp advance, and 5N Plus’s upcoming earnings announcement offer different reasons for traders to monitor these stocks. Each also presents distinct risks, including momentum reversals, valuation uncertainty, and earnings-related volatility.
6. Manage risk amid geopolitical uncertainty.
Developments in the Middle East could quickly alter market sentiment. Traders should avoid relying solely on the positive index trend and should consider position sizing, stop-loss levels where appropriate, and the possibility of sudden price movements.
Final Market Assessment
Wednesday’s session was encouraging for the Toronto market. The S&P/TSX Composite extended its winning streak, reclaimed the 36,000 level, and remained above its key moving averages. Technology leadership, consecutive gains among the Big Six banks, and strong performances in selected individual stocks added to the positive tone.
Nevertheless, the durability of the advance will depend on more than the headline index. Traders and investors should look for sustained upward momentum, healthier market breadth, and broader sector participation to confirm that the rally is developing into a more durable trend.
For now, the market’s technical posture is constructive, but disciplined risk management remains essential. Monitor the internal indicators, follow important corporate catalysts, and remain prepared for volatility as new economic and geopolitical developments emerge.
Tuesday’s U.S. Market Indexes: Major Averages Extend Winning Streak to Three Sessions
Market Overview
All four major U.S. stock market indexes advanced on Tuesday, extending their winning streak to three consecutive sessions. The Russell 2000 led the group, outperforming the large-cap indexes and signaling a relatively strong session for small-cap stocks.

Despite the broad advance, the gains were more modest than those recorded in the previous session. The positive performance is encouraging, but the indexes’ technical positions remain mixed, suggesting that the market recovery has not yet been confirmed across all segments.
Major Index Performance
| Index | Daily Change | Closing Level |
|---|---|---|
| Dow Jones Industrial Average | +97.53 (+0.19%) | 52,475.10 |
| S&P 500 | +21.38 (+0.28%) | 7,743.98 |
| Nasdaq Composite | +72.04 (+0.27%) | 26,549.85 |
| Russell 2000 | +11.64 (+0.41%) | 2,830.51 |
The Russell 2000 was the strongest performer, gaining 0.41%, followed by the S&P 500 at 0.28% and the Nasdaq Composite at 0.27%. The Dow Jones Industrial Average posted the smallest advance, rising 0.19%.
The fact that all four indexes advanced for a third consecutive session is a positive development. However, the smaller gains compared with Monday suggest that upward momentum moderated somewhat. Traders should monitor whether buying interest continues or the market begins to consolidate after its recent recovery.
Technical Analysis: The Indexes Present a Mixed Picture
Despite three consecutive sessions of gains, the technical outlook varies considerably among the four major indexes. Their positions relative to the 25-day, 50-day, and 200-day moving averages provide important context for assessing the strength and sustainability of the recovery.
Dow Jones Industrial Average: The Technical Leader
The Dow Jones remains above its 25-day, 50-day, and 200-day moving averages. This is the strongest technical configuration among the indexes discussed in this report.
Trading above all three moving averages suggests that the Dow’s short-, intermediate-, and longer-term trends remain constructive. The index’s continued ability to hold above these levels would reinforce its positive technical outlook.
What to watch: Whether the Dow maintains its position above the 25-day and 50-day moving averages while continuing to establish higher price levels. A sustained move would provide further evidence of underlying strength.
Nasdaq Composite: Recovery Needs Confirmation
The Nasdaq Composite has advanced for three consecutive sessions and remains in an upward trend according to the broader price direction described in this report. However, the index is now trading below its 25-day and 50-day moving averages while remaining comfortably above its 200-day moving average.
This is a mixed technical picture. The position above the 200-day average suggests that the longer-term trend has not necessarily broken down, but trading below the 50-day average indicates that intermediate-term momentum needs improvement.
For traders, the 50-day moving average is an important reference point when assessing whether a recovery is gaining traction. A sustained move back above it would strengthen the technical outlook, particularly if accompanied by improving volume and broader participation.
What to watch: Whether the Nasdaq can reclaim its 25-day and 50-day moving averages. Until then, traders should be cautious about interpreting three consecutive positive sessions as confirmation of a fully restored uptrend.
S&P 500: Positive Sessions, but Technical Weakness Remains
The S&P 500 advanced 0.28% on Tuesday but remains below both its 25-day and 50-day moving averages, while holding well above its 200-day moving average.
The index’s three-session recovery is encouraging, but its position below the shorter-term moving averages indicates that near- and intermediate-term technical conditions remain under pressure.
The 200-day moving average provides a useful longer-term reference, but being above it does not eliminate the risk of further weakness. A sustained recovery above the 50-day moving average would offer a more convincing signal that the market is regaining strength.
What to watch: Whether the S&P 500 can reclaim its shorter-term moving averages and sustain the move. Failure to do so could leave the index vulnerable to renewed selling pressure.
Russell 2000: Small Caps Lead the Session, but Need Repair
The Russell 2000 delivered the strongest percentage gain of the four indexes, rising 0.41% to close at 2,830.51. Its performance suggests that small-cap stocks participated positively in Tuesday’s advance.
However, the index remains below its 25-day, 50-day, and 200-day moving averages. This makes its technical position the weakest of the four indexes in terms of its relationship to these key trend indicators.
One strong session—or even several consecutive advances—is not enough to establish a durable recovery when the index remains below all three moving averages. The Russell 2000 needs a more sustained improvement in price action to repair its technical structure.
What to watch: A sustained recovery above the 25-day moving average, followed by the 50-day moving average, would be an initial sign of improvement. Reclaiming the 200-day moving average would provide additional evidence of a broader trend recovery.
Key Takeaways for Traders and Investors
1. Three consecutive sessions of gains are encouraging, but confirmation is still needed.
All four major indexes have advanced for three straight sessions. This broad positive performance supports the view that buying interest has returned, but the more modest gains on Tuesday suggest traders should watch for follow-through rather than assume the recovery will continue uninterrupted.
2. The Dow has the strongest technical structure.
The Dow Jones remains above its 25-day, 50-day, and 200-day moving averages. Its relative strength makes it an important index to monitor when assessing the health of the broader market.
3. The Nasdaq and S&P 500 need to reclaim their 50-day moving averages.
Both indexes remain below their 25-day and 50-day moving averages. Sustained moves above the 50-day averages would provide stronger evidence that the current recovery is improving their intermediate-term technical outlook.
4. Russell 2000 leadership is encouraging, but the index remains technically weak.
Small caps led Tuesday’s advance, but the Russell 2000 remains below all three moving averages. Traders should look for sustained improvement rather than interpreting one session of relative outperformance as a confirmed reversal.
5. Distinguish a market rebound from a confirmed uptrend.
Consecutive gains can signal improving sentiment, but price action relative to key moving averages remains important. Traders should also consider market breadth, trading volume, and individual stock setups before increasing exposure.
Final Market Assessment
Tuesday was another positive session for U.S. equities, with all four major indexes extending their winning streak to three sessions. The Russell 2000 led the advance, while the Dow Jones continued to demonstrate the strongest technical positioning.
Nevertheless, the overall technical picture remains mixed. The Dow is trading above all three key moving averages, while the Nasdaq and S&P 500 remain below their 25-day and 50-day averages. The Russell 2000, despite leading Tuesday’s gains, remains below its 25-day, 50-day, and 200-day averages.
For traders and investors, the appropriate approach is to remain cautiously constructive. The recent gains are encouraging, but a more convincing improvement would require the Nasdaq and S&P 500 to reclaim their 50-day moving averages and the Russell 2000 to make sustained progress toward repairing its technical structure.
The bottom line: The U.S. market recovery is progressing, but the indexes have not yet confirmed a uniformly strong technical trend. Watch the key moving averages, look for sustained buying, and maintain disciplined risk management as the next sessions unfold.
Wednesday’s U.S. Market Statistics: NYSE Internals Remain Weak as Nasdaq Shows Signs of Improvement
New York Stock Exchange (NYSE): Negative Breadth and Persistently Weak Market Internals
Market breadth on the New York Stock Exchange remained negative on Wednesday, as declining issues significantly outnumbered advancing issues. The exchange recorded 1,489 decliners, 1,232 advancers, and 71 unchanged issues, producing a decliner-to-advancer ratio of approximately 1.21:1. In other words, there were about six declining stocks for every five advancing stocks.
The negative breadth indicates that the market’s underlying participation remained weak, despite any positive price action in individual stocks or major indexes.
The NYSE recorded 47 new 52-week highs and 140 new 52-week lows, compared with 81 new highs and 146 new lows in the previous session. The number of new 52-week highs fell approximately 42%, while new 52-week lows declined by about 4%.
The resulting ratio of new 52-week highs to new 52-week lows was approximately 0.34:1, or about one new high for every three new lows. This remains within the weak range observed over the past five sessions and suggests that the broader market has yet to establish a meaningful improvement in its internal strength.
Although the number of new lows decreased slightly, the decline was not sufficient to change the overall picture. The substantial gap between new highs and new lows indicates that many stocks continue to struggle to establish positive longer-term price trends.
NYSE trading volume reached approximately 5.58 billion shares, up about 6.2% from the previous session’s 5.26 billion shares. Higher volume alongside negative breadth deserves attention because it indicates increased trading activity without a corresponding improvement in the balance between advancing and declining stocks. However, volume alone does not establish whether selling pressure is intensifying.
NYSE Market Assessment
The NYSE’s market internals remain weak, with little meaningful improvement in the latest session. Negative breadth, combined with new 52-week lows outnumbering new highs by approximately three to one, points to continued underlying market vulnerability.
For traders and investors, this environment calls for caution. A positive move in a headline index should not automatically be interpreted as evidence of a broad-based recovery. Investors should look for a sustained improvement in market breadth and, particularly, a reversal in which new 52-week highs consistently outnumber new lows.
Until such improvement becomes evident, traders should maintain disciplined position sizing, define their risk limits before entering trades, and be prepared to reassess positions if market conditions deteriorate.
Nasdaq: Positive Breadth and Improving, but Still Weak, Internals
The Nasdaq delivered a more encouraging breadth reading on Wednesday. Advancing stocks outnumbered declining stocks, with 2,957 advancers, 1,972 decliners, and 167 unchanged issues. This produced an advancer-to-decliner ratio of approximately 1.50:1, equivalent to about three advancing stocks for every two declining stocks.
Positive breadth indicates that more Nasdaq-listed stocks participated in the session’s advance than declined, providing a more constructive signal than the NYSE’s negative breadth.
However, the picture from the Nasdaq’s longer-term market internals remains less encouraging.
The exchange recorded 107 new 52-week highs and 244 new 52-week lows, compared with 85 new highs and 289 new lows in the previous session. New 52-week highs increased approximately 26%, while new 52-week lows declined by about 16%.
The ratio of new 52-week highs to new 52-week lows improved to approximately 0.44:1, or one new high for every 2.28 new lows. This represents a modest improvement from the previous session, but new lows still substantially outnumber new highs.
The latest figures suggest that the Nasdaq’s internal indicators are improving at the margin. Nevertheless, several weeks of new 52-week lows consistently exceeding new highs have left the market’s underlying technical condition weakened. One session of improving figures does not establish a sustained reversal.
Nasdaq trading volume reached approximately 8.28 billion shares, up about 1.1% from the previous session’s 8.19 billion shares. Volume was therefore broadly unchanged. The Nasdaq Composite also advanced 0.27%, according to the accompanying market-index report.
The combination of positive breadth, a rising index, and a modest improvement in the new-high/new-low ratio provides some encouragement. However, the persistent excess of new 52-week lows indicates that the recovery has not yet translated into broad-based longer-term strength.
Nasdaq Market Assessment
The Nasdaq showed better immediate market participation than the NYSE, with advancers comfortably outnumbering decliners. Its new-high/new-low ratio also improved as new highs increased and new lows decreased.
These are constructive developments, but the underlying indicators remain weak. For the Nasdaq’s recovery to become more convincing, traders should look for several consecutive sessions of improving breadth, a continued reduction in new 52-week lows, and a sustained increase in new highs relative to new lows.
The Nasdaq’s recent price improvement is worth monitoring, but traders should avoid assuming that the market has fully recovered before the internal indicators provide stronger confirmation.
Key Takeaways for Traders and Investors
1. The NYSE remains the weaker market in terms of breadth.
Decliners outnumbered advancers, and new 52-week lows exceeded new highs by approximately three to one. This combination suggests that underlying weakness remains widespread. Traders should be cautious about interpreting gains in individual large-cap stocks or headline indexes as evidence of a broad market recovery.
2. The Nasdaq is showing early signs of improvement.
Positive breadth, a 0.27% index advance, and a better new-high/new-low ratio indicate improving short-term conditions. However, the continued excess of new 52-week lows means the recovery still requires confirmation.
3. Watch the new-high/new-low ratio closely.
The ratio provides useful information about the number of stocks establishing positive versus negative longer-term extremes. A sustained move toward parity—and eventually a consistent excess of new highs over new lows—would provide stronger evidence of improving market health.
4. Higher trading volume is not automatically bullish.
NYSE volume increased by approximately 6.2%, while Nasdaq volume rose only about 1.1%. Volume must be evaluated alongside price movement and market breadth. Higher activity accompanied by negative breadth does not, by itself, confirm accumulation or distribution.
5. Maintain disciplined risk management.
In a market with weak internals, traders should be selective, avoid excessive exposure, and establish clear exit criteria. Investors should also distinguish between a short-term rebound and a sustained improvement in the broader market’s technical condition.
Final Market Assessment
Wednesday’s market statistics present a mixed picture. The NYSE continues to show weak breadth and a substantial excess of new 52-week lows over new highs. The Nasdaq, by contrast, recorded positive breadth and some improvement in its new-high/new-low ratio, supported by a 0.27% index advance.
The distinction is important: the Nasdaq appears to be improving in the short term, but neither exchange has yet demonstrated the sustained improvement in market internals needed to confirm a broadly strengthened market.
For now, traders and investors should remain cautious, monitor the indicators over successive sessions, and avoid increasing risk solely because major indexes have posted consecutive gains. A durable recovery will require stronger participation across individual stocks, fewer new 52-week lows, and a more consistent balance in favor of new highs.
Until those conditions develop, protecting capital and maintaining flexibility should remain priorities.
Wednesday’s U.S. Market Wrap-Up Report
Market Overview: Wall Street Advances as AI Optimism Offsets Rising Yields and Oil Prices
Wall Street delivered a relatively positive session on Wednesday, with major U.S. stock indexes advancing for a third consecutive session. Investors largely shrugged off the Federal Reserve’s decision to hold interest rates steady, while attention shifted toward earnings announcements from major technology companies expected after the closing bell.
Renewed optimism surrounding artificial intelligence (AI), supported by strong earnings from SK Hynix and positive developments involving Oracle and other industry participants, helped offset pressure from rising Treasury yields and higher crude oil prices.
The S&P 500 gained 0.28% to close at 7,743.98, while the Nasdaq Composite advanced 0.27% to 26,549.85. The Dow Jones Industrial Average rose 0.19% to 52,475.10. The Russell 2000 outperformed the other major indexes, climbing 0.41% to 2,830.51, suggesting that small-cap stocks also participated in the advance.
Although the broad market finished higher, the gains were relatively modest compared with the previous session. Moreover, the latest market statistics indicate that the underlying market internals remain weak, particularly on the New York Stock Exchange (NYSE). The Nasdaq showed better short-term breadth, but new 52-week lows continued to outnumber new highs substantially.
The market is therefore displaying two different characteristics: improving short-term price action and a still-fragile underlying technical structure.
Sector Performance: Producer Manufacturing Leads
Sector performance was mixed, with Producer Manufacturing leading the advance while Transportation and Utilities were among the weakest performers.
| Sector | Change |
|---|---|
| Producer Manufacturing | +1.23% |
| Energy Minerals | +0.65% |
| Health Technology | +0.59% |
| Non-Energy Minerals | +0.53% |
| Commercial Services | +0.38% |
| Financials | +0.25% |
| Health Services | +0.20% |
| Technology Services | +0.15% |
| Distribution Services | -0.11% |
| Consumer Non-Durables | -0.23% |
| Consumer Durables | -0.57% |
| Utilities | -0.76% |
| Transportation | -1.21% |
Producer Manufacturing led the sectors with a gain of 1.23%, followed by Energy Minerals and Health Technology. Technology Services also advanced, supported by renewed enthusiasm surrounding AI infrastructure and semiconductor-related stocks.
On the downside, Transportation fell 1.21%, making it the weakest-performing sector in the group. Utilities declined 0.76%, while Consumer Durables lost 0.57%.
The sector performance suggests that investors continued to favor selected growth, industrial, and resource-related opportunities, although the gains were not uniform across the market.
Trading perspective: Sector leadership is worth monitoring, particularly in businesses connected to AI infrastructure, manufacturing, and semiconductor production. However, traders should look for sustained relative strength rather than treating a single session’s gains as confirmation of a durable trend.
Oil and Treasury Yields: Important Risks for Equities
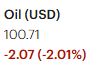
U.S. crude oil futures rose almost 2%, approaching $102 per barrel, while the 10-year U.S. Treasury yield edged higher to 5.01%.
These developments are important for equity investors because higher oil prices can increase operating and transportation costs, while elevated Treasury yields can put pressure on equity valuations by increasing the return investors can earn from bonds.
Growth-oriented technology companies can be particularly sensitive to changes in interest rates because a significant portion of their expected value may depend on future earnings. Higher yields can also increase financing costs for companies investing heavily in data centers, computing infrastructure, and other capital-intensive projects.
At the same time, rising energy prices may benefit selected energy producers while creating challenges for businesses that consume substantial amounts of fuel.
What to watch: Further increases in Treasury yields could complicate the market’s recovery, especially if investors begin reassessing the valuations of high-growth technology stocks. Oil prices also deserve close attention because sustained increases could influence inflation expectations and the outlook for monetary policy.
Corporate Highlights: AI Infrastructure and Earnings Drive Stock Moves
SK Hynix, Micron and Samsung: Memory Chip Stocks Surge
U.S.-listed shares of SK Hynix rose approximately 13% after the South Korean memory-chip manufacturer reported exceptionally strong third-quarter earnings and indicated that demand could continue to outpace supply through 2030.
The earnings announcement also lifted other memory-chip stocks. Micron Technology gained approximately 5.9%, while Samsung advanced 9%.
The strong performance highlights the importance of memory chips in the expanding AI infrastructure market. AI data centers require substantial quantities of advanced memory and other high-performance components, and supply constraints can support pricing power for manufacturers when demand remains strong.
However, the outlook is not without risks. Semiconductor companies have previously experienced sharp share-price swings as investors reassessed AI spending, financing requirements, competitive pressures, and the potential returns on enormous infrastructure investments.
Trading perspective: Strong earnings and positive demand forecasts can act as catalysts, but traders should distinguish between an earnings-driven rally and a sustained technical recovery. Watch whether these stocks maintain their gains and whether improving performance spreads across the broader semiconductor industry.
Vertiv Holdings (VRT): AI Infrastructure Demand Supports a Strong Advance
Vertiv Holdings surged 16%, making it the strongest-performing stock in the S&P 500 during the session.
The data-center infrastructure provider reported strong third-quarter earnings and raised its full-year guidance, reinforcing investor interest in companies supplying the infrastructure required to support AI computing.
Vertiv’s performance also illustrates that the AI investment theme extends beyond chipmakers and major cloud-computing platforms. Data centers require supporting systems for power management, cooling, and other critical infrastructure, creating opportunities for companies operating throughout the supply chain.
Trading perspective: VRT’s sharp advance puts the stock on the radar of momentum-oriented traders. However, a 16% gain in one session can increase the risk of profit-taking and volatile price swings. Traders should assess the stock’s post-earnings trading range, volume, and risk-to-reward profile before considering an entry.
GE HealthCare (GEHC): Earnings Beat and Higher Guidance Lift Shares
GE HealthCare gained 6.6% after the medical-device manufacturer exceeded third-quarter expectations and raised its annual guidance.
Management now expects organic revenue growth of approximately 4% for the year, compared with its previous outlook of 3% to 4%.
The market’s positive reaction suggests that investors welcomed the company’s performance and improved outlook. Unlike the AI infrastructure trade, GE HealthCare offers exposure to medical technology and healthcare equipment, providing a different source of potential growth.
Trading perspective: Traders should monitor whether the stock can sustain its post-earnings advance. For longer-term investors, revenue growth, profitability, and management’s forward guidance remain important considerations.
GE Vernova (GEV): Strong Orders Fail to Prevent a Decline
GE Vernova fell 1.9%, despite reporting third-quarter orders that exceeded Wall Street’s expectations.
The negative price reaction suggests that investors were focused on concerns surrounding the sustainability and financing of AI-related capital expenditure, rather than the headline order figures alone.
This highlights a broader challenge for companies exposed to the AI investment cycle. Strong demand and order growth may not be enough to support share prices if investors become concerned about future spending commitments, margins, cash flow, or the returns generated by new investments.
Trading perspective: The market’s reaction to earnings and orders can sometimes be more informative than the headline results. Traders should pay attention to management guidance, capital expenditure plans, and the relationship between expected growth and valuation.
Boston Scientific (BSX): Guidance Reduction Weighs on Shares
Boston Scientific declined 5.8% after announcing a widely anticipated reduction in its full-year guidance.
The medical-device company has faced operational disruptions and business impacts following a cyberattack in late August.
The decline demonstrates how company-specific operational problems can outweigh broader market strength. Even during a positive market session, stocks facing deteriorating guidance or unexpected business disruptions may remain vulnerable.
Trading perspective: Traders should monitor subsequent company updates for evidence that operational conditions are stabilizing. Investors should pay particular attention to the revised outlook and any indications of lasting financial effects from the disruption.
Semiconductor Stocks: A Rebound Within a Still-Challenging Technical Picture
Semiconductor stocks were among Wednesday’s strongest performers, helping lift technology-related shares. However, the recent advance comes against a backdrop of earlier weakness and concerns about the sustainability of the AI investment boom.
The sector has faced questions about the enormous amounts of capital required to build AI data centers, the financing available to support that spending, the emergence of increasingly competitive Chinese AI models, and the returns that AI companies can ultimately generate from their investments.
These concerns have left some semiconductor share charts technically damaged despite renewed buying interest.
At the center of the debate is whether leading AI developers and infrastructure operators can build sufficiently profitable business models to justify continued investment in computing capacity. Investors want evidence that higher spending will translate into sustainable revenue, stronger cash flow, and attractive returns on invested capital.
Supply constraints remain another important factor. Advanced memory, graphics processing units (GPUs), and optical components are among the critical resources required to expand AI computing capacity. Constraints can benefit suppliers by supporting demand and pricing, but they can also limit deployment and increase costs for customers.
Ultimately, the sustainability of the semiconductor rally will depend on both demand and the economics of the AI investment cycle. Strong earnings and supply constraints are supportive, but investors will continue to scrutinize capital expenditure commitments and the expected returns from new infrastructure.
Semiconductor and Storage Stocks: Wednesday’s Leaders
| Stock | Ticker | Daily Change | Closing Price | Volume |
|---|---|---|---|---|
| SanDisk Corporation | SNDK | +7.66% | $1,404.77 | 9.3 million |
| Micron Technology | MU | +5.86% | $983.23 | 30.7 million |
| Lam Research | LRCX | +5.39% | Not provided | 10.8 million |
| Western Digital | WDC | +4.08% | $396.42 | 7.4 million |
Closing prices and volumes are reproduced from the supplied draft.
SanDisk advanced 7.66%, while Micron gained 5.86% and Lam Research rose 5.39%. Western Digital also posted a strong gain of 4.08%.
The performance indicates renewed buying interest across memory, semiconductor equipment, and data-storage stocks. These companies occupy different positions in the AI infrastructure supply chain, but each may benefit from continued investment in computing capacity and data storage.
Nevertheless, the sector’s earlier volatility remains relevant. Strong one-day gains do not automatically repair previous technical damage, and stocks that have experienced significant declines can remain vulnerable to sharp reversals.
What to watch: Traders should monitor whether these stocks continue to outperform the broader market, whether volume supports the recovery, and whether prices can reclaim important technical levels. Investors should also assess valuations, earnings expectations, and the sustainability of AI-related spending before drawing longer-term conclusions.
Market Internals: The Rally Still Needs Broader Confirmation
Wednesday’s market statistics provide an important qualification to the positive index performance.
NYSE: Weak Breadth Remains a Concern
On the New York Stock Exchange, declining issues outnumbered advancing issues by approximately 1.21 to 1. There were 47 new 52-week highs compared with 140 new 52-week lows, producing a new-high/new-low ratio of approximately 0.34 to 1.
This indicates that the underlying market remained weak, with substantially more stocks reaching new yearly lows than new highs. NYSE trading volume also increased by approximately 6.2% from the previous session.
The combination of negative breadth and a persistent excess of new lows suggests that the market’s advance has not been accompanied by a broad improvement in underlying stock performance.
Nasdaq: Short-Term Improvement, but Longer-Term Weakness Persists
The Nasdaq presented a more constructive picture. Advancing stocks outnumbered declining stocks by approximately 1.50 to 1, while the Composite Index gained 0.27%.
New 52-week highs increased from 85 to 107, and new lows declined from 289 to 244. The resulting new-high/new-low ratio improved to approximately 0.44 to 1.
Although these changes point to improving short-term conditions, new lows still exceeded new highs by more than two to one.
What These Indicators Mean for Traders
The difference between index performance and market internals matters. A rising index can coexist with widespread weakness if a relatively limited group of large companies accounts for much of the advance.
The Nasdaq’s positive breadth and improving new-high/new-low ratio are encouraging, but the NYSE’s negative breadth and continued excess of new lows argue against assuming that the broader market has fully recovered.
For a more convincing improvement, traders should look for several consecutive sessions of stronger breadth, fewer new 52-week lows, and a sustained increase in the number of stocks establishing new highs.
Key Takeaways for Traders and Investors
1. The major indexes are recovering, but the rally remains uneven.
All four major U.S. indexes advanced for a third consecutive session. However, their technical positions remain mixed, and the weak market internals suggest that the recovery needs broader participation.
2. AI remains a powerful market catalyst, but capital returns are increasingly important.
Strong results from SK Hynix, Micron, Vertiv, and other infrastructure-related companies reinforce the demand story. Nevertheless, investors will continue to examine whether AI-related capital expenditure can generate sufficient returns to justify current investment levels and valuations.
3. Semiconductor stocks are rebounding, but confirmation is needed.
Wednesday’s gains were substantial across selected chip and storage companies. Traders should watch for follow-through buying and technical recovery rather than assume that earlier weakness has been fully reversed.
4. Rising Treasury yields and oil prices remain potential headwinds.
A 10-year Treasury yield of 5.01% and crude oil approaching $102 per barrel create additional challenges for equity valuations and operating costs. Further increases could put pressure on selected growth stocks and complicate the market’s recovery.
5. Earnings reactions can reveal what investors really value.
Vertiv and GE HealthCare advanced after strong results and improved guidance, while GE Vernova declined despite strong orders and Boston Scientific fell following a guidance reduction. The contrasting reactions demonstrate the importance of forward expectations, profitability, and business risks.
6. Market internals should remain part of every trading decision.
The NYSE continues to show weak breadth, while the Nasdaq’s internal indicators are improving but remain below healthy levels. Traders should use these readings alongside price trends, volume, and individual-stock analysis to assess risk.
7. Maintain disciplined risk management.
A positive index session does not eliminate the risk of sudden reversals. Traders should avoid chasing sharp post-earnings moves, define acceptable losses in advance, and adjust exposure to changing market conditions.
Final Market Assessment
Wednesday was a constructive session for U.S. equities, supported by renewed AI enthusiasm, strong semiconductor performance, and encouraging earnings from selected companies. All four major indexes advanced for a third consecutive session, while Vertiv, SK Hynix, Micron, and other technology-related names attracted substantial buying interest.
However, the market remains at a point where optimism about AI growth must be weighed against financing costs, capital expenditure requirements, elevated Treasury yields, and questions about the long-term profitability of the AI investment cycle.
The technical picture also remains mixed. The Dow Jones is above its 25-day, 50-day, and 200-day moving averages, but the Nasdaq and S&P 500 remain below their shorter-term moving averages, while the Russell 2000 remains below all three. Meanwhile, market internals continue to show weakness, particularly on the NYSE.
The bottom line for traders and investors: Wednesday’s advance is encouraging, but it is not yet sufficient to confirm a broadly supported market recovery. Watch for sustained improvement in market breadth, follow-through in semiconductor and AI infrastructure stocks, and evidence that corporate earnings and capital spending can justify current valuations. Until those signals strengthen, a cautiously constructive stance combined with disciplined risk management remains appropriate.
.
NOTICE TO READERS
The Canadian Vanguard Stock Market is about empowering you to build and manage your wealth by yourself. There is certainly no magic in managing finances or wealth but one needs to know what to do and commit to doing what is needed. When you are ready to start the journey to Take Charge and Put Your Destiny In Your Own Hands, start with reading The Canadian Vanguard every market day. If and when you need more related information or to advertise your business products or services in The Canadian Vanguard, Contact Us
Our readers are strongly advised to conduct their own research into individual stocks before making a purchase decision. In addition, investors are advised that past stock performance is no guarantee of future price appreciation. Any recommendation is not a guarantee of any particular stock’s future prices, and The Canadian Vanguard accepts no responsibility or liability for investors’ or readers’ purchases.
The dollar sign “$” in the Toronto Market section in the articles only stands for Canadian dollar and in the US market section “$” stands for US dollar.
(c) This article is published by The Canadian Vanguard on October 28, 2026