
U.S. Equities Close Mixed as Oil Prices Reverse Higher from Early Weakness
The Canadian Vanguard Stock Market Report – Monday March 30, 2026 Edition.
.
The Toronto Market
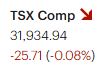
The Toronto Market Index: The S&P/TSX Composite Index declined 25.71 points (0.08%) to close at 31,934.94, reflecting a late-session reversal after early strength. The index opened higher and advanced approximately 200 points in morning trading, suggesting initial risk-on sentiment. However, momentum faded into the afternoon, with selling pressure emerging in the final hour to push the index into negative territory.
Intraday volatility appears closely tied to ongoing developments in the Middle East, which continue to influence crude oil prices. Given the TSX’s heavy weighting in energy stocks, fluctuations in oil prices are exerting a notable push-pull effect on the broader index, contributing to choppier trading conditions.
Despite the pullback, the TSX has demonstrated relative resilience compared to other major North American indices, supported in part by strength in the energy sector. This relative outperformance underscores the market’s sensitivity to commodity dynamics, particularly in the current geopolitical environment.
![]()
Today’s TSX Market Statistics
Market breadth on the TSX was modestly positive, with advancing issues outpacing decliners. A total of 1,193 stocks advanced versus 966 that declined, resulting in an advancer-to-decliner ratio of approximately 1.23:1. This indicates a relatively broad-based, though not overwhelming, participation on the upside. An additional 111 issues closed unchanged.
New highs versus new lows also point to improving internal strength. The TSX recorded 89 new 52-week highs compared to 59 new lows, a notable shift from Friday’s readings of 66 new highs and 107 new lows. This reversal suggests strengthening momentum and a potential improvement in underlying market sentiment.
Trading activity remained steady, with total volume reaching 500.8 million shares, essentially flat compared to 499.9 million shares traded in the previous session. The stable volume profile, alongside improving breadth, may indicate a measured accumulation rather than aggressive buying.
Today’s Toronto Market Wrap-Up Report
Market performance remained heavily influenced by ongoing geopolitical tensions in the Middle East, with oil price movements continuing to act as a key driver of intraday sentiment. Equities opened higher and extended gains through the morning alongside rising oil prices. However, momentum reversed by mid-day, and selling pressure intensified into the close, resulting in a broad-based pullback.
Sector performance was mixed, with five of the ten major sectors finishing higher. Leadership came from Durable Consumer Goods & Services (+0.81%), Utilities (+0.68%), and Information Technology (+0.67%), suggesting some defensive and growth-oriented rotation. Financials posted a modest gain of 0.03%, reflecting underlying weakness despite a positive close.
Royal Bank of Canada edged up 0.03%, closely mirroring the TSX’s intraday pattern, with early strength giving way to late-session weakness. Notably, most of Canada’s major banks—excluding TD Bank—have exhibited a downward trend since mid-February. While fundamentals in the sector remain solid, the current technical setup suggests continued near-term pressure, though it may present selective entry opportunities for long-term, income-focused investors.
In corporate developments, Suncor Energy Inc. declined 0.60% to close at $91.94 on volume of 6.4 million shares. The pullback appears constructive, as the stock had recently shown signs of being technically extended, and a modest retracement may help stabilize its upward trend.
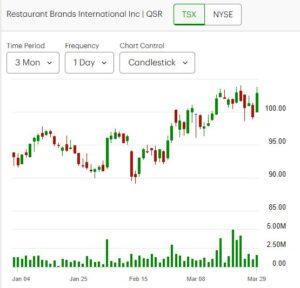
Outside the energy sector, Restaurant Brands International Inc. was among the day’s top performers, rising 3.61% to $102.81 on 1.56 million shares traded, demonstrating relative strength despite broader market weakness.
Overall, the session reflected a fragile market tone. Early gains were not sustained, and the late-session reversal underscores persistent volatility and cautious investor sentiment amid macro and geopolitical uncertainty.
.
The US Markets
U.S. Market Indices
Major U.S. equity indices closed mostly lower on Friday, reflecting continued weakness in broader market sentiment. The Dow Jones Industrial Average was the exception, edging up 49.50 points (0.11%) to close at 45,216.64. In contrast, the S&P 500 declined 25.13 points (0.39%) to 6,343.72, while the Nasdaq Composite fell 153.72 points (0.73%) to 20,794.64. The Russell 2000 underperformed, dropping 35.69 points (1.46%) to finish at 2,414.01, marking its third consecutive session of notable losses.
The pronounced weakness in the Russell 2000 highlights continued pressure on small-cap stocks, which are often more sensitive to tightening financial conditions and shifts in risk appetite. This underperformance may signal a more cautious tone among investors toward economically sensitive segments of the market.
From a technical perspective, key indices remain under pressure. The Nasdaq Composite continues to trade below its 200-day moving average—a level it has failed to reclaim since early February—suggesting a persistent bearish intermediate-term trend. Similarly, the Dow Jones Industrial Average has remained below its 200-day moving average for the past one and a half weeks, reinforcing the view that upside momentum remains limited.
Overall, the combination of small-cap weakness and major indices trading below key technical thresholds points to a fragile market structure, with downside risks still elevated in the near term.

Monday’s U.S. Market Statistics
NYSE: Market breadth on the NYSE was negative, with declining issues outpacing advancers. A total of 2,410 stocks declined compared to 2,103 that advanced, resulting in a decliner-to-advancer ratio of 1.14:1. An additional 353 issues closed unchanged, pointing to moderately broad-based selling pressure.
Despite the negative breadth, internal momentum showed some signs of stabilization. The exchange recorded 147 new 52-week highs versus 339 new lows, an improvement from Friday’s 134 highs and 410 lows. While new lows continue to dominate, the contraction in their number suggests that downside momentum may be easing marginally.
Trading activity picked up modestly, with total volume reaching 5.55 billion shares, a 3% increase from the previous session. The rise in volume alongside negative breadth may indicate continued distribution, though not at an accelerated pace.
NASDAQ: Weakness was more pronounced on the NASDAQ, where declining stocks significantly outnumbered advancers. There were 2,794 decliners versus 2,021 advancers, producing a decliner-to-advancer ratio of 1.38:1, with 321 issues unchanged. This reflects heavier selling pressure, particularly in growth and technology-oriented names.
New highs versus new lows further underscore the market’s fragility. The NASDAQ recorded 57 new 52-week highs compared to 531 new lows. Although this marks a slight improvement from Friday’s 577 new lows, the persistently elevated number of new lows indicates ongoing weakness in the broader market.
Volume on the NASDAQ rose to 9.53 billion shares, up 6% from the prior session. The combination of higher volume and negative breadth suggests increased conviction behind the selling, reinforcing the cautious tone in the market.
NOTICE TO READERS
The Canadian Vanguard Stock Market is about empowering you to build and manage your wealth by yourself. There is certainly no magic in managing finances or wealth but one needs to know what to do and commit to doing what is needed. When you are ready to start the journey to Take Charge and Put Your Destiny In Your Own Hands, read The Canadian Vanguard every market day. If you need more related information, Contact Us
Our readers are strongly advised to conduct their own research into individual stocks before making a purchase decision. In addition, investors are advised that past stock performance is no guarantee of future price appreciation. Any recommendation is not a guarantee of any particular stock’s future prices, and The Canadian Vanguard accepts no responsibility or liability for investors’ or readers’ purchases.
Stocks In The News/ Stocks To Watch and Market Strategy will soon be available but only to Paying Subscribers. The dollar sign “$” in the Toronto Market section in the articles only stands for Canadian dollar and in the US market section “$” stands for US dollar.
(c) This article is published by The Canadian Vanguard on March 30, 2026