The Canadian Vanguard Stock Market Report – Weekend March 27 – 29, 2026 Edition
US Equities Decline Amid Strong Sell-Off Driven by Rising Oil Prices and Geopolitical Concerns.
. The Canadian Vanguard Stock Market Report is updated regularly during the weekend
.
The Toronto Market
The Toronto Market Index
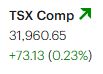
The S&P/TSX Composite Index rose by 73.13 points, or 0.23%, to close at 31,960.65. It was the only one among the four North American indices we track to finish the day in positive territory. This gain ended a three-session streak of significant declines, marking a return to upward momentum.
The index was supported primarily by gains in gold and silver mining stocks. Despite ongoing geopolitical tensions in the Middle East, the TSX showed resilience and managed to defy broader market trends.
Friday’s TSX Market Statistics
On the TSX, declining issues outnumbered advancing issues. There were 1,405 decliners compared to 717 advancers, resulting in a decliner-to-advancer ratio of 1.96:1—nearly two decliners for every advancer. Meanwhile, 144 issues remained unchanged.
The exchange recorded 66 new 52-week highs and 107 new 52-week lows, compared with 61 new highs and 55 new lows in the previous session.
Total trading volume on the TSX reached 499,940,339 shares, representing a 3% increase from the 483,253,342 shares traded in the prior session.
Friday’s Toronto Market Wrap-Up Report — Investor & Trader Focus
The TSX continues to trade under the influence of geopolitical risk tied to the ongoing Middle East conflict, with price action increasingly reflecting headline sensitivity rather than underlying fundamentals. While the index managed to close higher, the broader internal picture remains weak, reinforcing a cautious near-term outlook.
Sector performance highlights a defensive rotation. Basic Materials led with a 2.96% gain, driven primarily by strength in gold and silver miners as investors sought safe-haven exposure. Energy followed, up 1.71%, supported by firm commodity pricing. Notably, leadership in both sectors suggests market positioning for sustained uncertainty rather than growth acceleration.
Market breadth remains a concern. Only four of ten sectors closed in positive territory—an improvement from Thursday’s single advancing sector, but still indicative of limited participation. Weakness in Financials (-1.05%), Consumer Discretionary (-1.87%), and Technology (-2.46%) signals continued pressure on rate-sensitive and growth-oriented segments. For traders, this divergence reinforces the importance of sector selectivity and relative strength strategies.
Volatility remains elevated and structurally driven. Markets are reacting to geopolitical developments in real time, increasing the likelihood of sharp intraday reversals and short-lived trends. Under these conditions, shorter time horizons and tactical positioning remain preferable.
From a positioning standpoint, capital preservation should be prioritized. Elevated cash levels, reduced position sizing, and disciplined risk controls are appropriate. New long exposure should be selective and focused on relative strength areas such as materials and energy.
Sector & Stock Highlights
In Energy, Suncor Energy Inc. gained 2.87% to close at $92.50 on strong volume. Cenovus Energy Inc. rose 3.39% to $37.23, while Canadian Natural Resources Limited added 2.87% to $69.46. Methanex Corporation surged 9.96%, highlighting momentum-driven interest.
Outside Energy, Strathcona Resources Ltd. climbed 8.85%. Celestica Inc. gained 2.66%, showing relative resilience. Precious metals names remained in focus, including Wheaton Precious Metals Corp. (+4.67%), Agnico Eagle Mines Limited (+3.15%), Lundin Gold Inc. (+3.56%), and Franco-Nevada Corporation (+2.81%).
Next Week Trading Game Plan
1. Core Strategy: Trade the Theme, Not the Noise
The dominant theme remains geopolitical risk. Traders should align with sectors benefiting from uncertainty—primarily materials (gold/silver) and energy. Avoid overreacting to single headlines; instead, look for sustained moves confirmed by volume and follow-through.
2. Sector Focus & Rotation
- Overweight (tactical): Materials, Energy
- Market Neutral / Watchlist: Industrials, Utilities
- Underweight / Short bias (on rallies): Financials, Consumer Discretionary, Technology
Watch for continuation in gold-related names such as Agnico Eagle Mines Limited and Franco-Nevada Corporation—these remain key sentiment indicators.
3. Key Trading Setups
- Momentum Trades: Focus on stocks showing relative strength and high volume (e.g., Methanex Corporation). Use pullbacks rather than chasing breakouts.
- Mean Reversion: In weak sectors, expect sharp but short-lived rallies—potential opportunities for short-term trades rather than trend changes.
- Breakout Confirmation: Only act on breakouts that hold for more than one session with strong volume support.
4. Risk Management Framework
- Reduce position sizing (50–70% of normal exposure)
- Use tighter stop-loss levels due to volatility
- Avoid holding large overnight positions unless hedged
- Maintain higher-than-normal cash allocation
5. Key Market Signals to Monitor
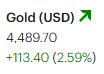
- Gold prices: strength confirms defensive positioning
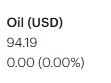
- Crude oil trends: Direct impact on TSX energy weighting
- Volatility spikes: risk-off escalation
- Market breadth: Improvement needed for sustainable rallies
6. Tactical Scenarios
- Bullish Case: Continued strength in commodities lifts TSX despite weak breadth → stay long materials/energy
- Bearish Case: Escalation in conflict triggers broad selloff → shift further to cash, avoid dip-buying
- Neutral/Choppy Case: Range-bound volatility → prioritize short-term trades, fade extremes
Bottom Line:
This is a headline-driven, high-volatility market where discipline and flexibility are critical. Traders should stay tactical and selective, while investors should remain patient and defensive until clearer trends and stronger market breadth emerge.
.
The US Markets
U.S. Market Indexes — Analytical Overview
All major U.S. equity indices closed sharply lower on Friday, reinforcing a deteriorating short-term technical and sentiment backdrop. The Dow Jones Industrial Average declined 793.47 points (-1.73%) to 45,166.64. The S&P 500 fell 108.31 points (-1.67%) to 6,368.85, while the Nasdaq Composite dropped 459.72 points (-2.15%) to 20,948.36. The Russell 2000 lost 43.63 points (-1.75%) to close at 2,449.70, marking its second consecutive session of significant declines.
From a technical perspective, market conditions have weakened materially. All major indices are now trading below key reference levels, including their 200-day moving averages—a widely watched indicator of long-term trend direction. The breakdown below these levels suggests a shift from bullish to neutral-to-bearish structure.
The Nasdaq is showing particular vulnerability, having recorded two consecutive sessions with losses exceeding 2%. This type of back-to-back selling often signals institutional distribution rather than retail-driven volatility, raising the probability of continued downside or, at minimum, prolonged consolidation.
The Dow and Nasdaq are now meaningfully extended below their 200-day moving averages, indicating potential oversold conditions in the short term. However, in stressed market environments, oversold conditions can persist, and attempts at rebounds may lack durability without strong breadth and volume confirmation.
Small-cap weakness, reflected in the Russell 2000, is another cautionary signal. Underperformance in small caps typically points to tightening financial conditions and reduced risk appetite, which can precede broader market softness.
Key Takeaways for Traders & Investors
- Trend Shift: Break below 200-day moving averages suggests a structural weakening
- Momentum: Accelerating downside, particularly in tech-heavy Nasdaq
- Breadth & Risk Appetite: Weak participation, with small caps under pressure
- Market Character: Transitioning toward risk-off, headline-sensitive behavior
In summary, U.S. markets are exhibiting clear signs of stress, with technical breakdowns across all major indices. Until indices reclaim key moving averages and stabilize, rallies should be treated cautiously—either as short-term trading opportunities or potential bull traps rather than the start of a sustained recovery.

Friday’s U.S. Market Statistics — Breadth & Volume Analysis
Market internals on Friday confirmed a broad-based risk-off environment, with selling pressure accelerating across both major exchanges.
New York Stock Exchange (NYSE)
Declining issues overwhelmingly outpaced advancing issues, with 3,505 decliners versus 1,036 advancers and 327 unchanged. This resulted in a decliner-to-advancer ratio of 3.38:1—clear evidence of heavy, market-wide distribution rather than isolated sector weakness.
New 52-week lows surged to 410, significantly outnumbering the 134 new highs. This marks a sharp deterioration from Thursday’s readings (127 lows vs. 115 highs), indicating downside momentum is expanding and affecting a growing number of stocks.
Total trading volume rose to 5.38 billion shares, up 9% from the prior session. Rising volume alongside falling prices is a classic confirmation of institutional selling pressure, reinforcing the bearish tone of the session.
NASDAQ
Breadth conditions were even weaker on the Nasdaq. Decliners totaled 3,807 compared to 1,036 advancers, with 301 unchanged, producing a decliner-to-advancer ratio of 3.67:1—roughly seven decliners for every two advancers.
New lows expanded aggressively to 577, while new highs dropped to just 50. Compared to Thursday (328 lows vs. 81 highs), this sharp increase in new lows highlights accelerating weakness, particularly in growth and technology segments.
Trading volume climbed to 8.99 billion shares, up 12% from the previous session. Similar to the NYSE, the combination of rising volume and declining prices points to sustained institutional distribution rather than temporary profit-taking.
Analytical Takeaways
- Breadth Collapse: Both exchanges show extreme negative breadth, signaling systemic weakness
- Expansion of New Lows: A rapid increase in 52-week lows suggests downside momentum is broadening
- Volume Confirmation: Rising volume on down days indicates institutional selling, not retail noise
- Market Regime: Conditions are consistent with a risk-off, defensive environment
Trader & Investor Implications
This level of breadth deterioration typically precedes either:
- A capitulation phase (sharp, high-volume selloff followed by a tradable bounce), or
- A prolonged corrective period with continued downside bias
Until breadth stabilizes (i.e., improving advance/decline ratios and contraction in new lows), long exposure should remain limited and tactical. Traders may find better opportunities in short-term setups, volatility trades, or relative strength plays rather than broad market participation.
U.S. Market Trading Plan — Week Ahead
With all major indices—including the S&P 500, Nasdaq Composite, Dow Jones Industrial Average, and Russell 2000—trading below their 200-day moving averages, the U.S. market has entered a defensive, risk-off regime. The focus for next week shifts from trend-following to capital preservation and tactical execution.
1. Core Strategy: Sell Strength, Don’t Chase Weakness
The primary bias remains bearish to neutral.
- Use relief rallies to reduce long exposure or initiate short-term bearish trades
- Avoid chasing downside momentum late in the move—risk of sharp countertrend bounces is elevated
- Expect high volatility and intraday reversals
2. Sector Positioning & Rotation
Overweight (Defensive / Relative Strength):
- Energy (commodity support)
- Materials (especially gold/silver miners)
- Select Utilities (defensive yield plays)
Market Neutral:
- Industrials (watch for divergence vs. broader market)
Underweight / Short Bias (on rallies):
- Technology (leading downside momentum; weak Nasdaq structure)
- Consumer Discretionary (demand sensitivity)
- Financials (pressure from macro uncertainty and rate volatility)
3. Key Trading Setups
A. Relief Rally Fade
- Look for 1–3 day rebounds in the Nasdaq Composite or S&P 500
- Enter short positions near resistance or prior breakdown levels
- Confirm with declining volume on rallies (bearish signal)
B. Defensive Momentum Continuation
- Stay long or trade pullbacks in gold and energy-linked equities
- Focus on relative strength vs. the broader indices
C. Capitulation Reversal (Conditional Setup)
- If a high-volume selloff coincides with extreme breadth (e.g., 4:1+ decliners), watch for:
- Intraday reversal patterns
- Strong closing bids
- This could offer short-term bounce trades, not trend reversals
4. Risk Management Framework
- Cut position sizes to 50% or less of normal exposure
- Use tight stop-losses due to increased volatility
- Avoid overexposure to correlated positions (especially tech-heavy trades)
- Limit overnight risk unless hedged
- Maintain elevated cash levels
5. Key Indicators to Monitor
- 200-day moving averages: Any reclaim would be an early stabilization signal
- Market breadth: Improvement in advance/decline ratios is critical
- New highs vs. new lows: Contraction in new lows needed for a bottoming process
- Volatility trends: Sustained spikes confirm continued stress
- Bond yields & commodities: Cross-asset signals influencing equity direction
6. Tactical Scenarios for the Week
Bearish Continuation (Base Case):
- Indices fail to reclaim key levels → continued downside
- Strategy: Stay defensive, short rallies, hold cash
Oversold Bounce (Short-Term):
- Sharp rally after heavy selling → likely technical rebound
- Strategy: Trade tactically, fade into resistance
Stabilization Attempt (Low Probability):
- Breadth improves, indices reclaim key levels
- Strategy: Gradually reintroduce long exposure, focus on leaders
Bottom Line
The U.S. market is no longer in a trend-friendly environment. It is volatility-driven, technically weak, and breadth-confirmed bearish. For both traders and investors, the priority next week is risk control, tactical flexibility, and disciplined execution.
This plan aligns closely with your TSX outlook—both markets are being driven by the same macro forces, reinforcing a unified defensive and selective trading approach.
NOTICE TO READERS
The Canadian Vanguard Stock Market is about empowering you to build and manage your wealth by yourself. There is certainly no magic in managing finances or wealth but one needs to know what to do and commit to doing what is needed. When you are ready to start the journey to Put Your Destiny In Your Own Hands, read The Canadian Vanguard every market day. If you need more information please Contact Us
Our readers are strongly advised to conduct their own research into individual stocks before making a purchase decision. In addition, investors are advised that past stock performance is no guarantee of future price appreciation. Any recommendation is not a guarantee of any particular stock’s future prices, and The Canadian Vanguard accepts no responsibility or liability for investors’ or readers’ purchases.
Stocks In The News/ Stocks To Watch and Market Strategy will soon be available but only to Paying Subscribers. The dollar sign “$” in the Toronto Market section in the articles only stands for Canadian dollar and in the US market section “$” stands for US dollar.
(c) This article is published by The Canadian Vanguard on March 27, 2026