U.S. Stocks Extend Rally as Ceasefire Optimism Builds; TSX Slips on Sector Weakness
The Canadian Vanguard Stock Market Report – Thursday April 9, 2026 Edition.
.
The Toronto Market
Toronto Market Index Today
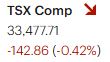
The S&P/TSX Composite Index declined 142.85 points (-0.42%) to close at 33,477.71, snapping a six-session winning streak. The index opened higher but quickly reversed, shedding approximately 200 points within the first hour—suggesting early distribution and profit-taking near recent highs. Price action remained negative throughout the session, with no meaningful intraday recovery.
From a technical perspective, today’s move appears to be a controlled pullback rather than a trend reversal. The index continues to hold well above its 25-day, 50-day, and 200-day moving averages, maintaining a bullish intermediate- and long-term structure. Momentum remains intact, although short-term indicators may be entering overbought reset territory.
Notably, the TSX is still trading within 3% of its all-time closing high of 34,541 (March 1), keeping the broader uptrend firmly in place. Today’s decline may reflect consolidation near resistance, with traders watching for either a continuation breakout or a deeper retracement toward key moving average support levels.

![]()
Thursday’s TSX Market Internals
Market breadth on the TSX was constructive, with advancing issues outpacing decliners. A total of 1,201 stocks advanced versus 928 declines, resulting in an advancer-to-decliner ratio of 1.29:1—effectively six advancers for every five decliners. An additional 144 issues closed unchanged, indicating moderately positive participation beneath the surface.
New highs continued to expand, with 111 securities posting 52-week highs versus 28 registering new lows. While the increase in new highs (up from 96 in the prior session) supports ongoing bullish momentum, the concurrent rise in new lows (from 14) suggests some emerging dispersion and sector-level weakness.
Trading activity moderated, with total volume declining 13% to 520.1 million shares from 594.3 million shares in the previous session. The lighter volume on mixed internals may point to reduced conviction behind recent price action, particularly following the prior multi-session advance.
Thursday’s Toronto Market Wrap-Up Report
The S&P/TSX Composite Index declined 142.85 points (-0.42%) to close at 33,477.71, underperforming after six consecutive sessions of gains. The index opened higher but quickly reversed, dropping approximately 200 points within the first hour—an indication of early-session distribution and profit-taking. Price action remained negative throughout the day, with no sustained intraday recovery.
Despite the pullback, the broader technical structure remains constructive. The TSX continues to trade comfortably above its 25-day, 50-day, and 200-day moving averages, suggesting the move is a near-term consolidation rather than a reversal. The index also remains within 3% of its all-time closing high of 34,541 (March 1), keeping the primary uptrend intact.
Sector performance was mixed, with five of the ten sectors closing higher. Financials led the market, gaining 0.79%, followed by Healthcare (+0.66%) and Industrials (+0.49%). In contrast, Technology and Consumer Discretionary lagged significantly, declining 5.00% and 1.92%, respectively, while weakness in Basic Materials and Energy also weighed on the index.
Market breadth was moderately positive beneath the surface, with 1,201 advancing issues versus 928 decliners, producing an advancer-to-decliner ratio of 1.29:1. A total of 144 securities were unchanged. New 52-week highs expanded to 111 (up from 96 in the prior session), while new lows increased to 28 (from 14), pointing to some emerging dispersion across sectors.
Trading activity softened, with total volume declining 13% to 520.1 million shares. The lighter volume, combined with mixed breadth, suggests reduced conviction following the recent multi-session advance.
Sector Rotation & Financials Focus
Financials continue to attract attention, particularly Canada’s “Big Six” banks. Four of the six have posted six consecutive sessions of gains since March 30, reflecting renewed buying interest following weakness in March tied to geopolitical uncertainty stemming from the Middle East conflict.
The sector’s relative strength may indicate early-stage rotation out of Technology and into Financials, a shift that traders should monitor closely for confirmation through relative performance trends and volume expansion.
Among individual names:
- National Bank of Canada reached a new 52-week high, gaining 1.70% to close at $193.51 on 1.47M shares.
- The Bank of Nova Scotia rose 1.14% to $99.74, with 6.3M shares traded—well above its 50-day average of 4.7M, signaling strong participation.
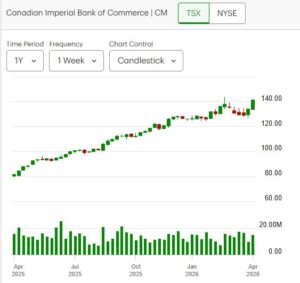
- Canadian Imperial Bank of Commerce advanced 1.39% to $141.59 on 3.42M shares, also exceeding its 50-day average volume of 2.8M.
- Toronto-Dominion Bank remains in a sustained uptrend that began in early April.
Notable Movers
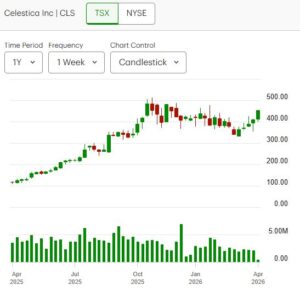
- Celestica Inc. extended its recent momentum, rising 2.25% to close at $453.07, following strong gains in the prior session.
- Shopify Inc., a heavyweight in the Technology sector, declined sharply by 6.52% to $155.43 on elevated volume of 6.81M shares, contributing significantly to sector weakness.
Bottom Line
Thursday’s session reflects a controlled pullback within an ongoing uptrend, accompanied by early signs of sector rotation. While headline index performance was negative, underlying breadth and strength in Financials suggest that capital is being selectively redeployed rather than exiting the market entirely. Near-term direction will likely depend on whether the TSX can consolidate above key moving averages and whether rotation into value-oriented sectors persists.
.
The US Markets
Thursday’s U.S. Market Indexes
U.S. equity markets extended their recent recovery, with all major indexes closing higher on the session. The Dow Jones Industrial Average advanced 275.88 points (+0.58%) to 48,185.80, while the S&P 500 gained 41.85 points (+0.62%) to finish at 6,824.66. The Nasdaq Composite outperformed, rising 187.42 points (+0.83%) to 22,822.42, making it the strongest major index on the day. The Russell 2000 Index added 15.85 points (+0.60%) to close at 2,636.31.
From a technical standpoint, the U.S. market continues to exhibit strong recovery momentum following the February–March drawdown. Since the start of April, price action has been decisively bullish, with all three major benchmarks—the Dow, S&P 500, and Nasdaq—reclaiming and holding above their 20-day, 50-day, and 200-day moving averages. This alignment signals a reestablishment of short-, intermediate-, and long-term uptrends.
The recent advance suggests that markets are close to fully retracing prior losses, with improving breadth and leadership from growth-oriented sectors, particularly Technology. The Nasdaq’s relative strength highlights renewed risk appetite, while broader participation across indexes supports the durability of the current rebound.

Thursday’s U.S. Market Wrap-Up Report
U.S. equity markets extended their recovery rally on Thursday, with all major indexes closing higher and maintaining strong technical positioning. The Dow Jones Industrial Average advanced 275.88 points (+0.58%) to close at 48,185.80, while the S&P 500 gained 41.85 points (+0.62%) to 6,824.66. The Nasdaq Composite led the session, rising 187.42 points (+0.83%) to 22,822.42, supported by continued strength in growth and technology names. The Russell 2000 Index added 15.85 points (+0.60%) to close at 2,636.31.
From a technical perspective, the market’s structure has improved materially. Following the February–March correction, all three major benchmarks—the Dow, S&P 500, and Nasdaq—have reclaimed and are holding above their 20-day, 50-day, and 200-day moving averages. This alignment confirms a reestablishment of bullish trends across short-, intermediate-, and long-term timeframes. The ongoing advance suggests that U.S. equities are close to fully retracing prior losses, with momentum continuing to build into April.
Market Internals
Breadth was broadly supportive of the rally, particularly on the New York Stock Exchange, where advancing issues significantly outnumbered decliners. A total of 2,975 stocks advanced versus 1,494 declines, producing an advancer-to-decliner ratio of 1.99:1. An additional 368 issues were unchanged, reflecting strong participation across sectors.
The NASDAQ Stock Market also posted positive breadth, though less robust. Advancers totaled 2,725 compared to 2,038 decliners, yielding an advancer-to-decliner ratio of 1.34:1, with 374 issues unchanged—indicative of more selective strength within growth-oriented segments.
New highs expanded on both exchanges, reinforcing the bullish backdrop. The NYSE recorded 254 new 52-week highs versus 83 new lows (up from 197 and 45, respectively, in the prior session). On the NASDAQ, 225 securities reached new highs while 169 posted new lows, compared to 209 highs and 83 lows previously. While the increase in new highs supports continued upside momentum, the concurrent rise in new lows—particularly on the NASDAQ—points to increasing dispersion and rotational activity beneath the surface.
Volume & Participation
Trading activity declined across both exchanges, suggesting some moderation in conviction following the recent rally. NYSE volume fell 17% to 4.99 billion shares, while NASDAQ volume also declined 17% to 8.99 billion shares. The lighter volume environment may reflect consolidation as markets approach key resistance levels.
Bottom Line
Thursday’s session reinforces the strength of the ongoing recovery in U.S. equities, with price action, trend alignment, and breadth all supporting a bullish near-term outlook. However, rising new lows and declining volume signal a more selective market environment, with increasing evidence of sector rotation and differentiation beneath the index level.
Traders should monitor whether breadth remains supportive and whether the major indexes can sustain their positions above key moving averages, as these will be critical indicators of the rally’s durability in the sessions ahead.
NOTICE TO READERS
The Canadian Vanguard Stock Market is about empowering you to build and manage your wealth by yourself. There is certainly no magic in managing finances or wealth but one needs to know what to do and commit to doing what is needed. When you are ready to start the journey to Take Charge and Put Your Destiny In Your Own Hands, read The Canadian Vanguard every market day. If you need more related information, Contact Us
Our readers are strongly advised to conduct their own research into individual stocks before making a purchase decision. In addition, investors are advised that past stock performance is no guarantee of future price appreciation. Any recommendation is not a guarantee of any particular stock’s future prices, and The Canadian Vanguard accepts no responsibility or liability for investors’ or readers’ purchases.
Stocks In The News/ Stocks To Watch and Market Strategy will soon be available but only to Paying Subscribers. The dollar sign “$” in the Toronto Market section in the articles only stands for Canadian dollar and in the US market section “$” stands for US dollar.
(c) This article is published by The Canadian Vanguard on April 9, 2026