The Canadian Vanguard Stock Market Report Weekend April 10-12, 2026 Edition
Markets Climb as Investors Look Past Inflation and Geopolitical Uncertainty
The Canadian Vanguard Stock Market Report is updated regularly during the weekend
The Toronto Market
Toronto Market Index Today
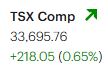
The S&P/TSX Composite Index rose 218.05 points, or 0.65%, to close at 33,695.76. The index opened strongly and maintained positive momentum throughout the session. In the final minutes of trading, it pushed higher, finishing near the day’s peak—just below the week’s high of 33,858 reached on Wednesday.
The index’s 52-week high remains 34,544.46, recorded on March 1. It is currently about 2.3% above both its 25-day and 50-day moving averages, which are now roughly aligned, and remains well above its 200-day moving average.
Although trading volume declined, market sentiment stayed firmly positive. The index has now posted gains in six of the past seven sessions.
![]()
. Sunday Evening Update – Oil price is up and Stock futures are down as peace talks between US and Iran in Islamabad, Pakistan ended without an agreement Saturday evening.
Friday’s TSX Market Statistics
Market breadth on the S&P/TSX Composite Index remained firmly positive, with advancing issues (1,207) comfortably exceeding declining issues (843). The resulting advancer-to-decliner ratio of 1.43:1 indicates broad-based participation in the rally, rather than gains being driven by a narrow group of large-cap stocks. The presence of 144 unchanged issues suggests relatively low indecision across the broader market.
New highs versus new lows further reinforce the constructive tone. The TSX recorded 117 new 52-week highs compared to just 24 new lows, an improvement over the previous session (111 highs vs. 28 lows). This expanding spread signals strengthening upward momentum and suggests continued leadership among outperforming stocks.
Despite these positive internal metrics, total trading volume declined by 20% to 416.6 million shares. This divergence—rising prices and strong breadth alongside lighter volume—may indicate reduced conviction behind the move or simply reflect typical end-of-week trading dynamics. While not immediately bearish, sustained advances on declining volume can sometimes precede short-term consolidation.
Overall, the data points to a market with solid underlying strength and improving momentum, though the drop in volume warrants monitoring for confirmation of continued upside.
TSX Market Wrap-Up – Friday
The S&P/TSX Composite Index advanced 218.05 points (+0.65%) to close at 33,695.76, finishing near the session high after maintaining positive momentum throughout the day. The index now sits just below this week’s peak of 33,858 and remains within reach of its 52-week high of 34,544.46.
From a technical perspective, the TSX continues to demonstrate strength, trading approximately 2.3% above its 25-day and 50-day moving averages—both of which are converging—and well above the 200-day moving average. This alignment reinforces the prevailing upward trend and suggests a stable bullish structure in the intermediate term.
Market internals confirmed the strength of the advance. Breadth was solid, with 1,207 advancing issues versus 843 decliners, producing a healthy 1.43:1 advancer-to-decliner ratio. This indicates that the rally was broad-based, rather than concentrated in a narrow segment of the market—an encouraging sign for both institutional investors and active traders.
Momentum also improved at the stock level. The TSX recorded 117 new 52-week highs compared to just 24 new lows, widening the positive spread from the prior session. This expansion in new highs signals continued leadership and suggests that capital is rotating into outperforming names, a key characteristic of sustainable advances.
However, total trading volume declined by 20% to 416.6 million shares. For traders, this introduces a note of caution: while price action and breadth are supportive, lighter volume may point to reduced conviction behind the move or typical end-of-week positioning. Sustained upside will likely require a pickup in participation.
The index has now closed higher in six of the past seven sessions, underscoring strong short-term momentum. For investors, the trend remains constructive with broad participation and improving highs. For traders, the combination of strong breadth and declining volume suggests a market that may continue to grind higher but could be vulnerable to short-term consolidation if volume does not confirm the move.
TSX Daily Trading Playbook – Preparing For The Next Market Session
. This section will be available in future to subscribers ONLY
Index Context
The S&P/TSX Composite Index closed at 33,695.76, extending its winning streak to six of the past seven sessions and finishing near the day’s high. The trend remains firmly bullish, supported by strong breadth and expanding new highs, though declining volume suggests slightly weaker conviction behind the move.
Key Levels to Watch
Resistance Levels:
- 33,858 – This week’s high; immediate breakout level
- 34,000 (psychological) – Key round-number resistance
- 34,544 – 52-week high; major upside target
Support Levels:
- 33,400 – 33,450 – Intraday support / recent consolidation zone
- 33,000 – Psychological and short-term support
- 32,900 area – Confluence of 25-day and 50-day moving averages
👉 Trading Insight:
A confirmed breakout above 33,858 on strong volume would signal continuation toward the 34,000–34,500 range. Failure at this level, especially on weak volume, raises the probability of short-term consolidation back toward 33,000.
Market Internals & Signals
- Breadth: Strong (1.43:1 advancers vs. decliners) → Broad participation
- New Highs vs. Lows: Expanding (117 vs. 24) → Strengthening momentum
- Volume: Down 20% → Watch for confirmation
👉 Interpretation:
This is a “healthy but cautious bullish” setup—internals support upside, but volume needs to confirm to sustain momentum.
Sectors to Watch
1. Energy
- Likely to remain a key driver given TSX weighting
- Watch for continuation if crude prices remain firm
- Strength here can push the index toward new highs
2. Financials
- Core leadership group
- If banks break higher, expect index-level follow-through
- Weakness here would quickly cap upside
3. Materials (Mining & Metals)
- Sensitive to global growth and commodity trends
- Increased new highs suggest rotation into cyclical names
4. Technology
- Smaller weighting but important for momentum
- Can act as a secondary confirmation signal for risk appetite
Trading Setups
Bullish Scenario (Primary Trend)
- Break and hold above 33,858
- Look for momentum trades in leading sectors (energy, financials)
- Confirmation signal: rising volume + expanding new highs
Range / Consolidation Scenario
- Failure to break resistance + continued low volume
- Expect chop between 33,400 – 33,850
- Favor short-term mean-reversion trades
Pullback Scenario (Lower Probability)
- Breakdown below 33,400
- Watch for retracement toward 33,000 / moving averages
- Likely driven by external macro or commodity weakness
Next-Session Outlook
The short-term trend remains upward, supported by strong breadth and improving momentum indicators. However, the decline in volume suggests that the market may pause or consolidate before making a decisive move higher.
- Bias: Bullish with caution
- Key Trigger: Volume confirmation on breakout
- Risk: Weak participation leading to short-term pullback
👉 Bottom Line:
Momentum favors the upside, but traders should remain selective and responsive. A high-volume breakout would validate continuation, while low-volume strength increases the likelihood of near-term consolidation.
The US Markets
U.S. Market Indexes
U.S. equities delivered a mixed performance, reflecting sector rotation and uneven momentum across major benchmarks.
The Dow Jones Industrial Average declined 269.23 points (-0.56%) to close at 47,916.57, weighed down by weakness in large-cap industrial and defensive names.
The S&P 500 slipped marginally by 7.77 points (-0.11%) to 6,816.89, showing relative resilience as gains in growth-oriented sectors helped offset broader softness.
In contrast, the Nasdaq Composite advanced 80.48 points (+0.35%) to 22,902.90, marking its second consecutive session as the top-performing index. However, the Nasdaq closed well below its intraday high, suggesting some profit-taking in high-growth names late in the session.
The Russell 2000 edged lower by 5.72 points (-0.22%) to 2,630.59, indicating continued hesitation in the small-cap space.

Friday’s U.S. Market Statistics
NYSE Internals: On the New York Stock Exchange, market breadth skewed negative, with declining issues (2,338) outpacing advancing issues (2,062). The resulting decliner-to-advancer ratio of 1.13:1 reflects mild but notable internal weakness, despite relatively modest index-level declines. A total of 366 issues closed unchanged, indicating some degree of market indecision.
New highs vs. new lows weakened meaningfully. The NYSE recorded 165 new 52-week highs, down sharply from 254 in the prior session, while new lows held steady at 83. This contraction in new highs suggests waning upside momentum and a possible cooling in leadership stocks.
Volume declined by 11% to 4.44 billion shares, reinforcing the idea that selling pressure was not aggressive, but also that buying conviction may be fading in the short term.
NASDAQ Internals: At the NASDAQ, breadth was more decisively negative. Declining stocks (2,856) significantly outnumbered advancing stocks (1,917), producing a 1.48:1 ratio—approximately three decliners for every two advancers. This divergence is notable given that the NASDAQ index itself closed higher, highlighting narrow leadership concentrated in large-cap technology names.
New highs and new lows were nearly balanced, with 173 highs versus 176 lows. Compared to the previous session (225 highs vs. 169 lows), this shift indicates deteriorating internal momentum and a loss of broad-based participation.
Trading volume held steady at approximately 8.97 billion shares, suggesting that while participation levels were consistent, capital rotation—not expansion—drove price action.
Cross-Market Analysis and Interpretation
👉 Key Divergence:
- Index performance (especially Nasdaq Composite strength) contrasts with weak underlying breadth
- Sign of a narrowing rally, led by a smaller group of large-cap stocks
👉 Momentum Review:
- Falling new highs (NYSE + NASDAQ) → slowing upside momentum
- Stable-to-negative breadth → reduced participation
👉 Volume Insight:
- NYSE: Falling volume → lack of strong conviction
- NASDAQ: flat volume → steady participation but no expansion in buying pressure
Trader & Investor Takeaways
- Caution on Breakouts: Negative breadth reduces reliability of upside breakouts
- Focus on Leaders: Strength remains concentrated in select large-cap growth stocks
- Watch for Confirmation: A sustainable rally will require improvement in breadth and expansion in new highs
- Risk Evaluation: Weak conditions increase the likelihood of short-term consolidation or pullback
Bottom Line
While headline indexes—particularly the Nasdaq Composite—continue to show resilience, underlying market internals tell a more cautious story. Weakness in breadth, declining new highs, and muted volume trends point to a fragile advance driven by narrowing leadership rather than broad market strength.
Commodities and Bonds
All stock market data below reflect market close on Friday. Futures data are as of Sunday evening, April 12, at 11:00 PM (EST).
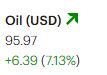
Oil: Oil prices rose as high as $115 per barrel earlier in the week but declined to $96.60 by Friday’s close. U.S. oil is currently up 8.70%, trading at $104.94 at the time of this update.
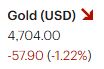
Gold and Silver: Gold is down $52.20, or 1.10%, to $4,734.40 per troy ounce. Silver is down $2.22, or 2.90%, to $74.23 per ounce as of 11:00 PM EST Sunday.
Bitcoin (BTC-USD): Bitcoin is down $55.14, or 0.07%, currently trading at $71,094.90 at the time of this update.
10-Year Treasury Yield: The 10-year Treasury yield fell three basis points to 4.32% on Friday. It is currently at 4.351% as of 11:00 PM EST Sunday.
After-Hours Action: Futures reopened at 6:00 PM Sunday, as usual.
- Dow futures are down 385.00 points, or 0.80%, at 47,746.00
- S&P 500 futures are down 53.50 points, or 0.78%, at 6,802.00
- Nasdaq 100 futures are down 222.50 points, or 0.89%, at 25,059.75
(All figures are as of 11:00 PM EST Sunday.)
Reminder:
Overnight futures often have little correlation with the following day’s regular trading session. All figures reflect market conditions at the time of capture only.
NOTICE TO READERS
The Canadian Vanguard Stock Market is about empowering you to build and manage your wealth by yourself. There is certainly no magic in managing finances or wealth but one needs to know what to do and commit to doing what is needed. When you are ready to start the journey to Put Your Destiny In Your Own Hands, read The Canadian Vanguard every market day. If you need more information please Contact Us
Our readers are strongly advised to conduct their own research into individual stocks before making a purchase decision. In addition, investors are advised that past stock performance is no guarantee of future price appreciation. Any recommendation is not a guarantee of any particular stock’s future prices, and The Canadian Vanguard accepts no responsibility or liability for investors’ or readers’ purchases.
Stocks In The News/ Stocks To Watch and Market Strategy will soon be available but only to Paying Subscribers. The dollar sign “$” in the Toronto Market section in the articles only stands for Canadian dollar and in the US market section “$” stands for US dollar.
(c) This article is published by The Canadian Vanguard on April 11, 2026