
Major U.S. Indexes Retreat as Geopolitical Tensions and Rising Oil Prices Weigh on Investor Sentiment
The Canadian Vanguard Stock Market Report Thursday July 23, 2026 Edition
.
The Toronto Market
Thursday’s Toronto Market Summary
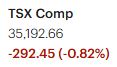
The S&P/TSX Composite Index declined 292.45 points, or 0.82%, to close at 35,192.66.
The TSX is showing signs of entering a near-term corrective phase. After posting gains in the previous two sessions, buying momentum faded quickly. While yesterday’s advance was relatively modest, today’s decline more than erased those gains, suggesting that sellers have regained control in the short term. Market breadth also remained negative, indicating that weakness was broad-based rather than concentrated in a few sectors.

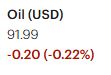
Oil prices were modestly higher at the time of writing. Although the move was limited, the geopolitical risks supporting crude prices remain in place, reducing the likelihood of a meaningful pullback in the near term. This could continue to provide support for the energy sector and, by extension, the broader TSX.
Despite today’s weakness, the medium-term technical outlook remains constructive. The TSX continues to trade above its 25-day moving average and remains comfortably above both the 50-day and 200-day moving averages, indicating that the broader uptrend is still intact. However, traders should monitor whether selling pressure persists over the coming sessions, as a sustained break below the 25-day moving average could signal a deeper correction.
Thursday’s TSX Market Statistics
Market breadth was narrowly positive on the Toronto Stock Exchange, with 1,110 advancing issues compared with 1,072 declining issues, resulting in an advancer-to-decliner ratio of 1.03:1. An additional 139 issues closed unchanged. While advancers slightly outnumbered decliners, the margin was too narrow to suggest broad-based buying conviction.
The exchange recorded 61 new 52-week highs and 78 new 52-week lows, compared with 115 new highs and 39 new lows in the previous session. The sharp decline in new highs, combined with the increase in new lows, points to weakening underlying market momentum and a deterioration in internal market strength despite the marginally positive advance-decline statistics.
Geopolitical tensions in the Middle East continue to provide support for crude oil prices. While the increase in oil prices has been gradual, persistent strength in energy prices could complicate the inflation outlook and reduce expectations for additional interest rate cuts later this year. That uncertainty appears to be weighing on investor sentiment and contributed to today’s softer market tone.
Trading activity increased, with total TSX volume reaching 420.1 million shares, approximately 11% above the 377.7 million shares traded in the previous session. The higher volume accompanying today’s market weakness suggests increased selling activity and warrants close monitoring in the coming sessions.
.
Thursday’s Toronto TSX Market Wrap-Up
The S&P/TSX Composite Index fell 292.45 points (-0.82%) to close at 35,192.66, as geopolitical tensions in the Middle East weighed on investor sentiment across North American markets. Rising crude oil prices, driven by ongoing regional uncertainty, supported energy shares but also raised concerns that higher energy costs could complicate the inflation outlook and reduce the likelihood of additional interest rate cuts later this year.
After two sessions of gains, the TSX lost momentum as sellers regained control. Today’s decline more than erased the previous session’s advance, suggesting that the market may be entering a short-term corrective phase. Despite the weakness, the broader technical picture remains constructive, with the TSX continuing to trade above its 25-day, 50-day, and 200-day moving averages.
Market internals reflected a weakening tone. Although advancing issues narrowly outnumbered declining issues (1,110 versus 1,072), the margin was too small to indicate broad-based buying conviction. More concerning was the deterioration in new highs and new lows. The TSX recorded 61 new 52-week highs and 78 new 52-week lows, a sharp reversal from the previous session’s 115 new highs and 39 new lows. This shift suggests that underlying market momentum weakened considerably as the session progressed.
Trading activity also increased, with 420.1 million shares changing hands, approximately 11% above the previous session’s volume. Higher volume accompanying a broad market decline suggests that institutional selling activity may have increased and is worth monitoring over the next several trading sessions.
Sector Performance
Only three of the eleven major TSX sectors finished higher on Thursday.
- Energy: +1.27%
- Utilities: +0.76%
- Industrials: +0.07%
The strongest gains were concentrated in the Energy sector as crude oil prices continued to climb.
The remaining sectors closed lower, led by:
- Information Technology: -4.10%
- Materials: -1.59%
- Financials: -1.16%
The weakness in technology extended the recent rotation away from high-growth stocks, while profit-taking also emerged in Financials after the sector’s strong rally over recent weeks.
Financials
Canada’s Big Six banks all closed lower, reflecting profit-taking after an extended advance.
- Toronto-Dominion Bank (TD): -1.67%, 4.2 million shares traded
- Royal Bank of Canada (RY): -1.44%, 3.66 million shares traded
- Bank of Montreal (BMO): -1.31%, 2.5 million shares traded
- Bank of Nova Scotia (BNS): -1.20%, 5.8 million shares traded
Financial stocks had been among the market leaders in recent weeks and had become technically extended. At this stage, the pullback appears consistent with normal profit-taking rather than a confirmed trend reversal. However, traders should closely monitor whether buyers return over the next several sessions or whether selling pressure broadens into a deeper correction.
Stocks in Focus
Enbridge Inc. (ENB) gained 0.18% to close at $79.43, with 3.1 million shares traded, continuing to benefit from strength in the energy sector.
Shopify Inc. (SHOP) fell 5.14% to $157.86, extending weakness in growth and technology shares as investors continued rotating toward more defensive sectors.
Celestica Inc. (CLS) declined 1.43% to $473.03, with 304,200 shares traded.
Among mining stocks, precious metals producers outperformed as investors sought defensive exposure.
- Montage Gold Corp. (MAU): +10.40% to $16.98, with approximately 1.0 million shares traded.
- Agnico Eagle Mines Ltd. (AEM): +3.52% to $206.89, with 1.2 million shares traded.
- Franco-Nevada Corp. (FNV): +3.06% to $301.70, with 381,500 shares traded.
.
Key Takeaways for Traders and Investors
- The TSX experienced a broad pullback after two positive sessions, with today’s decline more than offsetting yesterday’s gains, indicating that short-term momentum has weakened.
- Market internals deteriorated noticeably, as the number of new 52-week highs dropped sharply while new lows increased. This suggests underlying market participation has weakened despite a slightly positive advance-decline ratio.
- Rising oil prices continue to support the Energy sector, but persistent geopolitical risks could keep inflation concerns elevated and influence expectations for interest rate policy.
- Financials appear to be undergoing a healthy round of profit-taking following a strong rally. The next several sessions should determine whether this remains a normal pullback or develops into a broader correction.
- Technology remains under pressure as investors continue rotating into more defensive and commodity-oriented sectors.
- From a technical perspective, the longer-term uptrend remains intact. The TSX continues to trade above its 25-day, 50-day, and 200-day moving averages, but traders should watch whether the index can hold above its 25-day moving average. A decisive break below that level would increase the probability of a deeper near-term correction.
.
The US Markets
U.S. equity markets posted broad-based losses on Thursday as rising geopolitical tensions in the Middle East and higher crude oil prices weighed on investor sentiment.
The Dow Jones Industrial Average fell 506.93 points (-0.97%) to 51,711.65. The S&P 500 declined 90.66 points (-1.21%) to 7,408.30, while the Nasdaq Composite dropped 553.21 points (-2.15%) to 25,137.69. The Russell 2000 Index lost 19.78 points (-0.67%), closing at 2,940.16.

Thursday’s selloff was significantly steeper than the previous session’s modest decline, indicating that selling pressure intensified as investors reduced risk exposure. The Dow Jones Industrial Average remained under pressure throughout the trading session, opening sharply lower and failing to mount a meaningful recovery before the closing bell. The index has now declined approximately 1,200 points since July 7, marking one of its weakest stretches this month.
Investor concerns centered on escalating geopolitical tensions involving the United States and Iran, which continued to push crude oil prices higher. Although the increase in oil prices has been gradual, sustained strength in energy prices raises the risk of renewed inflationary pressures. Higher fuel costs could slow progress on inflation and potentially delay additional interest rate cuts by the Federal Reserve. Those concerns prompted investors to rotate away from growth-oriented sectors, particularly technology, and adopt a more defensive posture.
Technical Outlook
From a technical perspective, the major indexes are beginning to diverge.
- Dow Jones Industrial Average: The recent decline has weakened short-term momentum, although the longer-term trend remains constructive.
- S&P 500: The index continues to trade above its 25-day, 50-day, and 200-day moving averages, indicating that the primary uptrend remains intact despite Thursday’s pullback.
- Russell 2000: The small-cap benchmark has slipped below its 25-day moving average, suggesting that near-term momentum has weakened. However, it remains comfortably above its 50-day and 200-day moving averages, keeping the intermediate-term uptrend intact.
- Nasdaq Composite: The technology-heavy index now trades below its 25-day, 50-day, and 200-day moving averages. This represents the weakest technical profile among the major U.S. indexes and indicates that the Nasdaq remains under significant selling pressure. Until the index reclaims these key technical levels, rallies may continue to encounter resistance, and traders should expect elevated volatility in the technology sector.
Overall, Thursday’s market action reflected a shift toward risk aversion. While the longer-term uptrends in the Dow, S&P 500, and Russell 2000 have not yet been broken, deteriorating momentum, persistent geopolitical uncertainty, and rising energy prices suggest traders should remain cautious. The Nasdaq continues to be the weakest major index and will likely serve as a key barometer of broader market risk appetite in the days ahead.
.
Thursday’s U.S. Market Statistics
New York Stock Exchange (NYSE): Market breadth remained decisively negative on the New York Stock Exchange for a third consecutive session, with 3,366 declining issues versus 1,124 advancing issues, producing a decliner-to-advancer ratio of 2.99:1. An additional 395 issues closed unchanged. Nearly three stocks declined for every one that advanced, underscoring the broad-based nature of Thursday’s weakness.
The exchange recorded 142 new 52-week highs and 161 new 52-week lows, compared with 113 new highs and 116 new lows in the previous session. The ratio of new highs to new lows deteriorated to 0.88, down from 0.97 yesterday, indicating a further weakening in underlying market momentum.
NYSE trading volume totaled 5.59 billion shares, approximately 5% higher than the 5.30 billion shares traded in the previous session. The combination of negative market breadth and higher trading volume suggests that selling pressure intensified during the session. While elevated volume does not by itself confirm institutional distribution, it does indicate increased market participation as investors reduced risk exposure.
Overall, the NYSE statistics point to a market experiencing broad-based selling pressure, with deteriorating internals and weakening momentum.
Nasdaq: Selling pressure was even more pronounced on the Nasdaq, where 3,467 stocks declined compared with 1,374 advancing issues, resulting in a decliner-to-advancer ratio of 2.52:1. An additional 423 issues finished unchanged. Negative market breadth persisted for a second consecutive session, reflecting continued weakness in growth and technology stocks.
The deterioration in market internals was particularly evident in the exchange’s new high/new low statistics. The Nasdaq recorded only 64 new 52-week highs compared with 346 new 52-week lows, versus 88 new highs and 188 new lows in the previous session. The number of new lows surged approximately 84% from the prior day, highlighting a significant expansion in downside participation and confirming that selling pressure broadened considerably across the market.
Total Nasdaq trading volume reached 7.89 billion shares, down approximately 7% from 8.41 billion shares in the previous session. Although trading activity declined modestly, the sharp increase in new 52-week lows suggests that selling pressure remained widespread, particularly among technology and higher-growth companies.
.
Key Takeaways for Traders and Investors
- Market internals deteriorated across both major U.S. exchanges, with decliners significantly outnumbering advancers on both the NYSE and Nasdaq.
- The increase in new 52-week lows—especially on the Nasdaq—indicates that selling pressure broadened beyond a handful of large-cap stocks and extended across a wider segment of the market.
- Rising geopolitical tensions and higher crude oil prices continue to weigh on investor sentiment, encouraging a rotation toward more defensive sectors while reducing appetite for growth stocks.
- The higher NYSE trading volume accompanying broad market weakness warrants attention, as it may indicate increased institutional activity, although additional sessions are needed to confirm whether a sustained distribution phase is developing.
- Until market breadth improves and the number of new highs begins to recover, traders may wish to remain selective with new long positions, focus on relative strength, and allow the market to demonstrate renewed buying conviction before becoming more aggressive.
.
Thursday’s U.S. Market Wrap-Up
U.S. equities experienced broad-based selling on Thursday as investors continued to reduce risk exposure amid escalating geopolitical tensions in the Middle East and persistent strength in crude oil prices. The Dow Jones Industrial Average declined 0.97%, the S&P 500 lost 1.21%, the Nasdaq Composite fell 2.15%, and the Russell 2000 slipped 0.67%.
The market’s primary theme in recent weeks has been sector rotation away from high-growth technology stocks. Initially, investors rotated into Financials and other cyclical sectors. However, Thursday’s trading suggested that the rotation has broadened into a more defensive posture as geopolitical uncertainty and rising energy prices increasingly influence investor sentiment.
The technology-heavy Nasdaq remained the weakest of the major U.S. indexes, extending its recent decline. The index now trades below its 25-day, 50-day, and 200-day moving averages, reflecting significant technical deterioration. A decline of more than 2% in an index dominated by large-cap technology companies typically indicates widespread selling pressure across the growth sector rather than weakness in only a handful of stocks.
Market internals also weakened considerably. On the New York Stock Exchange, declining issues outnumbered advancing issues by nearly 3-to-1, while the Nasdaq recorded more than five declining stocks for every two advancing stocks. The sharp increase in new 52-week lows, particularly on the Nasdaq, points to expanding downside participation and suggests that selling pressure has become more broadly based.
Trading activity on the NYSE increased approximately 5% from the previous session, while Nasdaq volume eased modestly. The higher NYSE volume accompanying broad market weakness warrants close attention, as it may indicate increased institutional participation in the selling, although additional sessions are needed to confirm whether a sustained distribution phase is developing.
Sector Performance
Only four of the eleven S&P 500 sectors closed higher.
- Health Care: +1.03%
- Industrials: +1.01%
- Utilities: +0.88%
- Energy: +0.63%
The strength in Health Care, Utilities, and Energy reflects a continued shift toward more defensive and commodity-related sectors as investors reassess risk.
Among the weaker-performing sectors:
- Information Technology: -1.86%
- Financials: -0.65%
- Consumer Discretionary (Retail): The session’s weakest-performing sector.
The market rotation that characterized recent sessions appears to be evolving beyond a simple shift between sectors. Investors are increasingly emphasizing capital preservation and defensive positioning as macroeconomic and geopolitical risks become more prominent.
Market Outlook
The principal macroeconomic concern remains the impact of higher energy prices. Continued geopolitical tensions have supported crude oil prices, raising the possibility that inflation could remain elevated longer than previously expected. If sustained, higher energy costs could influence expectations for future Federal Reserve policy by reducing the likelihood of near-term interest rate cuts.
While markets have thus far shown resilience, a prolonged period of geopolitical uncertainty and rising oil prices could continue to pressure corporate earnings, consumer spending, and overall investor confidence. The duration and intensity of these risks will likely play an important role in determining market direction over the coming weeks.
Company Highlights
Semiconductor stocks delivered mixed performance despite the broader weakness in technology.
- Micron Technology (MU) gained 3.20%, leading the semiconductor group on strong trading volume of 40.2 million shares.
- Sandisk Corp. (SNDK) advanced 0.69%, with 12.8 million shares traded.
- Western Digital Corp. (WDC) added 0.29%, with 5.7 million shares traded.
Cybersecurity stocks remained under pressure.
- Palo Alto Networks (PANW) declined 2.88%, with 5.9 million shares changing hands, reflecting continued weakness across growth-oriented technology stocks.
Key Takeaways for Traders and Investors
- Thursday’s selloff extended the recent deterioration in market momentum, with broad-based weakness across all major U.S. indexes.
- Market internals weakened significantly, as declining stocks overwhelmingly outnumbered advancing stocks and new 52-week lows expanded sharply, particularly on the Nasdaq.
- The Nasdaq remains the weakest major index from a technical standpoint, trading below its 25-day, 50-day, and 200-day moving averages. Until those levels are reclaimed, rallies in technology stocks may remain vulnerable to selling pressure.
- Leadership continues to shift toward defensive sectors such as Health Care, Utilities, and Energy, while technology and other growth-oriented sectors remain under pressure.
- Rising crude oil prices and ongoing geopolitical tensions are becoming increasingly important macro drivers. If energy prices remain elevated, inflation concerns could persist and reduce expectations for additional Federal Reserve rate cuts.
- Traders should continue emphasizing risk management, monitor market breadth and trading volume for signs of institutional buying or selling, and look for improving technical confirmation before becoming more aggressive with new long positions.
NOTICE TO READERS
The Canadian Vanguard Stock Market is about empowering you to build and manage your wealth by yourself. There is certainly no magic in managing finances or wealth but one needs to know what to do and commit to doing what is needed. When you are ready to start the journey to Take Charge and Put Your Destiny In Your Own Hands, start with reading The Canadian Vanguard every market day. If and when you need more related information or to advertise your business products or services in The Canadian Vanguard, Contact Us
Our readers are strongly advised to conduct their own research into individual stocks before making a purchase decision. In addition, investors are advised that past stock performance is no guarantee of future price appreciation. Any recommendation is not a guarantee of any particular stock’s future prices, and The Canadian Vanguard accepts no responsibility or liability for investors’ or readers’ purchases.
Stocks In The News/ Stocks To Watch and Market Strategy will soon be available only to Paying Subscribers. The dollar sign “$” in the Toronto Market section in the articles only stands for Canadian dollar and in the US market section “$” stands for US dollar.
(c) This article is published by The Canadian Vanguard on July 23, 2026